XAUUSD (Gold) | Bullish vs Bearish Scenario | Trading SetupBullish vs Bearish View
Bullish Scenario (Primary Bias – Trend Continuation)
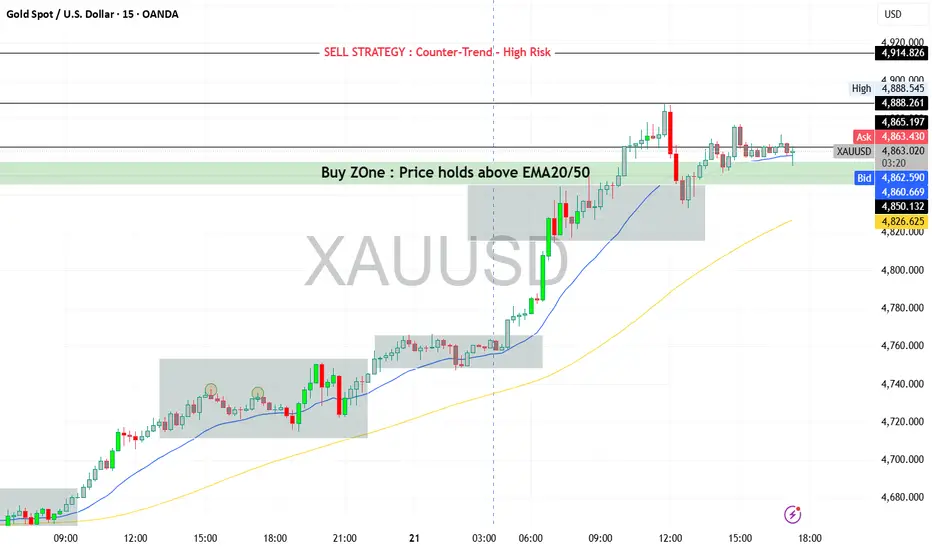
Trend remains strongly bullish as long as price holds above the pivot zone (4858–4845).
Buyers are in control, supported by ADX strength, MACD momentum, and moving average
alignment.
Break and hold above 4888 opens the door for further upside expansion.
Bearish Scenario (Corrective Pullback Only)
Bearish moves are considered corrective, not trend-reversing, unless price falls below 4800.
Overbought conditions may trigger short-term profit booking, but trend remains bullish
above key supports.
Key Levels to Watch
Resistance Levels
4888 – 4895 (Day high / breakout zone)
4914
4939 – 4950 (extension zone)
Support Levels
4858 – Pivot
4845
4829
4803
4773 (strong trend support)
Intraday Trading Strategy (Day Trading Plan)
Strategy Type:
Trend Continuation Buy-on-Dips
Buy Setup
Buy Zone: 4858 – 4845 (pivot support / minor pullback)
Confirmation:
Price holds above EMA20 / EMA50
Bullish rejection candle or continuation pattern on M15–M30
Targets
Target 1: 4888
Target 2: 4914
Target 3 (extension): 4939
Stop Loss
Intraday SL: Below 4825
Aggressive SL: Below 4800 (trend invalidation zone)
Alternative Sell Strategy (Counter-Trend – High Risk)
⚠️Only for experienced traders
Sell Zone: 4914 – 4940
Condition: Clear rejection + bearish divergence on M15/M30
Target: 4880 → 4858
Stop Loss: Above 4955
Preferred Trading Style Today
✔️Buy on dips
❌Avoid chasing price at highs
❌Avoid heavy counter-trend sells
Buysetup
Torrent Pharma Long Swing CandidateChart Analysis :
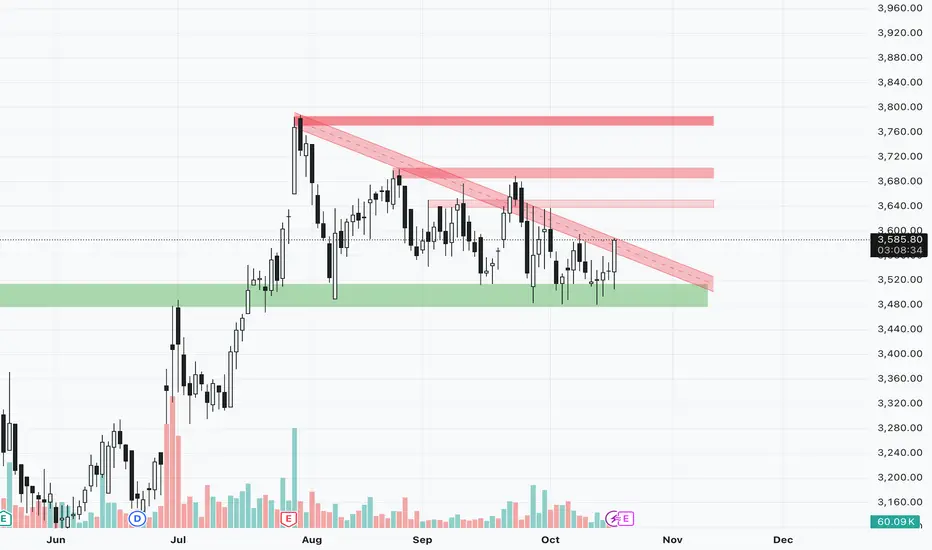
Price making a flat decending triangle pattern while holding a major weekly support of 3500 levels and looking to breakout above the trendline resistance zone and can be considered for long. One can enter here or wait for 3600 above daily close or one hour sustain above 3600.
Key Levels :
Targets (Resistance) - 3650/3685/3700/3750
StopLoss (Major Support) - 3500 below daily close
Disclaimer:
I am not SEBI registered. This analysis is for educational purposes only and not investment advice. Please do your own research before trading or investing.
Indian Hotels Company stuck in a triangle?Currently, what appears to be a triangle unfolding in Indian Hotels, we may see a fall for a final wave e and then a bounce to make new highs.

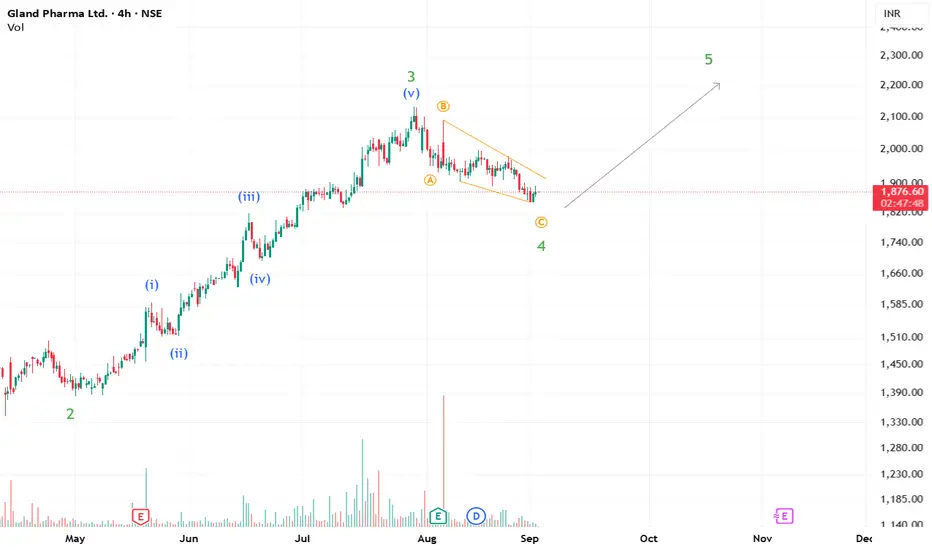
Bullish view for Gland Pharma?!!As probable Wave 4 approaches its end, we may see an upside to complete Wave 5 in Gland Pharma.
Lloyds Metals Hints at Final Wave V RallyThe wave principle suggests Lloyds Metals has likely completed Wave IV, with an upward Wave V move potentially unfolding toward new highs.

Can Reliance pull Nifty up in the coming week?Reliance seems to be completing its wave 4 and may see an upmove to complete its wave 5 in the coming week. Hoping it to be the leader for Nifty.

Centum Electronics Breakout. A 20% Up move possibility Pattern Analysis
1. Broadening Channel:
• This pattern is characterized by higher highs and lower lows, forming a widening range.
• It suggests increased volatility and indecision in the market.
2. Key Observations:
• The stock price is nearing the upper resistance line of the broadening channel (~₹2300–₹2400 levels).
• Historical data shows a strong rejection from this resistance zone.
• Support lies near ₹1800 (the lower boundary of the channel).
3. Volume:
• A breakout above the resistance line with significant volume could confirm an upward trend continuation.
• A lack of volume near the resistance could result in a pullback or consolidation.
4. Risk-Reward:
• If the stock breaks out, the potential upside could be near ₹3000 (as indicated in the projection).
• However, failure to break the resistance might result in a decline to the lower support (~₹1800 or lower).
Disclaimer- This is for educational purposes only. Please do your own research before investing.

JKPAPER#JKPAPER
Bounced from the Supply turned demand zone.
Volume is looking good.
Relative strength turned positive
Expecting a good return in the next few weeks.
Stop loss below the swing low or low of the last candle i.e. 444.75

BUY LONG AUDUSDLong position of AUDUSD as its at important support level touching the trendline where market has previously rejected and also having multiple wicks rejection making a strong support near trendline. Giving a buy/long opportunity on AUDUSD

BUY LONG GBPUSDLong position of GBPUSD as its at important support level and there is a rsi divergence and there is low volume in market near this support level also market has previous rejected this level and Fibonacci golden level and now market has again reached this level meaning a reversal in GBPUSD.

COALINDIA Trade Analysis for Buy using Wyckoff method.Wyckoff Story
Prior to trading range we were in uptrend and then we have Stoping action and CHoCH (Change of character). Let’s assume our bias is accumulation based on CHoCH as we don’t see lot of supply in the CHoCH.
Down wave Analysis
We can see that the volatility of the down wave is decreasing from Phase A to Phase D, confirming the accumulation Bias.
Volume Analysis
In Phase B we see increase in supply but the price is not able to go below the trading range, lot of effort to push the price down but fails, indicating effort vs result is not synced. Confirming the accumulation bias.
We have supply decrease from Phase A to Phase C indicating supply is being absorbed.
Sign of Strength
we have Major sign of strength in phase D with good demand volume indicating institutions are present in buying.
Final View
Bullish on stock with entry marked on the chart

MMTC Weekly time frame Analysis CMP 55 buy for target 68-80-90MMTC Weekly time frame Analysis CMP 55
buy for target 68-80-90-110-125-150-190-240-290-350+
Time duration 3-4 years

ASTRAL | SWING BUYAnalysis: Astral shows strong uptrend potential with solid technical indicators.
Entry: Consider current price
Disclaimer: For informational purposes only. Do your research or consult a financial advisor.

XRP : No confidence in the coin : Its about our powerful setup So such a shame with all those promises this coin remained being a bad investment for many.
XRP ARMY
Catch this one if you can
It might just cover up some time when you guys didn't make any profits
THIS ONE IS 3.69X trade as it looks like
Level Wise
Buy @ 0.51
TP @ 1.76/1.87
TP1 @ 1.369
SL @ 0.09

Unichem Labs - Daily Analysis CMP 297.45 Buy till 260 TargeUnichem Labs - Daily Analysis
CMP 297.45
Buy till 260
Target 334- 355- 378- 400- 426-446-500+
Holding Period 2-3 years

Alembic Ltd Weekly Analysis for Long duration NSE:ALEMBICLTD Weekly Analysis for long period
Trendline Breakout and sustained above strong support with LH LH structure
Buy Above 77 only of it sustained and give clear breakout with SL of 65 Strong Support as it was strong resistance since the beginning of its launch (1999).
T1 85
T2 98
T3 115

BORORENEW is trying to give new upmoveHigher Lows and Higher Highs Formations in daily chart.
Bullish view
Target 572, 590+
SL: 526
Time Frame : 15 days
Risk is yours and Reward is too yours totally

BAJFINANCE Set to Outperform Index Nifty 50 Attached: BAJFINANCE/ NIFTY 50 Daily Chart as of 18th May 2023
A Double Bottom/ Inverted Head & Shoulder Pattern Breakout is Clear in this Chart
Price is also moving in a Channelized/ Impulsive Manner
And so it is Set the Measured Move Target indicated by the Up Arrow
Similarly, on the Price Chart of Bajaj Finance, Price can head to 7400 as that is the Pattern Target for the same. It is an OUTPERFORMANCE/ BULLISH Setup!

PGHH Breakout BUY!Attached: PGHH Daily Chart as of 23rd June 2023
Pharma Sector is showing Strength while the Broad Market goes Cold witnessing Profit Booking
And so this is one Pharma MNC Stock with a Buy Setup
- Price has given a Breakout Buy Signal on Friday
- Either Wave 3 or Wave C Upside at play
- Stop Loss can be put at Low of the Day or < 13950
2 Upside Targets for this Move are:
T1= 14600
T2= 14930
Can extend to 1.618/ 1.75 Fib level as marked in the chart

UTIAMC Cup & Handle Breakout BUY!Attached: UTIAMC Daily Live Chart as of 30th June 2023
- Today All AMC Stocks have seen a Massive Upsurge and it appears there are Tailwinds for this Sector hence Strength within these Stocks
- Price has given a Classic Cup and Handle Breakout today on the back of Strong Price Volume Action
One can buy at Current Market Price
For a Target of ~ 900
And Stop Loss < Day Low

MFSL Breakout BUY!MFSL LONG SETUP
Attached: Daily Chart as of 21st June 2023
- Price has activated an Inverted Head & Shoulders/ Cup & Handle/ Bull Flag Breakout today on the back of High Volumes (Price Volume Pattern BO)
- Laggard from Insurance is finally joining in the Sectoral Rally (Sector Tailwinds)
- The previous Dip halted at 0.382, ABC corrective (Wave 3 or Wave C upside pending)
- Daily RSI crossed above 70 today
- Daily MACD gave a Buy Signal today
Upside Target= 785/ 807🎯📈
Stop Loss= Today's Low (< 710)

BANKBARODA Long SetupAttached: Daily Chart as of 16th June 2023
Holding above 182, a Target of ~ 200 is pending🎯📈
Rationale behind this Setup:
- Observe Multiple Volatility Contractions as Price is forming a VCP
- Strength on any Dip as it gets bought
- Higher Highs and Higher Lows are intact
- Price trading near 52 week high zone
- PSU Banks are doing better than Private Banks so the money flow is shifting

PAYTM Breakout Buy Signal!Attached: NSE:PAYTM Daily Chart as of 5th May 2023
Everybody is talking about ONDC on Twitter and how it is disrupting Zomato and Swiggy. Apparently you can use ONDC via PAYTM to order food online
(Note: Open Network for Digital Commerce (ONDC) is an initiative aiming at promoting open networks for all aspects of exchange of goods and services over digital or electronic networks)
And the Stock Chart of PAYTM also shows Investor Interest/ Buying Activity
Price gave a Breakout Buy Signal on Friday 5th May supported by Volume Activity on the back of this ONDC Disruption News
