PURVANKARA - 3 Months Consolidation BreakoutPuravankara Ltd
1) Time Frame - Daily.
2) The Stock has been in a Consolidation since (January, 2024). Now It has given a Consolidation breakout & Closed above it's (January, 2024) High with good bullish momentum candle & with huge volume in daily Time Frame.
3) The stock may find It's next resistance around the (price 353) in short term
5) Recommendation - Strong Buy
Candlestick Analysis

Swing trad Coalindia buy COALINDIA BUY 458
Stoploss:- 436
Target-1 🎯:- 487
Target -2 🎯:- 504
Target-3 🎯:- 527
Ye stock ka 487 Alltime high he or us ko breck kar dega to or upar ja sakta he so this is best stock buy for swing trad

GANDHAR - Weekly AnalysisIn the Weekly Chart of GANDHAR ,
we can see that, it is trying to build a Price Action in upward direction.
Possible momentums are shown in chart.

HINDUNILVR - Weekly AnalysisIn the Weekly Chart of HINDUNILVR ,
we can see that, Selling has stopped since 3 weeks.
Possible momentums are shown in chart.

ASPINWALL - Weekly AnalysisIn the Weekly Chart of ASPINWALL ,
we can see that; after the failure it is create a comeback.
Also, Halt candle is created at resistance.
Enter on breaking its High with Low as SL.

BAJAJCON - Weekly AnalysisIn the Weekly Chart of BAJAJCON ,
we can see that, it is creating a strong Price Action and has created a Inside candle.
Enter on breaking its High with Low as SL.

ZUARI - Weekly AnalysisIn the Weekly Chart of ZUARI ,
we can see that, After the breakout failure, it showed a bounce back from previous support level.
Now it has mad a Halt candle near resistance.
Enter on breaking its High with Low as SL.

BANDHANBNK - Weekly AnalysisIn the Weekly Chart of BANDHANBNK ,
we can see that, it has made a Decision making candle at Bottom.
Enter on breaking its High with Low as SL.

RITCO LOGISTICS - Bullish Consolidation with VolumesNSE: RITCO is closing with a bullish consolidation candle supported with volumes.
Today's volumes and candlestick formation indicates strong demand and stock should move to previous swing highs in the coming days.
The stock has been moving along the horizontal support for the past few days which is indicating demand.
One can look for a 13% to 21% gain on deployed capital in this swing trade.
The view is to be discarded in the event of the stock breaking previous swing low.
#NSEindia #Trading #StockMarketindia #Tradingview #SwingTrade

KOTAK MAHINDRA BANK - Bullish Momentum with VolumesNSE: KOTAKBANK is closing with a bullish momentum candle supported with volumes.
Today's volumes and candlestick formation indicates strong demand and stock should move to previous swing highs in the coming days.
The stock has been moving along the horizontal support for the past few days which is indicating demand.
One can look for a 8% to 13% gain on deployed capital in this swing trade.
The view is to be discarded in the event of the stock breaking previous swing low.
#NSEindia #Trading #StockMarketindia #Tradingview #SwingTrade

Rain Industries: A Prime Swing Trading Opportunity Post-Trend LiGreetings, traders!
We've identified an exciting swing trading opportunity with Rain Industries, which has just signaled a bullish trend line breakout. This movement is not only significant but is backed by increasing volume, indicating strong buying interest and investor confidence.
Why Buy Now?
Technical Breakout: The stock has convincingly broken above a critical resistance level, transforming it into a support zone. This breakout is a classic bullish signal, suggesting that the price is likely to continue its upward trajectory.
Volume & Indicators Support: The breakout is accompanied by a surge in trading volume, reinforcing the move's legitimacy. Additionally, key indicators like the MACD and RSI are in bullish territories, signaling further upside potential.
Solid Fundamentals : Rain Industries boasts robust fundamentals, including consistent revenue growth and strategic market positioning. This underpinning strength provides a safety net for the technical bullish scenario.
Market Sentiment: The breakout reflects a positive shift in market sentiment towards Rain Industries. As the economy rebounds, the company's diverse portfolio positions it well to capitalize on upcoming growth opportunities.
Trading Strategy:
Entry Point: Look to enter as close to the current level as possible, ensuring you're capitalizing on the breakout momentum.
Stop Loss: Set a stop loss just below the newly established support level to minimize potential losses.
Profit Targets: Establish profit targets at subsequent resistance levels, monitoring closely for signs of reversal.

MCX BULLDEX HEADING FOR A CORRECTION ?MCXBULLDEX is currently trading at 17350 which is a long term resistance zone (17300-17700) for it.
I'm expecting a profit booking in MCXBULLDEX from these level.
I'm creating short positions at CMP 17350 & will be adding more short positions if 17650-17700 comes & Hold with 18000 as SL.
I'm expecting minimum 1000 point fall from here & expecting 16400-16200 levels soon.
Disclaimer - Do not consider this as a buy/sell recommendation. I'm sharing my analysis & my trading position. You can track it for educational purposes. Thanks!

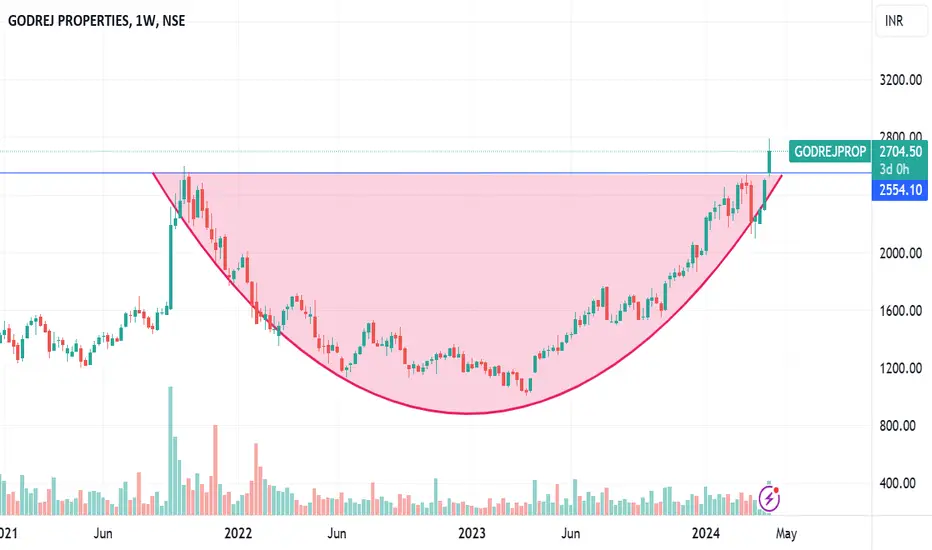
GODREJ PROPERTIES ROUNDING BOTTOM BREAKOUT Godrej properties breaking rounding bottom
good volume building up
#target can be 3800
follow ur sl as per ur risk management
EDUCATIONAL IDEA
BALAJI AMINES - Bullish Consolidation with VolumesNSE: BALAMINES is closing with a bullish consolidation candle supported with volumes.
Today's volumes and candlestick formation indicates strong demand and stock should move to previous swing highs in the coming days.
The stock has been moving along the horizontal support for the past few days which is indicating demand.
One can look for a 13% to 20% gain on deployed capital in this swing trade.
The view is to be discarded in the event of the stock breaking previous swing low.
#NSEindia #Trading #StockMarketindia #Tradingview #SwingTrade

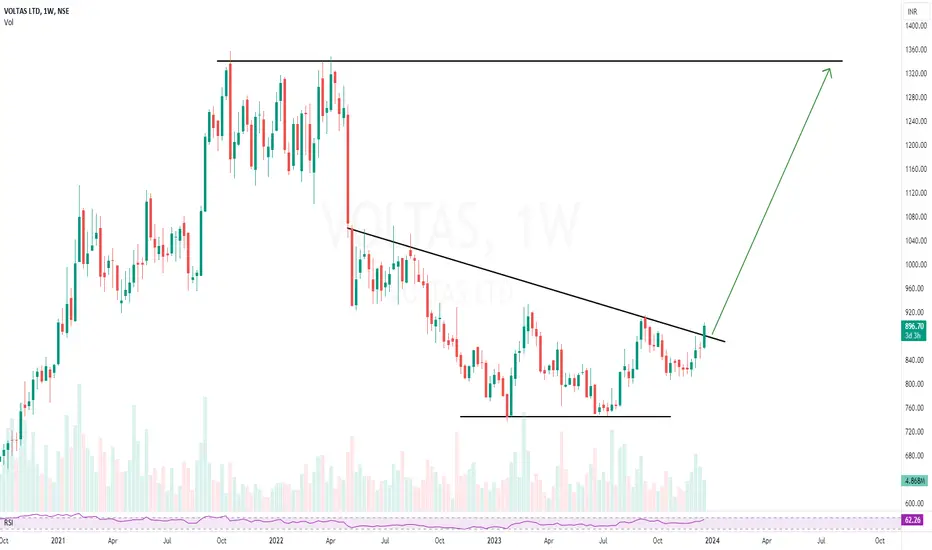
VOLTAS | Simple trendline and INHS setup - Looks good for 50%VOLTAS | Simple trendline and INHS setup - Looks good for 50%
CMP : 900
SL : 830
Target : 1350
1:4+ risk reward setup
FinNifty weekly expiry analysis for 09/04/24.Today the index has tried to clear the high and created a new ATH but couldn't sustain above the levels forming a doji on the dialy charts.
Now the market is in a volatile to bullish stage and there are possibilities of it creating new highs after gap up openings.
It remained in a 100-120 points range on the day before the weekly expiry and previous expiries has also remained silent.
If there is a gap up opening, there will not be much movement in the index and another silent expiry can be seen. Bullish trades can be created for swing trade after the formation of a price action on the charts.]
In case of a gap down opening, important levels can be retested and a bullish pattern formation near the levels can be trade with strict SL and targets.
Major support levels :- 21570, 21480
Flat opening and a break out in the second half can be traded as market can be seen trending after much of sideways movement.
Wait for the price action near the levels before entering the market.

SOLARA ACTIVE PHARMA - Bullish Momentum with VolumesNSE: SOLARA is closing with a bullish momentum candle supported with volumes.
Today's volumes and candlestick formation indicates strong demand and stock should move to previous swing highs in the coming days.
The stock has been moving along the horizontal support for the past few days which is indicating demand.
One can look for a 9% to 15% gain on deployed capital in this swing trade.
The view is to be discarded in the event of the stock breaking previous swing low.
#NSEindia #Trading #StockMarketindia #Tradingview #SwingTrade

Tata elxsi-You shouldn't miss this breakout!Tata elxsi is one of stock from Tata groups to deliver multibagger returns in last 4 years.
Stock has strong fundamentals and is available at a decent valuation.
All long term investors shouldn't miss this opportunity to accumulate this stock.
Breakout of consolidation is already done. A follow up bullish candle can be expected next week.

ATH for BANKNIFTY! As we can see BANKNIFTY is just couple points away from its ATH mark as we had been analysis since last posts. Now any strong opening will bring up new ATH for BANKNIFTY. Now the question arises whether BANKNIFTY can hold its level or not! If YES which has majority changes as the election is coming and the most obvious news is yet to be factored in, then we can see 50000++ in coming few weeks too so plan your trades accordingly

Strong chart with good RR in EASEMYTRIPEASEMYTRIP takes a good support at the rangebound rectangle box. Also now it is above 20 EMA and monthly Pivot. The last day bullish candle with wxcellent momentum indicates an upward movement.
CMP 46.40
Support 45
Target 54.40
Risk Reward 5+

NBCC - Bullish Momentum with VolumesNSE: NBCC is closing with a bullish momentum candle supported with volumes.
Today's volumes and candlestick formation indicates strong demand and stock should move to previous swing highs in the coming days.
The stock has been moving along the horizontal support for the past few days which is indicating demand.
One can look for a 18% to 28% gain on deployed capital in this swing trade.
The view is to be discarded in the event of the stock breaking previous swing low.
#NSEindia #Trading #StockMarketindia #Tradingview #SwingTrade

Banknifty around ATH, trading levels for intraday 05/04/24.Banknifty has given a hammer candle around the higher levels after a gap up opening above 48k levels.
The index came for profit booking after a good gap up and closed round 48k levels.
Now the market is around the last resistance zone of 48300 and then there is the ATH.
After a 3 day consolidation there was a gap up and it took the opportunity of making money in the up move.
In case of another gap up, bullish trades on the retest can be made around 48300 levels .
If there is a flat to slight gap down, bullish trades above 48250 can be created.
Major Resistance levels :- 48250, 48530-590
The market has created highs after gap up openings. In the scenario too, it seems market will show some gap up if it wants to create new ATH.
Support levels :- 47700, 47430
Wait for the price action near the levels before entering the market.

DEEPAK NITRITE - Bullish Momentum with VolumesNSE: DEEPAKNTR is closing with a bullish momentum candle supported with volumes.
Today's volumes and candlestick formation indicates strong demand and stock should move to previous swing highs in the coming days.
The stock has been moving along the horizontal support for the past few days which is indicating demand.
One can look for a 8% to 12% gain on deployed capital in this swing trade.
The view is to be discarded in the event of the stock breaking previous swing low.
#NSEindia #Trading #StockMarketindia #Tradingview #SwingTrade
