MACD Pullback Entry Framework📈 MACD Pullback Continuation & Momentum Reset Framework
This chart demonstrates how MACD can be used effectively within a strong trend by focusing on pullback entries, not late breakouts or tops.
Unlike using MACD as a standalone buy/sell signal, this framework combines:
Trend direction
Price structure
Momentum reset below the zero line
This approach is designed to trade with the trend, not predict reversals.
⸻⸻⸻⸻⸻⸻⸻⸻⸻⸻
📊 Key Observations
1️⃣ Higher-Timeframe Trend Filter (Directional Bias)
A valid bullish environment is defined by:
Price trading above the 200 EMA
Structure holding above key support zones
This confirms higher-timeframe bullish control.
Only long setups are considered in this phase.
2️⃣ Pullback Phase (Momentum Reset)
During an uptrend:
Price pulls back into a support zone
MACD moves below the zero line
⚠️ Important:
MACD moving below zero does NOT mean trend reversal in this context.
It represents a momentum reset within a bullish trend.
This phase often shakes out weak longs and prepares the market for continuation.
3️⃣ Entry Trigger (Bullish Momentum Shift)
The entry signal appears when:
Price reacts positively from support
MACD forms a bullish crossover
Crossover occurs below or near the zero line
This indicates:
Selling pressure has weakened
Bullish momentum is re-entering
Trend continuation probability increases
4️⃣ Why MACD Below Zero Works Better
In strong uptrends:
MACD crossovers above zero often occur late
MACD crossovers below zero align with pullback completion
This improves:
Risk-to-reward
Entry timing
Trade durability
MACD here acts as a timing tool, not a trend signal.
5️⃣ Trend Continuation Logic
The strongest continuation setups follow this sequence:
Price above 200 EMA
Pullback into support
MACD below zero (reset)
Bullish MACD crossover (trigger)
This allows traders to:
Avoid chasing highs
Enter during controlled pullbacks
Stay aligned with dominant trend pressure
6️⃣ What Invalidates the Setup?
The framework weakens when:
Price closes below the 200 EMA
Support structure breaks decisively
MACD remains weak despite price bounce
Only structure failure, not a single MACD signal, invalidates the bias.
⸻⸻⸻⸻⸻⸻⸻⸻⸻⸻
📊 Chart Explanation
Symbol → NSE:NESTLEIND
Timeframe → 2H
This chart highlights:
Bullish trend confirmed above 200 EMA
Controlled pullback into support
MACD dipping below zero (momentum reset)
Bullish MACD crossover triggering continuation
Expected Sequence:
Trend → Pullback → Momentum Reset → Trigger → Continuation
MACD excels at timing entries, not defining trend direction.
⸻⸻⸻⸻⸻⸻⸻⸻⸻⸻
📘 How to Use MACD Effectively
🔹 Trend-Following Use
Trade only in the direction of the higher-timeframe trend
Prefer MACD signals below zero in uptrends
Ignore MACD crossovers against the trend
🔹 Risk Management Tip
Use price structure or support zones for stop placement
MACD provides confirmation, not risk levels
🔹 Common Mistake
❌ Using MACD crossovers without trend context
✅ Using MACD as a pullback timing tool
⸻⸻⸻⸻⸻⸻⸻⸻⸻⸻
⚠️ Disclaimer
📘 For educational purposes only
🙅 Not SEBI registered
❌ Not financial or investment advice
Centered Oscillators

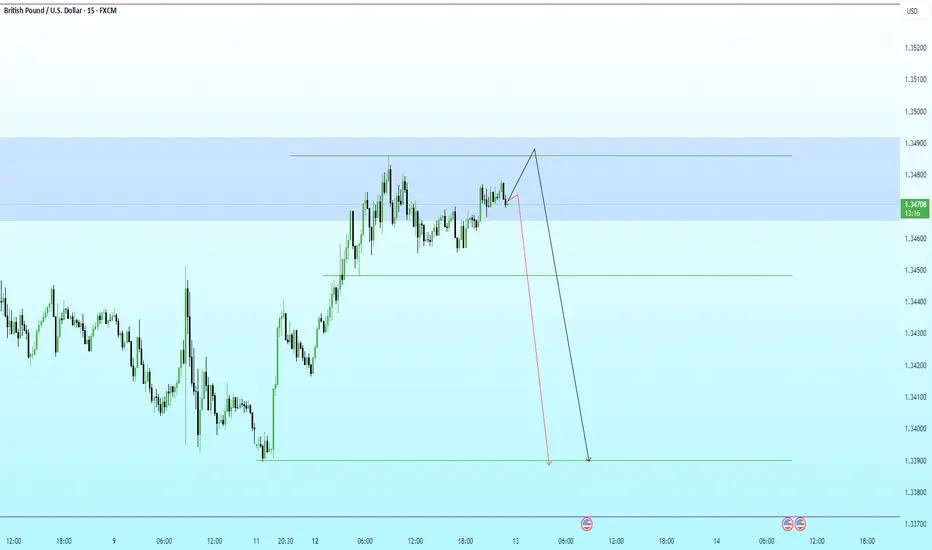
GBPUSD · 15M · SMC OutlookPrice is trading deep into premium, pressing against a well-defined HTF supply zone.
HTF Framework
Clear bullish leg already completed.
Buy-side liquidity resting above recent highs.
Premium zone aligns with prior distribution and weak highs.
LTF Structure
Momentum is slowing near the highs.
Price is consolidating under resistance, hinting at distribution.
Minor pullbacks are being absorbed, classic liquidity buildup behavior.
Expectation
A final push higher to sweep buy-side liquidity.
Reaction from supply after the sweep.
Strong bearish displacement targeting:
Internal range low
Prior demand imbalance
HTF discount zone below
Execution Plan
Avoid longs in premium.
Wait for:
Liquidity sweep above highs
Bearish displacement
LTF MSS for confirmation
Shorts favored post-confirmation.
Partial profits at range low, runners into discount.
USDCHF – M15 | Sell-Side Purge → Mitigation Rally → ContinuationPrice completed a textbook sell-side liquidity sweep, flushing weak longs below the range. The impulsive push down was real displacement. What followed is a forced bounce, driven by short covering and mitigation, not fresh demand.
Current price is retracing into a discounted supply / imbalance zone, where previous bearish orderflow originated. Structure remains bearish unless proven otherwise.
Market Narrative
Range highs → distribution
Sharp sell-side run = intent revealed
Bounce = mitigation into prior inefficiency
Execution Bias
Shorts favored into the marked retracement zone
Ideal entries on signs of rejection / bearish shift
Invalidation only on clean M15 acceptance above the green level
Targets
Recent sell-side lows
External liquidity below the range
Deeper discount expansion if momentum accelerates

XAGUSD – Clean Rejection From Discount Zone With Upside Silver reacted perfectly from a refined discount zone after a controlled pullback. The immediate rejection and push back above micro structure levels indicate bullish absorption and renewed momentum.
This reaction aligns with the broader HTF bullish narrative, suggesting price may continue expanding toward upside inefficiencies if structure holds.
Bullish Path:
• Tap into refined discount zone
• Strong rejection wick + recovery
• LTF structure shift confirming accumulation
• Expansion toward next HTF imbalance / liquidity pocket above

OBV + MACD Confirmed FVG📉 Bitcoin – Bearish FVG Retracement With EMA200, OBV & MACD Momentum Confluence
This chart highlights a clean bearish structure on BTC, defined by a consistent sequence of Lower Highs (LH) and Lower Lows (LL). Throughout this downtrend, multiple Fair Value Gaps (FVGs) have formed — each created by sharp institutional displacement that leaves behind inefficiencies in price.
As price continues trending below the EMA200, bearish order flow remains firmly intact. Each time BTC retraces into an unmitigated FVG, the market efficiently rebalances the imbalance before resuming downward continuation.
In this setup, the integration of FVGs + EMA200 + OBV + MACD Histogram builds a high-probability roadmap for identifying premium retracement zones and anticipating continuation moves.
The major FVG above current price sits directly under the EMA200 and aligns with weakening OBV momentum. This makes it the most structurally significant bearish reaction zone. A secondary FVG exists below it, but carries less importance due to weaker displacement and reduced confluence.
⸻⸻⸻⸻⸻⸻⸻⸻⸻⸻
📊 Key Observations
1️⃣ Prior Bearish FVG Reaction
A previously formed bearish FVG was cleanly mitigated, followed by immediate downside continuation.
This confirms that institutional order flow remains bearish and that FVG zones are functioning as efficient retracement magnets in the current trend.
2️⃣ High-Priority FVG Under EMA200 (Primary Zone)
This upper FVG has the strongest confluence:
Formed by strong bearish displacement
Sits directly below the EMA200, reinforcing trend direction
Aligns with market structure (LH → LL sequence)
OBV shows weakening buying pressure as price approaches the zone
MACD histogram is decreasing into FVG, signaling bearish momentum shift
This makes it the most likely level for a significant rejection if price retraces into it.
3️⃣ Secondary FVG Reaction Zone
A lower FVG also exists, but:
Formed during a smaller displacement
Does not align with EMA200 rejection
Carries weaker structural significance
It may still produce a minor reaction, but is lower probability compared to the primary FVG above.
4️⃣ OBV Momentum Context
OBV declines as price approaches the FVG, which is a critical confirmation.
When OBV decreases during a retracement, it signals absorption of buy-side pressure → strengthening the bearish continuation case.
5️⃣ MACD Histogram Confirmation
MACD histogram is rolling over and turning negative as price pushes toward the FVG.
This confirms bearish momentum returning, increasing the probability of a strong rejection from imbalance.
6️⃣ Structural Context
BTC maintains a clean LH–LL bearish sequence.
As long as price remains under the EMA200 and below the unmitigated FVGs, retracements are more likely to act as rebalancing moves rather than true reversal attempts.
⸻⸻⸻⸻⸻⸻⸻⸻⸻⸻
📊 Chart Explanation
Symbol → BITSTAMP:BTCUSD
Timeframe → 1D
This visualization demonstrates how Smart Money Concepts and momentum indicators align within a trending environment:
Clear LH → LL market structure
Multiple historical FVGs acting as premium retracement zones
A previously mitigated FVG confirming downside continuation
A high-confluence bearish FVG below the EMA200
OBV weakness during retracement phases
MACD histogram declining into FVG retest
Together, these elements create a textbook sequence:
displacement → inefficiency → retracement → mitigation → continuation
Price remains bearish unless BTC can break and close above the upper FVG with strong momentum and volume.
⸻⸻⸻⸻⸻⸻⸻⸻⸻⸻
📘 How EMA200, OBV & MACD Strengthen FVG Setups (Bullish + Bearish)
🔹 1. Trend Filter: EMA200
Below EMA200 → look for bearish FVG rejections
Above EMA200 → look for bullish FVG reactions
EMA200 acts as a dynamic mean-reversion anchor during trending markets.
🔹 2. OBV + FVG
OBV declining on FVG retest → bearish continuation
OBV rising into bullish FVG → bullish continuation
Volume trend strengthens or invalidates FVG reactions.
🔹 3. MACD Histogram + FVG
Falling histogram → bearish FVG confirmation
Rising histogram → bullish FVG confirmation
MACD shows whether momentum aligns with the imbalance.
🔹 Combined Logic (Works Both Ways)
Displacement creates an FVG
Price retraces into the FVG
Trend filter (EMA200) agrees
OBV + MACD confirm volume + momentum direction
Price rejects and continues trend.
⸻⸻⸻⸻⸻⸻⸻⸻⸻⸻
✅ Summary
Market structure remains bearish with LH → LL continuity
A previously filled FVG validated downside continuation
The upper FVG is the highest-probability zone (EMA200 + OBV + MACD alignment)
The secondary imbalance carries lower significance
OBV and MACD both confirm weakening buyer pressure into FVG
As long as BTC stays below EMA200, retracements into FVG are likely continuation setups
⸻⸻⸻⸻⸻⸻⸻⸻⸻⸻
⚠️ Disclaimer
📘 For educational purposes only
🙅 Not SEBI registered
❌ Not financial or investment advice
🧠 Smart-Money-Concepts explanation only

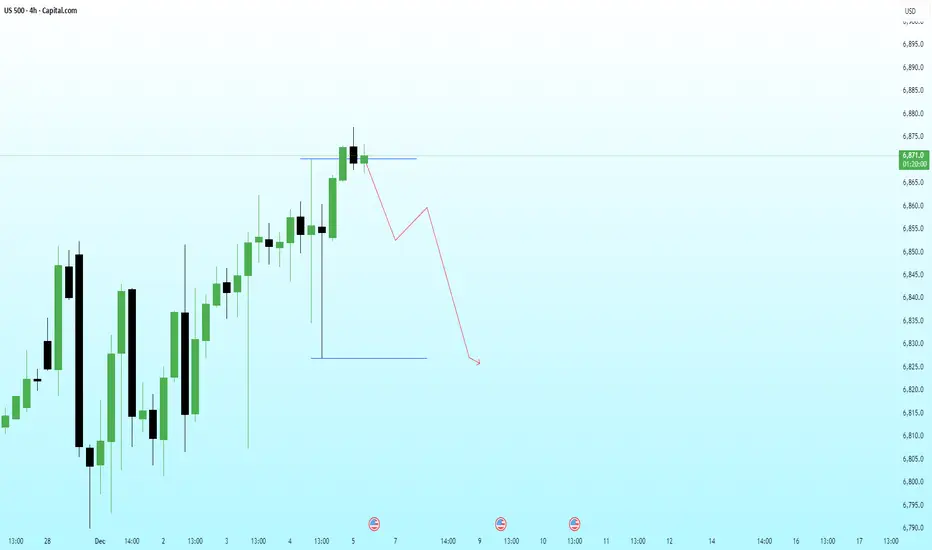
US500 – Liquidity Sweep at the Highs With Bearish Continuation PPrice has swept the immediate buy-side liquidity sitting above the recent high and is already showing signs of exhaustion. The reaction suggests a possible distribution phase forming near the top, aligning with the broader HTF narrative for a corrective leg.
If price fails to reclaim the swept high, the next logical target becomes the sell-side liquidity resting at the lower blue line.
Bearish Path:
• Sweep of the highs
• Failure to sustain above the level
• LTF shift into bearish structure
• Continuation toward downside liquidity + imbalance fill
⚠️ ENTRY CONDITION (IMPORTANT):
I will execute this trade only if the LTF replicates the structural behavior I expect from the HTF.
No LTF confirmation = No trade.
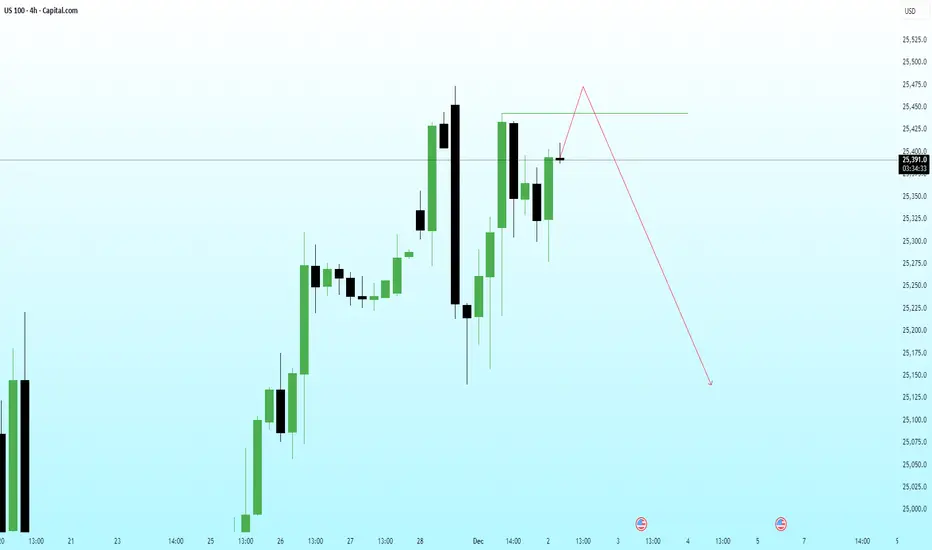
NAS100 – Anticipating a Liquidity Grab Before a Deeper CorrectioPrice is currently hovering just below the short-term resistance, displaying signs of exhaustion. I’m expecting one final push to sweep the liquidity sitting above the recent high (marked zone).
Once that engineered high is taken, a sharp reversal remains the highest-probability path—supported by higher-timeframe inefficiencies and unmitigated sell-side imbalance below.
Bearish Path:
• Sweep the recent high
• Fail to sustain above resistance
• Break structure
• Momentum-driven selloff toward the 25,150–25,180 zone
⚠️ ENTRY CONDITION (VERY IMPORTANT):
I will execute the trade only if the LTF shows the exact same sequence and confirmation that I’m expecting from the HTF. This is non-negotiable.
This scenario remains valid as long as price doesn’t gain acceptance above the marked resistance level.
IndiaMArt - Reversal based on RSI CDIndiaMART (NSE) - Technical Analysis & Trade Setup
Current Price: 2,376.70
Trade Setup Overview
This trade setup is based on RSI Classic Divergence combined with Price Action analysis. The stock has shown a bullish divergence pattern on the RSI indicator while forming a potential bottom around the 2,243-2,377 zone.
Entry Strategy
Entry Type: Aggressive Entry (Current levels)
Confirmation Entry: Only initiate trades after candle closing above **2,437** on a 1:2 risk-reward ratio basis.
Target Levels
- Target 1: 2,459.70 (Fibonacci 0.382 level)
- Target 2: 2,593.00 (Fibonacci 0.618 level)
- Target 3: 2,676.65 (Fibonacci 1.0 extension)
**Potential Upside:** 8.5% to 12.6% from current levels
Risk Management
Stop Loss: 2,252.50 (on candle closing basis)
Risk from Current Price: ~5.2%
Technical Indicators
RSI Analysis
- RSI showing classic bullish divergence
- Price made lower lows while RSI made higher lows
- Current RSI around 62.25, indicating bullish momentum
- RSI breaking above previous resistance zones
Fibonacci Retracement Levels
- 0 (2,243.15) - Recent Low
- 0.382 (2,377.00) - Current Support Zone
- 0.618 (2,518.60) - Key Resistance
- 1.0 (2,676.25) - Extension Target
Key Observations
1. Stock has recovered from the October low of 2,243 levels
2. RSI divergence suggests potential trend reversal
3. Price action forming higher lows, indicating accumulation
4. Multiple Fibonacci resistance levels ahead that may act as profit-booking zones
Important Notes
- This is an **aggressive entry** setup for risk-tolerant traders
- Conservative traders should wait for confirmation above 2,437
- **Strictly maintain stop loss** on closing basis below 2,252.50
- Book partial profits at each target level
- Trail stop loss as price moves in your favor
- Monitor RSI for any bearish divergence at higher levels
Disclaimer
This analysis is for educational purposes only. Please do your own research or consult with a financial advisor before making any investment decisions. Past performance does not guarantee future results.
**Follow for more technical analysis and trade setups!**
#IndiaMART #TechnicalAnalysis #StockMarket #Trading #RSIDivergence #FibonacciTrading #NSE

BANK OF INDIA | 1D | Premium Zone ReactionPrice has aggressively tapped into a higher timeframe premium zone after an extended bullish leg. Liquidity above June swing high has been swept clean, followed by a sharp rejection — indicating potential distribution and a short-term correction setup.
🔹 Key Notes:
– Liquidity grab above previous high ✅
– Premium zone mitigation ✅
– Early signs of market structure shift ✅
– Targeting discount reprice near 116–118 zone
Looking for price to retrace into the discount range before any fresh accumulation phase begins.

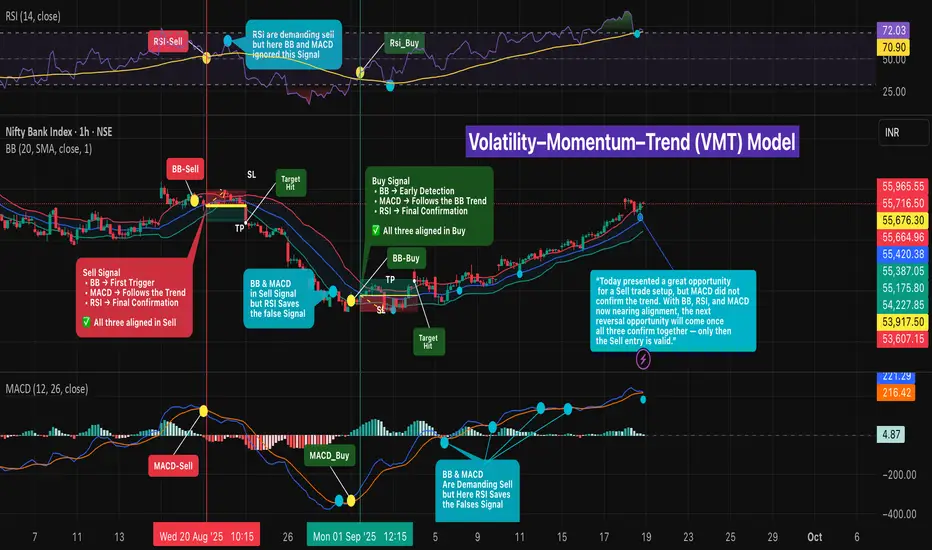
Volatility–Momentum–Trend (VMT) Model🔎 Intro / Overview
Three-indicator confirmation using Bollinger Bands (BB) , MACD , and RSI to align trend and price action.
BB often detects the move first (least lag), MACD follows the BB trend (mid reaction), and RSI confirms last (most lag).
This staged confirmation helps reduce false signals and keeps entries disciplined.
___________________________________________________________
📔 Concept
• Bollinger Bands (BB) → Early detector at volatility extremes.
– Buy : Price first moves outside the lower band , then a candle closes back above lower band → early bullish alert.
– Sell : Price first moves outside the upper band , then a candle closes back below upper band → early bearish alert.
• MACD → Momentum confirmer.
– Buy : MACD crossover above its signal line supports the bullish shift.
– Sell : MACD crossunder below its signal line supports the bearish shift.
• RSI → Final confirmation (filters traps).
– Buy : RSI crosses above its moving average, confirming bullish momentum.
– Sell : RSI crosses below its moving average, confirming bearish momentum.
✅ Only when BB + MACD + RSI all align in the same direction is the signal confirmed.
Notes:
- BB often reacts first (fastest, but prone to false starts).
- MACD provides mid-reaction confirmation.
- RSI lags but acts as the strongest filter against false trades.
Notes: Sometimes BB reacts immediately; MACD/RSI can prevent traps. At times BB+MACD demand a trade but RSI rejects (good filter); other times RSI demands but BB+MACD filter it.
___________________________________________________________
📌 How to Use
🔴 Sell Signal
1) BB: Price first extends outside upper band in an up-move, then a candle closes back under the upper band → BB sell signal.
2) MACD: Crossunder of MACD line below signal line.
3) RSI: RSI crosses below its moving average → final confirmation.
✅ All three aligned = Valid Sell.
🟢 Buy Signal
1) BB: Price first extends outside lower band in a down-move, then a candle closes back above the lower band → BB buy signal.
2) MACD: Crossover of MACD line above signal line.
3) RSI: RSI crosses above its moving average → final confirmation.
✅ All three aligned = Valid Buy.
___________________________________________________________
🎯 Trading Plan
• Entry → Only when all three confirm in the same direction.
• Stop Loss → - Stop-Loss → Near the structure swing that formed when BB first detected the signal (e.g., recent swing high for shorts / swing low for longs).
• Target → At least 1R ; scale/exit remainder using ATR, Fibonacci levels, or box trailing to ride trend.
___________________________________________________________
📊 Chart Explanation
Symbol/TF: BANKNIFTY · 1H
1) 20 Aug · 10:15 — SELL
• BB detected first, MACD mid-reaction (after ~2 candles), RSI confirmed last → Entry @ 55,676.30
• Target @ 55,387.05
• Stop-loss @ 55,965.55
• 🎯 Target hit on 22 Aug · 09:15 .
• Remaining lots can be trailed using ATR , Fibonacci levels , or Box Trailing to ride the extended trend
2) 29 Aug · 10:15 — FILTERED SELL
• BB and MACD demanded sell, but RSI did not confirm → No trade; RSI saved a false signal.
• 🦋 “The aqua dots represent false signals. At times, BB detects early entries but RSI and MACD do not confirm. Sometimes BB and MACD align, but RSI rejects the move. Other times BB and RSI confirm, yet MACD signals false. ✅ Only when all three align together is the signal valid.”
3) 01 Sep · 13:12 — BUY
• All three aligned long
• Entry @ 53,917.05
• Target @ 54,121.50
• Stop-loss @ 53,712.60
• 🎯 Target hit.
• Remaining lots can be trailed using ATR , Fibonacci levels , or Box Trailing to ride the extended trend
👉🏼 “A Sell setup looked promising today, but MACD did not confirm the trend ❌. With BB, RSI, and MACD now nearing alignment, the next reversal opportunity will be valid only when all three confirm together ✅.”
___________________________________________________________
👀 Observation
• BB provides the earliest cue; MACD validates momentum shift; RSI filters late-stage traps.
• Most reliable signals occur near key structure (support/resistance) with confluence.
• Not all alignments are equal—strength improves with decisive closes and supportive volume.
___________________________________________________________
❗ Why It Matters?
•A rule-based, three-step confirmation reduces noise and emotions.
•It clarifies when to enter , when to skip , and how to manage risk consistently across changing market conditions.
___________________________________________________________
🎯 Conclusion
BB → detect , MACD → follow , RSI → confirm .
When all three align, entries are clearer and risk is defined.
🔥 Patterns don’t predict. Rules protect. 🚀
___________________________________________________________
⚠️ Disclaimer
📘 For educational purposes only.
🙅 Not SEBI registered.
❌ Not a buy/sell recommendation.
🧠 Purely a learning resource.
📊 Not Financial Advice.
Nifty 50 Breakout and RSI Momentum Analysis – Sept 2025This TradingView chart presents a technical analysis of Nifty 50, highlighting a recent breakout from a descending trendline with harmonic ABCD pattern and advanced RSI insights. Key support and resistance levels are marked, and RSI momentum shows a clear structural shift as of September 17, 2025. The setup visualizes Fibonacci zones, price action targets, and a multi-timeframe confluence to help traders anticipate future market moves and confirm trend reversals.

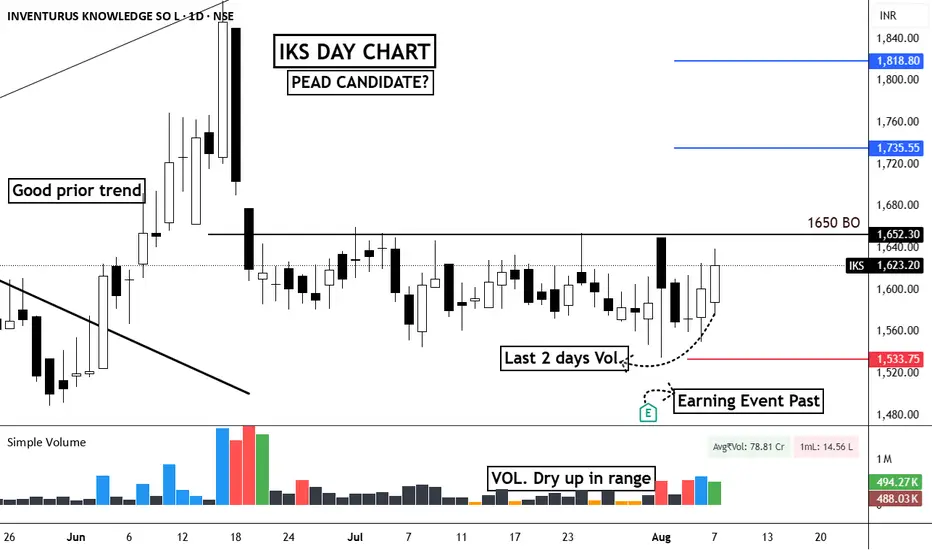
PEAD in Inventurus Knowledge (IKS)EQUITY SWING SETUP 📊
#IKS | Daily Chart Analysis
🔹Structure:-
Price is forming a rounded bottom inside a range, showing Volume Dry-Up during the consolidation phase.
Earnings event is past, reducing uncertainty, and the last two days show pickup in volume, hinting at accumulation.
Key breakout level is ₹1650, above which momentum can accelerate — possible PEAD (Post-Earnings Announcement Drift) candidate.
🟢ENTRY:
Buy above ₹1655 with strong volume confirmation.
♦️RISK:-
Stop Loss: ₹1533 (below recent swing low & support zone)
🎯TARGETS:-
1st Target: ₹1735
2nd Target: ₹1818
📌Detailed Analysis:
Volume dried up significantly during the range, a classic sign of weak hands exiting.
The base is tight, indicating strong hands holding.
Breakout above ₹1650 could trigger a quick momentum burst, especially given the post-earnings context.
Watch for strong volume on breakout day to confirm institutional participation.
📈Mark the levels on your chart and track price behavior near the breakout zone.
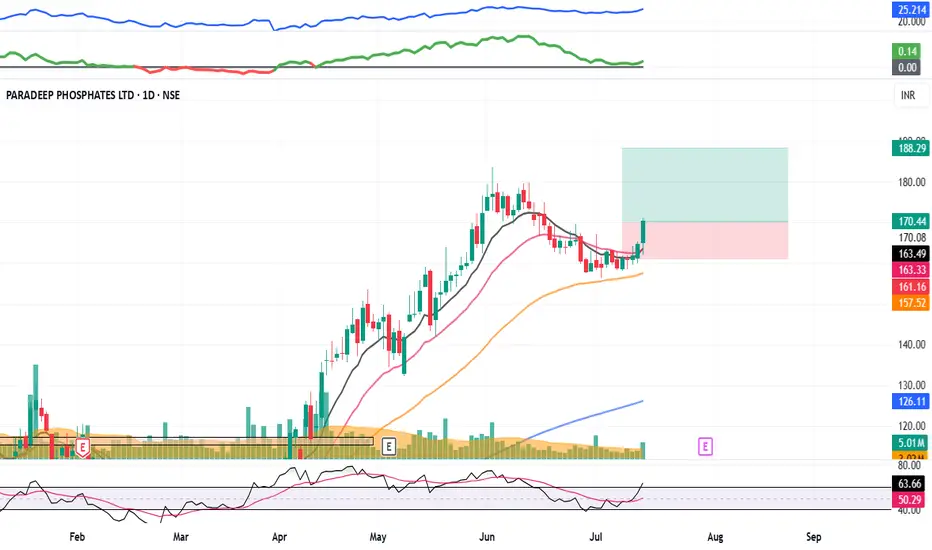
PARADEEP : Momentum Pick#PARADEEP #swingtrade #trendingstock #momentumtrade
PARADEEP : Swing Trade
>> Low PE Stock
>> Good Retracement and consoldation
>> Stock Ready for next leg of Rally
>> Good Strength & Volume
>> Risk Reward Favourable
Swing Traders can lock profit at 10% and keep Trailing
Please Boost, comment and follow us for more Learnings
Disc : Charts shared are for learning purpose only, not a Trade recommendation. Do your own research and consult your financial advisor before taking any position.
NIfty 23200 important Support swing tradeHello,
Nifty Retrace more than 50% of previous swing high and now at trendline support RSI oversold with slow selling volume is not active on sellers side also hidden divergence and oscilators are bullish bullish reversal possibilities with stop loss of 23180

NIFTY MIDCAP Making in W pattern HourlyHello,
Indian indices fall 2 to 4% after trump oth Nifty midcap 100 spot 52700 making in W pattern if support taken then bounce upto 55000 possible RSI is oversold with positive divergence ocsillators are bullish below 52000 more panic possibilty for 51000, 50000, 48500.

DIVISLAB - CHANNEL CONSOLIDATION -WILL IT BREAKOUT OR NOTDivi's Laboratories Ltd. is an interesting chart with following
1. RSI on all time frames (i.e. D/W/M) above 60
2. Narrowing Bollinger Bands on daily chart with price walking on upper band
3. Two month's long consolidation of price in rectangular range of 5675 to 6300 levels and once price breaks out of this range, momentum will increase
4. ABCD pattern under formation on weekly chart
5. Major price supports at 5930 i.e. 20 Day SMA and 5750 i.e. 50 EMA respectively
Breakout of 6300 + levels on closing basis can fetch 6700 + and 6980 levels as per Fibonacci projection tool
Lets see How it evolves
Disclaimer: NOT A BUY / SELL RECOMMENDATION I am not an expert I just share interesting charts here for educational purpose and not to be taken as buy/sell recommendation. Please seek expert opinion before investing and trading as trading/ investing in market is subject to market risks. I do not hold any position in the stock as on date but I may look to take some position with my own Risk Reward matrix.

Mphasis still look good in heavy bearish market (Long term)“Hello everyone, Mphasis stock look good Despite the heavy market fall, it is performing well.
After a cup n handle break has occurred.
The volume is also great in this stock, and the relative strength is above 60.
It seems like the stock can maintain long-term momentum.”
Above all, given information is only for educational purpose, Before trade do your own analysis.


GLS - Fractals and a re-ratingA repeating pattern in price/volumes. Bollinger bands tighten, positive MACD cross (awaited) and take off...All on a weekly scale so this one should have wings once it gets going again.
NOT ADVICE!! DYOR....

SAREGAMA - Stock with 50% upside potential - Here's Why!1. Price is showing strength
2. Stock have broken 2022 (2.5 yrs) level.
3. Previous week high is broken.
4. RSI & EMAs are indicating bullish momentum.
5. Price are bouncing from weekly demand

19% gains , are you up.for it... Olectra is following and making a perfect textbook triangle breakout, carry up.enjoy the trend and posible 19% upside in a matter of month or less ...

One sweet gap for an upside of 13% Heading towards a breakout of resistance good volume and Market conditions, we can expect a 13% upside after 2692-2700 and a new sky for the stock... Happy trees

BALMLAWRIE BREAKOUT (6 year range breakout)Balmer Lawrie & Company Ltd is extremely bullish with rising volume as visible form the chart .
The financials of the company are pretty solid as well :
1. Rising PE
2. Increasing sales
3. increasing net profit
4. rising EPS
Along with all this the company also gives pretty solid dividend as well.
It is the stock to watch out for🚀🚀.
