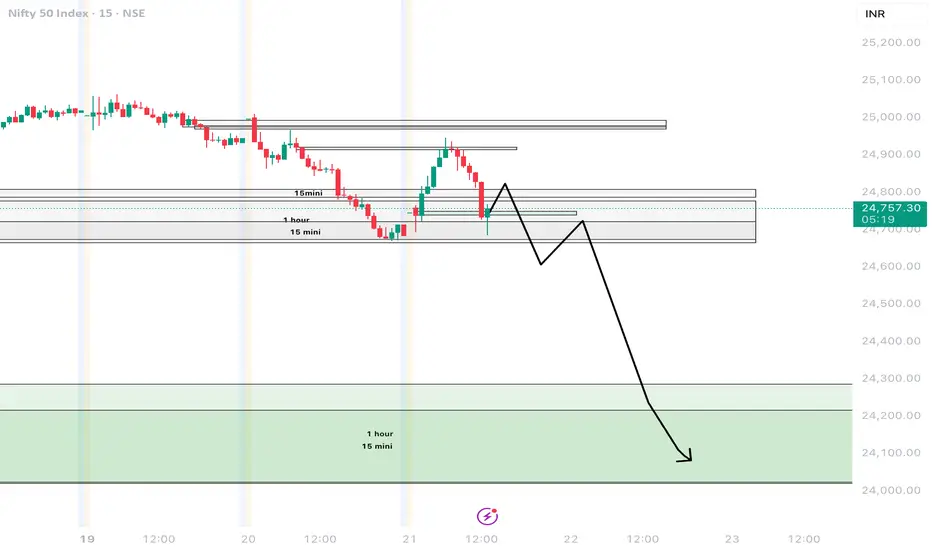
Nifty 50 | Technical Analysis for week 19-23 May 2025Hi,
I am sharing my view on nifty 50 trend direction. It can fill the gap pending at 24200.
If you like my view then please like and share this post.
Disclaimer: This is only for education purpose.
Chartanalysis
Major trend view for USOILAre we looking at a similar but mirrored bar pattern from 2008 to 2014?
Similarities:-
1. Impulse and steep wave.
2. Consolidation in the format of a triangle.
On the breakout, we had another fall equivalent to 61.8% of the impulse wave. If we are witnessing the same pattern, then on the breakout of this triangle consolidation, we will have the USOIL prices at $135 in the coming years. It shall be by the end of 2028!
PS: This chart is just for analysis purposes. When we know the major trend, we can position our trades carefully.

LIC Share Price Analysis – Key Support & Resistance Levels🕒 Timeframe: Daily | Symbol: NSE:LICI
LIC stock is currently showing a consolidation pattern after a decent rally from previous lows. Price action suggests that the stock is preparing for a directional move. Traders should keep an eye on the following critical levels:
🔹 Support Zone: ₹807 – ₹830
This range has held strong multiple times, indicating buying interest around this zone. A breakdown below ₹723 could lead to a deeper correction.
🔹 Resistance Zone: ₹866 & ₹1000
LIC has struggled to sustain above ₹826. A breakout with volume above ₹866 may lead to bullish momentum toward ₹1000+.
📌 Trading Viewpoint:
✅ Bullish Bias if price sustains above ₹866 & ₹1000 with volume
⚠️ Bearish Below ₹723 (watch for a breakdown retest)
🛑 Disclaimer: This is for educational purposes only. Not financial advice. Do your own research before investing.
#LIC #LICShareAnalysis #LICI #TradingView #StockMarketIndia #SupportAndResistance #NSE #LICBreakout #LICStock #TechnicalAnalysis #SwingTrading

BSE Ltd - Breakout Setup, Move is ON...#BSE trading above Resistance of 4169
Next Resistance is at 6645
Support is at 2586
Here is previous chart:
Chart is self explanatory. Levels of breakout, possible up-moves (where stock may find resistances) and support (close below which, setup will be invalidated) are clearly defined.
Disclaimer: This is for demonstration and educational purpose only. This is not buying or selling recommendations. I am not SEBI registered. Please consult your financial advisor before taking any trade.

Mazagon Dock Shipbuilders - Breakout Setup, Move is ON...#MAZDOCK trading above Resistance of 4315
Next Resistance is at 6033
Support is at 2955
Here are previous charts:
Chart is self explanatory. Levels of breakout, possible up-moves (where stock may find resistances) and support (close below which, setup will be invalidated) are clearly defined.
Disclaimer: This is for demonstration and educational purpose only. This is not buying or selling recommendations. I am not SEBI registered. Please consult your financial advisor before taking any trade.

Maruti: Bullish triangle breakoutA clean triangle breakout for MARUTI. The upside target is 13620, and the stop is below the upper triangle line.
The entry validates once it gives a breakout and tests the upper line in the lower timeframe, not less than 4 hours.
RSI also has space for this price to meet the projected level.

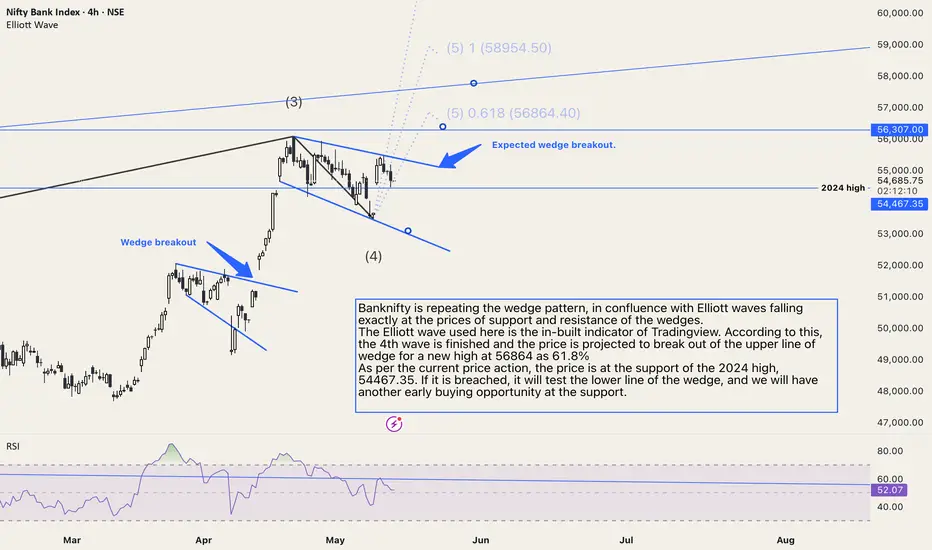
Banknifty combining Elliott and wedge theoryBanknifty is repeating the wedge pattern, in confluence with Elliott waves falling exactly at the prices of support and resistance of the wedges.
The Elliott wave used here is the in-built indicator of Tradingview. According to this, the 4th wave is finished and the price is projected to break out of the upper line of the wedge for a new high at 56864 as 61.8%
As per the current price action, the price is at the support of the 2024 high, 54467.35. If it is breached, it will test the lower line of the wedge, and we will have another early buying opportunity at the support.
The RSI is still above 50; therefore, the 2024 high level is proving to be good support. No selling is suggested unless the price is trading above this support level of 54467.35.
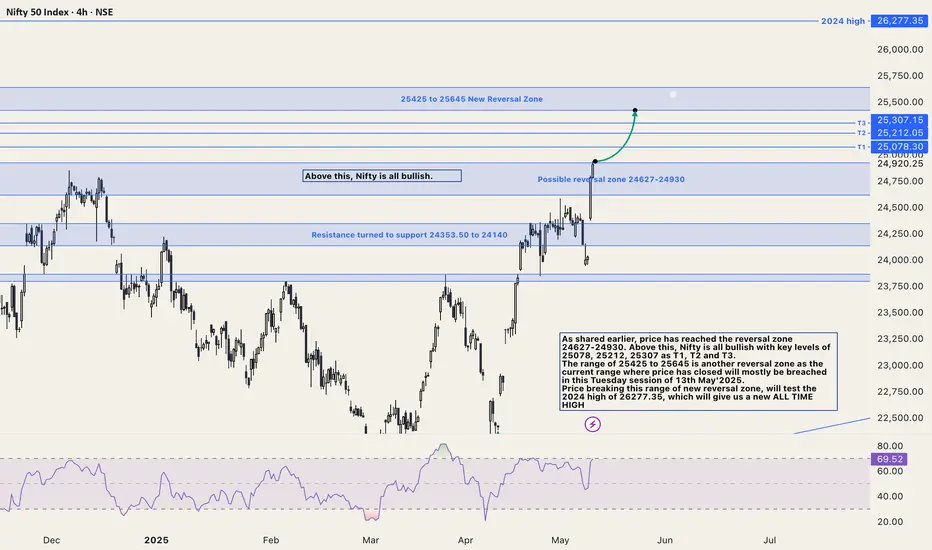
Nifty updated chart for Bullish view.As shared earlier, price has reached the reversal zone 24627-24930. Above this, Nifty is bullish, with key levels of 25078, 25212, and 25307 as T1, T2, and T3.
The range of 25425 to 25645 is another reversal zone as the current range where price has closed will mostly be breached in this Tuesday session of 13th May'2025.
Price breaking this range of new reversal zone, will test the 2024 high of 26277.35, which will give us a new ALL TIME HIGH
Kotak Bank Double TopWith new higher high Kotak bank has finished double top but closed below 2021 high. It means the price still have the chance to make new higher high. On the contrary price below 2163 will activate the sell opportunity for Kotak bank with targets of 2085.60, 2016 and as low as 1942. Next week or today's close above 2202 it will still have bullish points left for another test of new high. RSI still have some space for a new highs. For either sell or buy it is advised to wait for proper breakout of 2163 for a SELL or above 2202 for a buy with 2253 as first target.

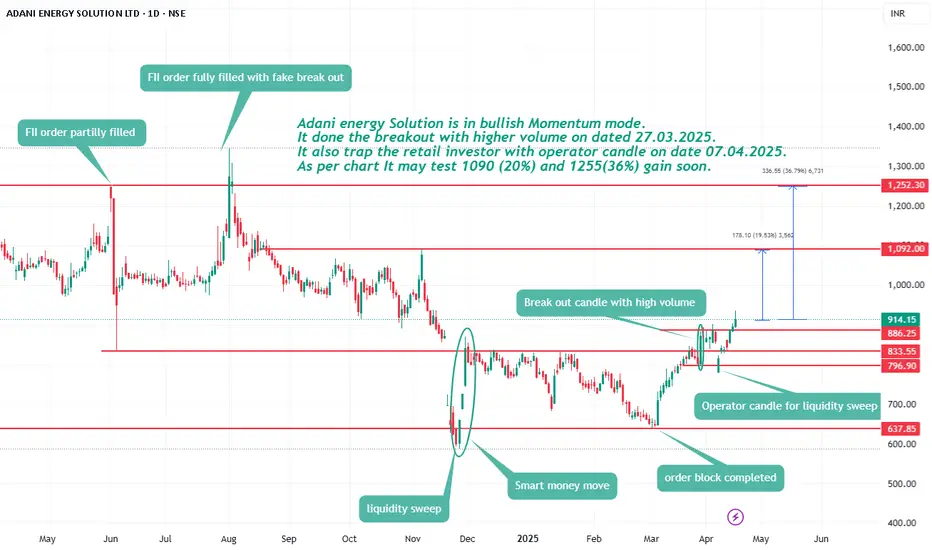
Adani energy Solution is on bullish breakout.Adani energy Solution is in bullish Momentum mode.
It gave marubozo candle with higher volume on dated 27.03.2025.
It also traps the retail investors with operator candle on date 07.04.2025.
Stock is in Demand zone as per chart It may test 1090 (20%) and 1255(36%) gain soon.
BTC 97800, Red Balloon Area, Buy Above this onlySince 24 hours after breakout of 95700 zone BTC is struggling to get more attraction and halted near 97800 for a time being where weekly chart is showing higher high candles but in daily chart last 24 hours red candle is obstructing the further uprally for time being, some shorts has been built near 97800, and fresh longs only once these liquidity is squeezed else will watch this BTC Ping Pong show, downside 95000 is crucial support bed, any breach of either zone will decide the fate for next week.
Happy Trading and Investing
~10x Bulls
Courtesy: 10x Bulls (An educational platform for investors and traders to find the best investment decisions, faculty trained by ex-fund managers, such as JP Morgan Chase and Goldman Sachs)
Classic Forecast:
COINBASE:BTCUSD
$15000 to $100000 in 2021 completed in 2024.

XAUUSD: Descending triangleThat's what happens in the chart patterns in process and why not to trade them. Earlier, was head and shoulders pattern was in the making, but then the right shoulder started ranging, and it converted into a descending triangle pattern. This is also a bearish pattern when the base of the triangle is breached (with a valid close and volume breakout).
When breaking down, the targets will be equal to the length of the dip (marked as a down arrow).
If it breaks the triangle in the opposite direction, then it will test the high again and will invalidate the entire pattern.

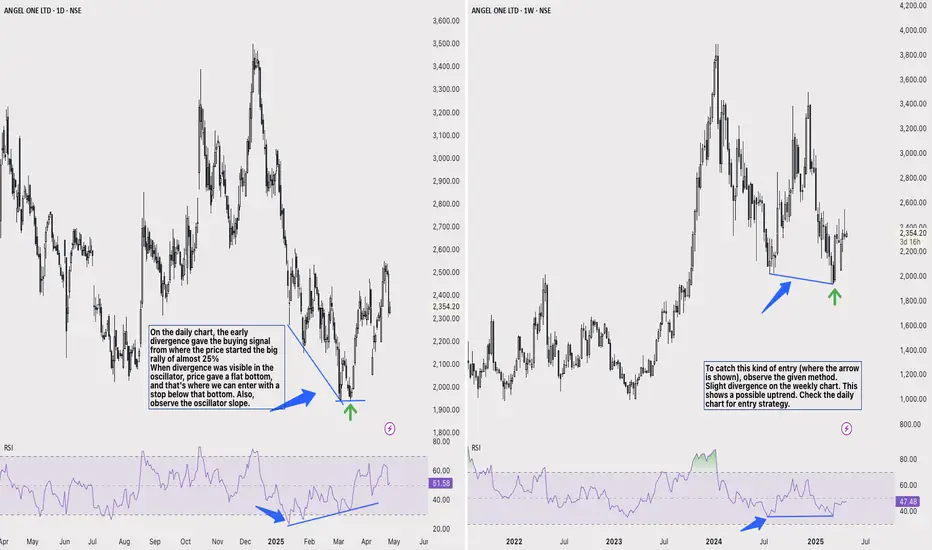
Analysis to catch a divergence rallyObserve the given method to catch this kind of entry (where the arrow is shown).
Slight divergence on the weekly chart. This shows a possible uptrend. Check the daily chart for entry strategy.
On the daily chart, the early divergence gave the buying signal from where the price started the big rally of almost 25%
When divergence was visible in the oscillator, price gave a flat bottom, and that's where we can enter with a stop below that bottom. Also, observe the oscillator slope,it is making higher high and price making lower low and before the rally it gave flat price action.
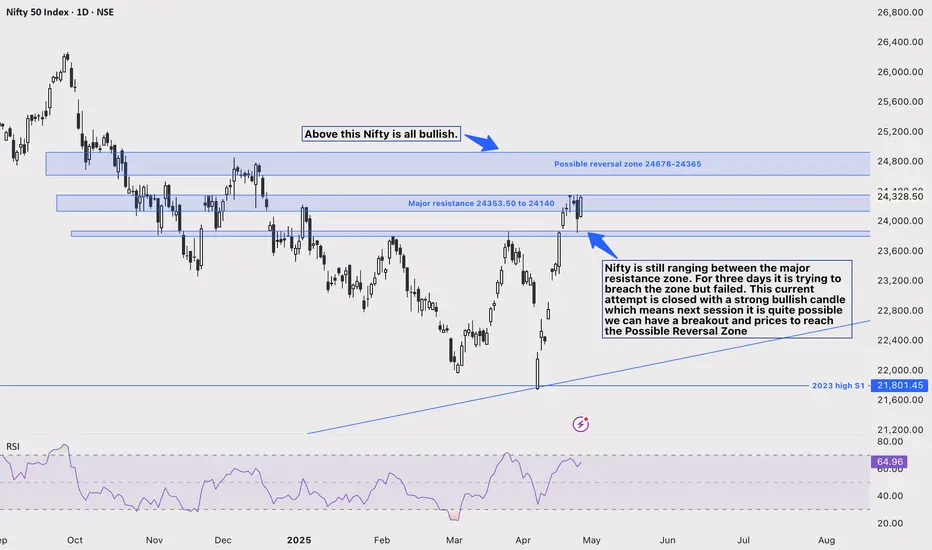
Nifty this week analysisNifty still ranges between the major resistance zones. It has been trying to breach the zone for three days but has failed. This current attempt is closed with a strong bullish candle, which means next session it is quite possible we can have a breakout and prices to reach the Possible Reversal Zone.
On breakout of this zone between 24140 to 24353-55, the possible reversal zone is 24678 to 24365. If the price rejects this resistance, then we will witness a new rally in Nifty prices.
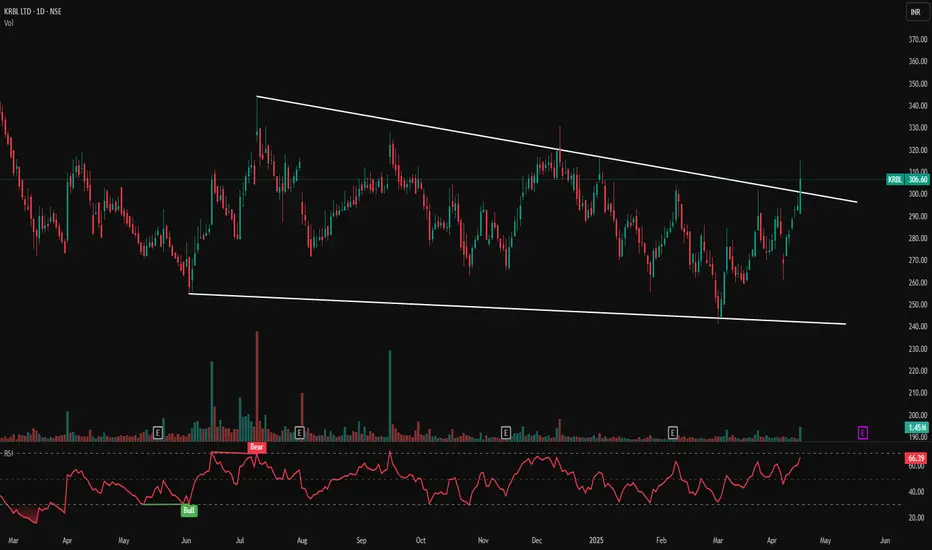
KRBL LTS- Falling Wedge Breakout | Trend Reversal Signal Ahead?KRBL LTD – Falling Wedge Breakout 💥 | Trend Reversal Signal Ahead?
📅 Published on: April 17, 2025
📈 Technical Analysis:
KRBL has shown a bullish breakout from a long-term falling wedge pattern on the daily chart — a classic reversal pattern signalling a potential upward move after prolonged consolidation. The breakout candle is supported by strong volume and a bullish RSI setup.
Pattern: Falling Wedge (Bullish)
Breakout Price: ₹306.60
Previous Resistance Line: Now acting as support
Breakout Volume: 1.45M (above average)
🧭 Key Support & Resistance Levels:
Immediate Support: ₹290
Major Support: ₹275
Immediate Resistance: ₹315
Next Resistance Zone: ₹330 – ₹345
Trendline Resistance (Broken): ₹300 (now support)
🔍 Indicators:
RSI (Relative Strength Index):
Current RSI: 66.39 — bullish, nearing overbought zone, shows strong momentum.
RSI Bullish Crossover observed in April, indicating accumulation before breakout.
🧠 Price Action Observations:
Price respected the wedge formation since March 2024.
A strong bullish candle broke above the upper wedge with conviction.
RSI confirms strength, aligning with price action breakout.
Volume surge supports the breakout's validity.
📌 Strategy (For Educational Purposes):
Entry: ₹305–310 (on retest)
Stop Loss: ₹285 (below wedge support)
Targets:
₹330
₹345
₹360+
📊 Visual Markings & Icons:
White Trendlines: Highlighting falling wedge support and resistance.
Bullish RSI Tags: Marking key bullish RSI crossovers.
Volume Spikes: Notable on breakout day.
Breakout Candle: Large green candle breaching the upper wedge line.
⚠️ Disclaimer:
This analysis is for educational and informational purposes only. Please consult your financial advisor before making any trading decisions.
Waaree Energies Technical Analysis with Confirm Targets Detailed chart analysis of Waaree Energies Ltd. based on the Daily Time Frame (1D)
Chart as of April 23, 2025
Current Price Movement
- LTP (Last Traded Price): ₹2,983.00
- Change: +₹367.10 (+14.03%) — A strong bullish candle with a significant gap-up.
- Volume: 19.82M — Strong volume confirmation indicating institutional interest.
Resistance / Supply Zones
1. Resistance - 1 (Supply Zone)
₹3,186.00 – ₹3,237.15
This is the nearest resistance zone where the stock may face selling pressure. Previous supply has emerged here, and buyers may take profit.
2. Major Resistance / Supply Zone
₹3,646.40 – ₹3,741.45
This zone marks the previous major highs and is a key resistance area. A breakout above this may indicate a strong continuation of the uptrend.
Support / Demand Zones
1. Major Support - 1 (Demand Zone)
₹2,455.20 – ₹2,512.70
This is the most recent breakout zone. If the price corrects, this area may act as a strong support level.
2. Support Zone - 2
- ₹2,294.40 – ₹2,323.30
- Acts as the next layer of support if ₹2,455 fails to hold.
3. Major Support - 2
- ₹2,009.40 – ₹2,075.15
- Long-term support zone, previously tested multiple times, can act as a strong demand zone in case of major correction.
Price Structure & Volume
- The chart shows a **strong bullish breakout** after forming a **higher low**.
- Today's price action indicates a **gap-up opening with heavy buying interest**.
- Volume confirms the breakout — higher than average volume during the up move suggests strong conviction.
Key Technical Takeaways
- Trend Reversal Confirmation: After a prolonged downtrend, price has shown a strong bullish reversal.
- Bullish Breakout: Price broke through multiple resistances with volume confirmation.
- Watch for Retest: In case of pullback, ₹2,455–₹2,512 zone should be watched for buying interest.
Targets
- First Target: ₹3,186–₹3,237
- Final Resistance Target: ₹3,646–₹3,741
- If the price fails to sustain above ₹2,983 and closes below ₹2,512 in coming sessions, it might signal a false breakout or correction.

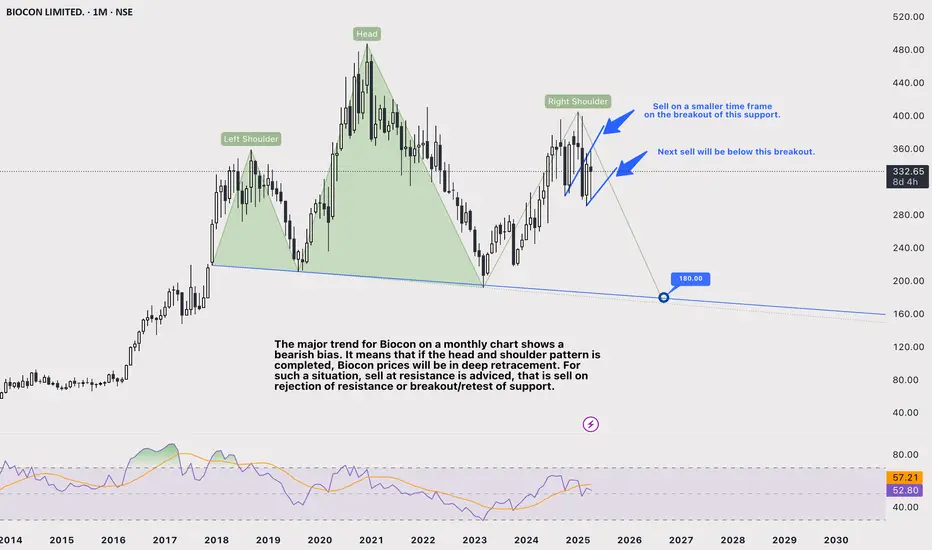
Biocon monthly analysis: Bearish on breakoutThe major trend for Biocon on a monthly chart shows a bearish bias. It means that if the head and shoulder pattern is completed, Biocon prices will be in deep retracement. For such a situation, sell at resistance is advised, that is, sell on rejection of resistance or breakout/retest of support.
Step down on lower time-frame for immediate trendline supports for entry strategies.
RCF is in bullish mode.RCF is forming evening star candle stick pattern on monthly chart.
As per chart it may test 240 soon as it is previous high level.
Returns around 78%.
As per report upcoming monsoon session will be better than expectation.
It is in Demand zone can long it for next 2-4 months.

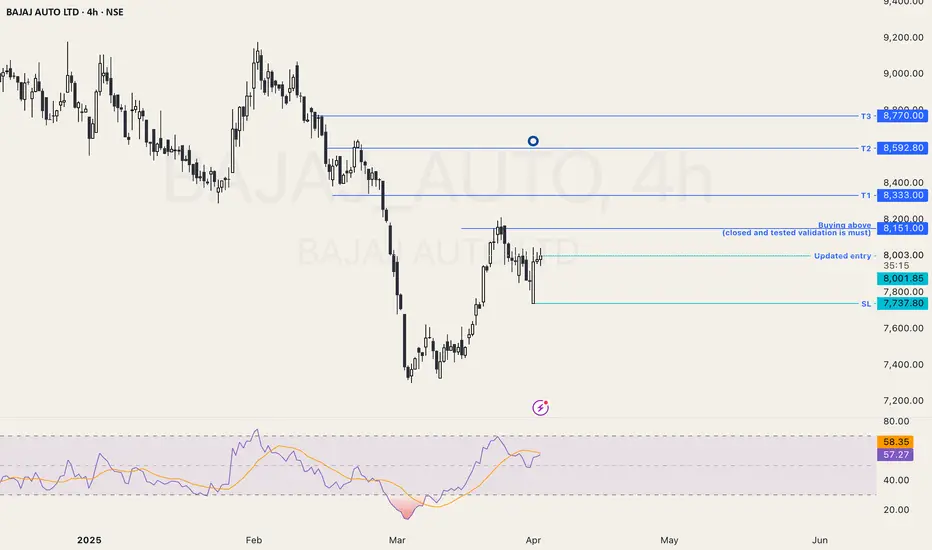
Bajaj Auto: Bought at CMPCMP: 8003
Bajaj_auto is approaching for buying zone again.
Taking early entry at this point with SL at nearest low i.e. below 7735
The targets are the same, with a small update. The first target will be the earlier entry point, 8151, and so on.
DXY finds the support at $99.DXY will be finding the support at the current levels at around $99.
From here prices can go up till $100-$101
If the price breaks down this support of 99 it will continue the fall till $97.5sh to $97zone.

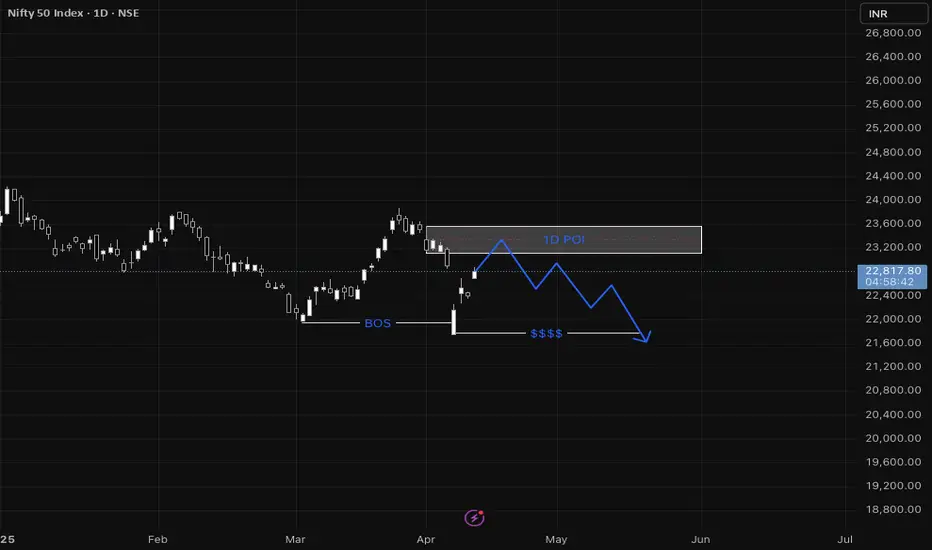
NIFTYNifty has broken structure on the daily timeframe. I’m now waiting for it to collect liquidity and retest the daily point of interest. Looking for confirmation on the one-hour timeframe is a strategic approach to refine the entry.
Gold Next Target 2800 and What Next Trump's tariffs?🔍 Chart Context (1H and 15M Combined View)
Trend: Bearish overall structure on the 1H timeframe, with lower highs and lower lows.
Trendline: Clearly respected and just recently tested again (price rejected at the trendline on 1H).
POI (Point of Interest): 3,030 – 3,040 zone acting as a strong supply/resistance zone.
📈 Support Levels:
2,978.949 (key demand/support zone).
2,956.129 (major support level).
📉 Resistance Zones:
✅3,020 area (15M minor supply zone, shaded red).
✅3,030–3,040 (POI level on 1H, shaded blue).
✅3,058.437 (major resistance).
🧠 Price Action Insights-1H Chart:
Price attempted to break the descending trendline but was quickly rejected (marked with a circle).
Multiple rejections from POI level suggest strong seller presence.
Strong bearish candle followed that rejection (confirmation of trend continuation).
15M Chart:
Price bounced from support at 2,978
Quick rally back to ~3,004, stalling below the minor supply at 3,020.
Could be forming a lower high (ideal short setup zone).
📌 Trade Setup Idea:
✅ Trade Type: Short (Sell)
🔽 Entry Zones (Sell Limit Ideas):
Aggressive: 3,020 (near the 15M minor supply zone)
Conservative: 3,030–3,040 (POI level on 1H chart)
🛑 Stop Loss:
Above 3,045 (well above POI and trendline breakout level)
🎯 Targets:
TP1: 2,978.949 (recent support, also previous bounce level)
TP2: 2,956.129 (major support level from 1H chart)
TP3 (Optional Swing): Below 2,950 if momentum continues
⚠️ Risk Management Tip (Beginner-Friendly):
Use position sizing based on your risk appetite (e.g., 1–2% of your account per trade).
Avoid entering late if price already breaks past POI or trendline with strong volume.
📌 Key Beginner Takeaways:
You're identifying liquidity zones, trendlines, and structure: excellent progress!
Use confluence (multiple factors aligning) to enter with higher probability.
Practice this setup in a demo account to gain confidence.
👉 Always follow TP/SL to protect your capital and maximize profits!
Disclaimer: This is for educational purposes only.
Always trade responsibly and manage your risk effectively

XAUUSD Next Move 2800 ? 🪙 FUNDAMENTALS:
✅China on Friday struck back at the U.S tariffs imposed by Trump with a slew of counter-measures including extra levies of 34% on all U.S. goods and export curbs on some rare-earths, deepening the trade war between the world's two biggest economies.
✅ More than 50 nations have reached out to the White House to begin trade talks since Trump rolled out sweeping new tariffs, top officials said on Sunday as they defended levies that wiped out nearly $6 trillion in value from U.S. stocks last week.
✅ Federal Reserve Chairman Jerome Powell said tariffs increased the risk of higher inflation and slower growth, highlighting the difficult path ahead for policymakers at the U.S. central bank
________________________________________
🔍 4H Hour Timeframe Analysis
📊 Trend & Price Action :
• Previous Trend: Clear uptrend inside a rising channel (marked by red lines).
• Recent Price Movement: Price broke down below the ascending channel, signaling trend weakness or possible reversal.
• Strong bearish candles show increased selling pressure recently.
📉 Key Technical Levels:
• Support Zone: Around $2,979–$2,957 (green and grey lines) — price bounced here, showing buyer interest.
• Resistance Zone: Around $3,057–$3,077 — a previous support zone now acting as resistance after the breakdown.
• Moving Averages:
o Red Line (likely 50 EMA): Recently broken down, now acting as dynamic resistance.
o Blue Line (likely 200 EMA): Around $2,990, price tested and bounced — this is often a key support in a trend.
🧠 Interpretation:
• Price broke structure (channel and EMAs), signaling a shift from bullish to bearish bias.
• The bounce from the 200 EMA and support zone suggests a potential short-term retracement or consolidation.
• If price fails to reclaim $3,057–$3,077, sellers may re-enter.
________________________________________
🔍 15-Minute Timeframe Analysis
📊 Trend & Price Action:
• Sharp intraday recovery from the low of around $2,957 to the current $3,033.
• But price is now facing resistance from a supply zone (highlighted in red).
• You’ve marked an Order Block (OB) around $3,125–$3,140 — a zone where institutional selling might have started.
📉 Key Levels:
• Resistance Zones:
o $3,076 (blue line) – likely 200 EMA, strong resistance.
o $3,057–$3,076 – supply area and previous breakdown zone.
o Order Block (OB) near $3,125–$3,140 – strong institutional resistance zone.
• Support Zones:
o $3,000, $2,978, and $2,957 – these are lower supports where price previously bounced.
🧠 Interpretation:
• Short-term, the price is retracing from a heavy drop.
• Watch how price behaves at $3,057–$3,076:
o Rejection = possible short setup.
o Break & close above = retracement could continue toward OB ($3,125).
• The OB is a potential reversal zone, where price could get heavily rejected if tested.
________________________________________
📌 Beginner Takeaways:
Trend is weakening – the uptrend broke, and the market is forming lower highs and lower lows.
Price is trying to recover from key support zones but facing resistance overhead.
Volume is increasing near support — shows interest from buyers but not a confirmed trend reversal yet.
The Order Block is a great place to watch for reversal trades (supply zone = potential sell).
________________________________________
✅ Suggested Actions for Practice:
Mark key support/resistance zones on your own chart to develop your structure-reading skills.
Scenario 1: Short if price rejects at $3,057–$3,076 zone.
Scenario 2: Long only if price closes above $3,077 and holds support.
Observe how price behaves near moving averages and OB zones
.
________________________________________
👉 Always follow TP/SL to protect your capital and maximize profits!
Disclaimer: This is for educational purposes only.
Always trade responsibly and manage your risk effectively
