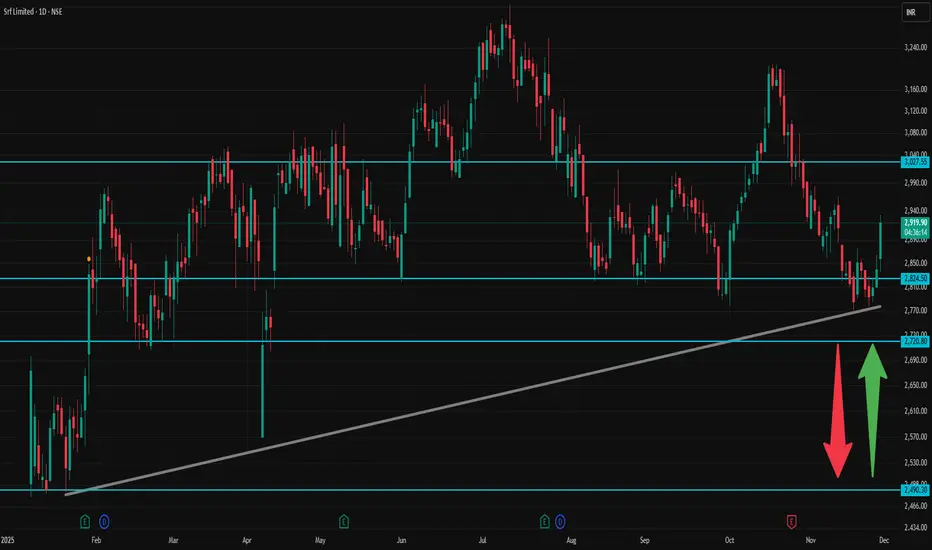
SRF 1 Day Time Frame ✅ Current context
According to public price data, SRF’s recent high for the day is ~ ₹ 2,933, low ~ ₹ 2,836.80.
As per a technical‑analysis summary: moving averages (short-to-medium term) and oscillators on daily timeframe show a bullish bias (Strong Buy on many signals).
🎯 How to interpret / trade with these levels
As long as price stays above Pivot (~₹ 2,866), bias remains mildly bullish — look for R1 → R2 → R3 as possible targets.
If momentum is strong (volume + positive broader market), a break above R2 (~₹ 2,920) could push toward R3 (~₹ 2,933–2,937+).
On downside, supports at ₹ 2,811.93 → ₹ 2,783.87 → ₹ 2,757.73 are key — loss of S1 may open S2/S3.
For conservative traders: good entry or add-on zones could be near S1 or pivot, with stop‑loss a little below S2/S3 depending on risk tolerance.
⚠️ Important caveats
These are static pivot-based levels, and real market moves may overshoot or not respect them depending on news, volume, macro‑market sentiment.
Given volatility (as seen in day’s high-low range), levels above R2 or below S2 can get tested — intraday discipline (stop-loss, position sizing) is crucial.
Always watch volume, overall index trend (Nifty/Sensex), sector news — technical levels work better when confirmed by context.
Chartanalysis
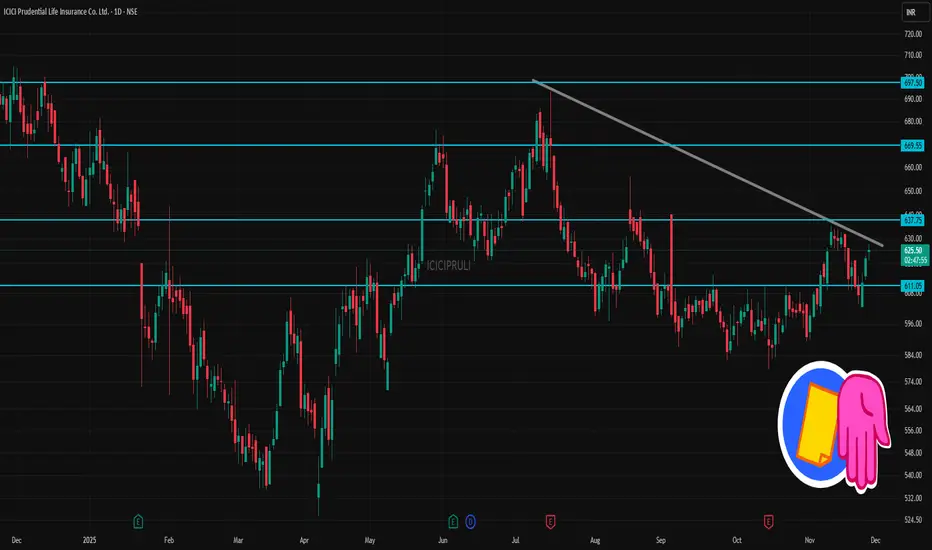
ICICIPRULI 1 Day Time Frame 📌 Latest Price & Context
Recent traded price: ~ ₹ 625–626.
52‑week range: Low ~ ₹525.80 — High ~ ₹704.70.
📈 What It Suggests (For 1‑Day / Short‑Term View)
As long as price remains above ~₹ 623–625, there is a short‑term bullish bias — next target could be ~₹ 630–635.
Dip toward ~₹ 615–620 could offer a buy‑on‑dip type entry (for traders), if volume and overall market sentiment stay supportive.
If price breaks below ~₹ 605–600, it may head toward the lower support zone — then caution/adapt strategy.
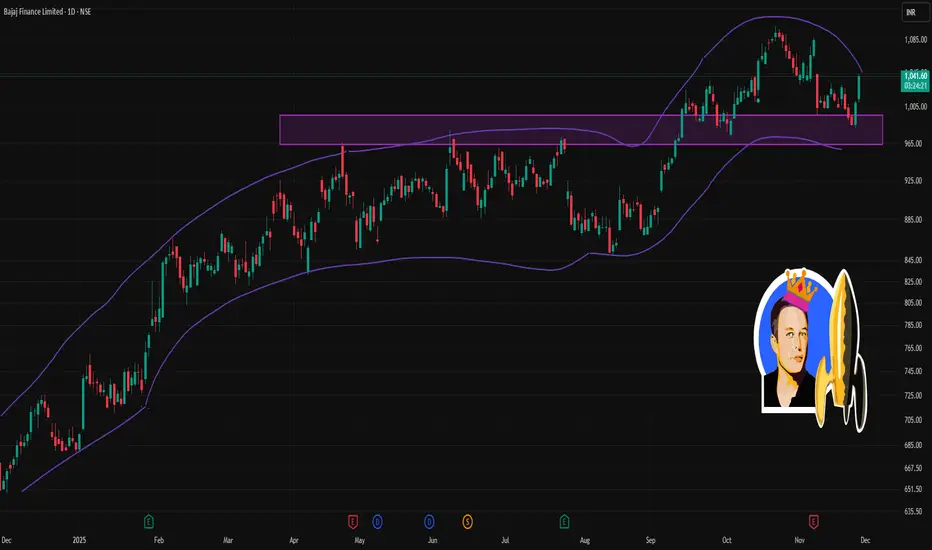
BAJFINANCE 1 Day Time Frame ✅ What we know now (as of latest available data)
1. The latest publicly quoted price for Bajaj Finance is ~ ₹1,042 – ₹1,044.
2. According to a recent report, the stock touched an intraday high of ₹1,042.20.
3. The stock is above its short‑ and long‑term moving averages, which suggests current bullish momentum.
⚠️ Important Notes / Context
These are technical levels derived using standard pivot‑point / support‑resistance calculation methods. They are not guaranteed — markets may overshoot or violently gap.
Always consider fundamentals (company news, sector, broader market sentiment) along with technicals before acting.
Use stop‑loss / risk management because intraday volatility can cause swings beyond these levels.
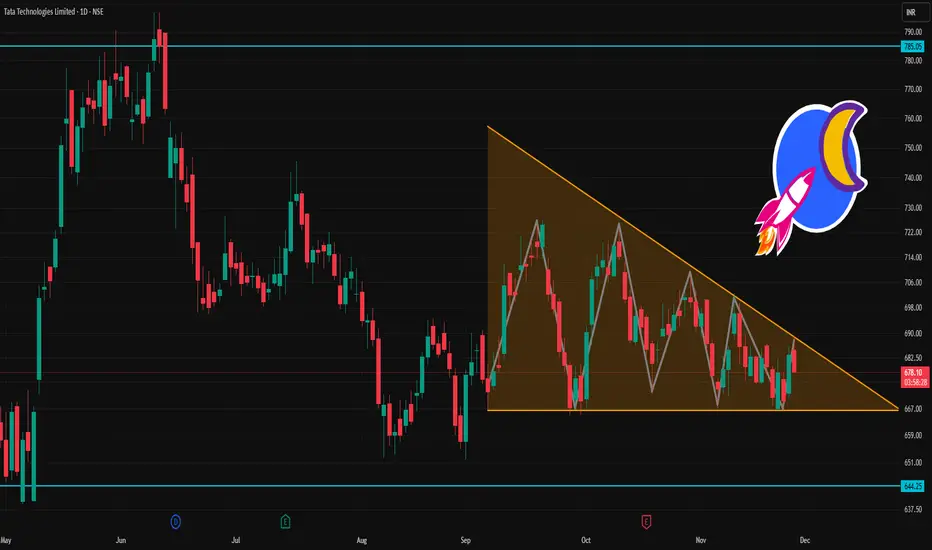
TATATECH 1 Day Time Frame 📌 Key recent data (approx as of last close):
Last traded price: ~ ₹676.75.
Day high / low: ~ ₹679 / ₹670.25.
52‑week high: ~ ₹973.85; 52‑week low: ~ ₹597.
🧮 What this suggests for today (intraday / short‑term only):
If Tata Tech trades above ₹672.7, it could aim for ₹677–684 as short‑term resistance.
A fall below ₹672.7 might push price toward ₹665–661 as support.
₹684–696 could act as a more extended intraday upside zone, if there’s bullish momentum.
🔎 Context & What to Watch Out For
The 52‑week high is still much higher — so in a broader sense, the stock remains far off prior highs.
On short‑term charts, some indicators (e.g. moving‑average crossovers / candle‑pattern heuristics) recently gave bearish / neutral signals.
Volatility and broader market sentiment (especially in the auto / engineering‑services / global tech outsourcing space) can swing prices significantly — so these levels are very approximate.
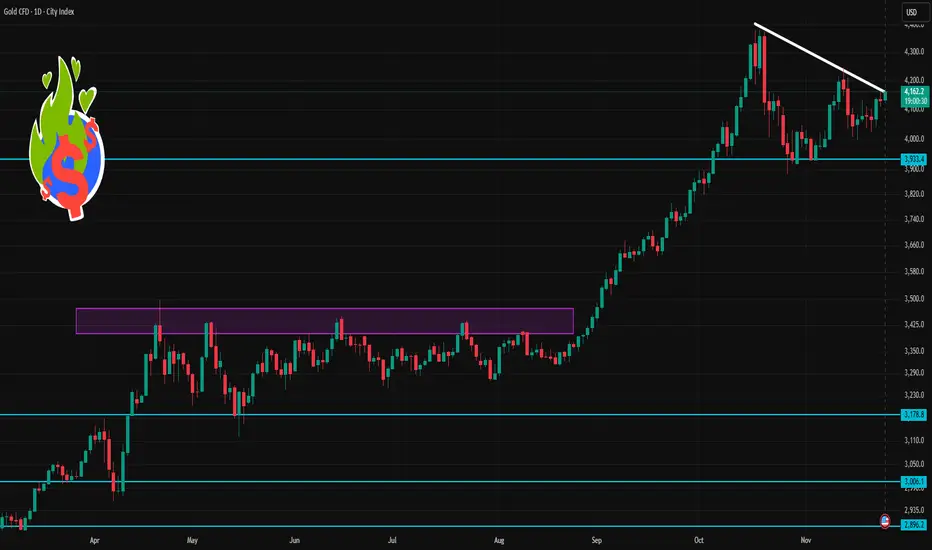
Gold 1 Day Time Frame 🔎 Current Context
1. Gold currently trades around US $4,160–4,165/oz.
2. Many technical-analysis services show daily momentum as bullish: moving averages, RSI/MACD and other indicators point toward a positive bias.
3. But macro factors (strong USD, Fed policy, global risk sentiment) remain important and may cause sharp swings.
⚠️ What to Watch Out For
Volatility: Gold remains sensitive to macro events — USD strength, rate expectations, major economic data — so price can easily break support/resistance zones.
False Breakouts: Even if price crosses a level, it may revert quickly. Combine with other indicators (volume, price action, confirmations) before acting.
Trend Shifts: A major change in global risk sentiment or central-bank moves can rapidly change trend direction, invalidating technical levels.
GRANULESGRANULES - The stock is currently consolidating after giving a breakout from a 7-month range.
The overall market structure remains bullish, and the EMAs are well-aligned, showing underlying strength.
A decisive breakout above the current consolidation zone could trigger a fresh upside move.
Key resistance levels: 597 and 625.
Keep it on your watchlist for paper trading.
✅ If you like my analysis, please follow me here as a token of appreciation :)
in.tradingview.com/u/SatpalS/
📌 For learning and educational purposes only, not a recommendation. Please consult your financial advisor before investing.

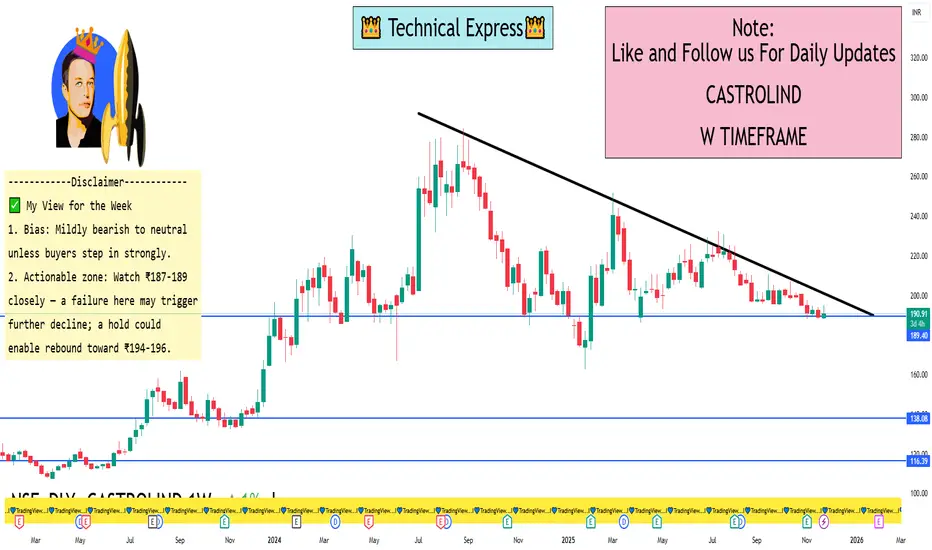
CASTROLIND 1 Week View 🔍 Key Levels
Based on recent technical data:
Support zone: ~ ₹187 – ₹189 (ET Money shows S3 ≈ ₹185.42, S2 ≈ ₹186.71)
Pivot / near-term equilibrium: ~ ₹190 – ₹191 (Weekly central pivot ~₹190.42)
Upside resistance: ~ ₹194 - ₹196 (Weekly R1 ~₹192.83, R2 ~₹196.64)
📈 Short-Term Bias & Likely Scenarios
The momentum indicators (RSI ~33, CCI negative) show the stock is under downward pressure/weak momentum.
If the price stays above ₹187-189, one could anticipate a bounce up into the ₹194-196 zone this week.
If it breaks below ~₹187-189 decisively, support further down could be ~₹183-185 (based on extension levels)
✅ My View for the Week
Bias: Mildly bearish to neutral unless buyers step in strongly.
Actionable zone: Watch ₹187-189 closely — a failure here may trigger further decline; a hold could enable rebound toward ₹194-196.
If you want a more aggressive trade setup (with stop-loss, reward ratio), I can map that too.
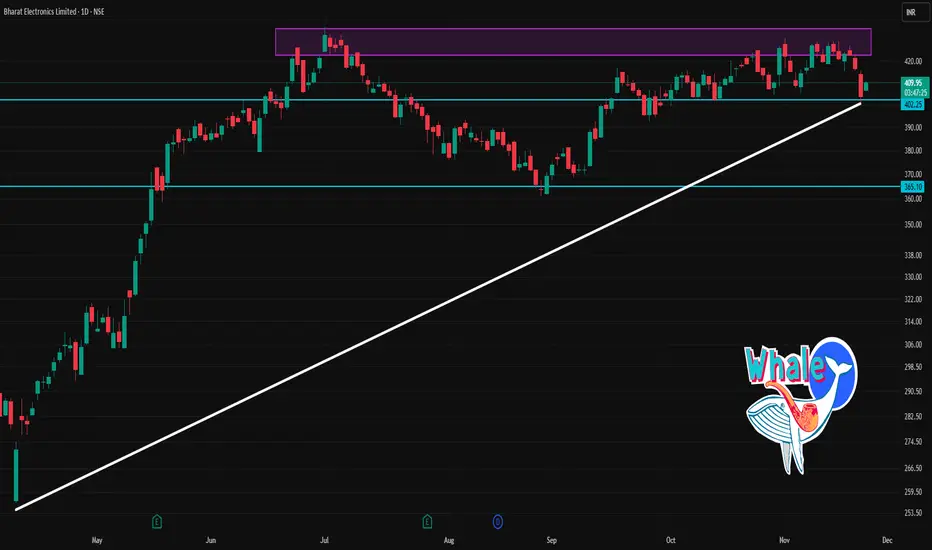
BEL 1 Day Time Frame✅ Current Status
Latest price around ₹407 – ₹410 on the NSE/BSE.
Technical indicators (daily time frame) are leaning bearish/weak: e.g., daily moving averages show more “sell” signals than “buy”.
📌 Key Levels to Watch (Daily Chart)
Based on available pivot/level data and recent price action, here are approximate levels:
Support levels:
S1 ~ ₹407–₹408
S2 ~ ₹405–₹406
A deeper support zone if this breaks might be ₹400-₹404.
Resistance levels:
Pivot ~ ₹413-₹414
R2 ~ ₹416-₹417
R3 ~ ₹419-₹420+
🔍 Short-Term Outlook
Because the stock is hovering just above support (~₹407-₹408), holding above this zone is important to maintain near-term structure.
If price breaks below ~₹405, risk of further weakness increases.
On the upside, a successful breakout above ~₹416-₹417 could open space towards ~₹419-₹420.
The current momentum is weak/negative, so any upside will likely need a catalyst (volume, news) to gain strength.
ENRIN 1 Day Time Frame 🔍 Key Price Info
Last traded ~ ₹3,090 (as of ~10:44 AM IST) on 25 Nov 2025.
Day’s high-low range: ~ ₹3,090 – ₹3,303 (intraday high reported ~₹3,303).
52-week range: ~ ₹2,508.80 – ₹3,625.00.
🎯 Support & Resistance Levels (Short Term)
Support Levels:
~ ₹3,050 – ₹3,070: close to current price, would be first level of support.
~ ₹3,000 – ₹3,030: if the stock breaks below the above, this zone becomes important.
~ ₹2,950 – ₹2,990: deeper support and closer to lower end of recent consolidation.
Resistance Levels:
~ ₹3,250 – ₹3,300: recent high zone around ₹3,303, so getting above this would be bullish.
~ ₹3,350 – ₹3,400: next significant zone before approaching the 52-week high.
~ ₹3,600+: near the 52-week high (₹3,625) and a major resistance barrier.
📉 Intraday Trading View
If the stock holds above ~₹3,050-₹3,070 with strong volume, it could attempt a push toward the resistance zone of ~₹3,250-₹3,300.
If it loses support at ~₹3,050, watch for potential slide toward ~₹3,000 or lower ~₹2,950 zone.
Volume, market sentiment & any corporate news will greatly influence whether it can break resistance or find support.

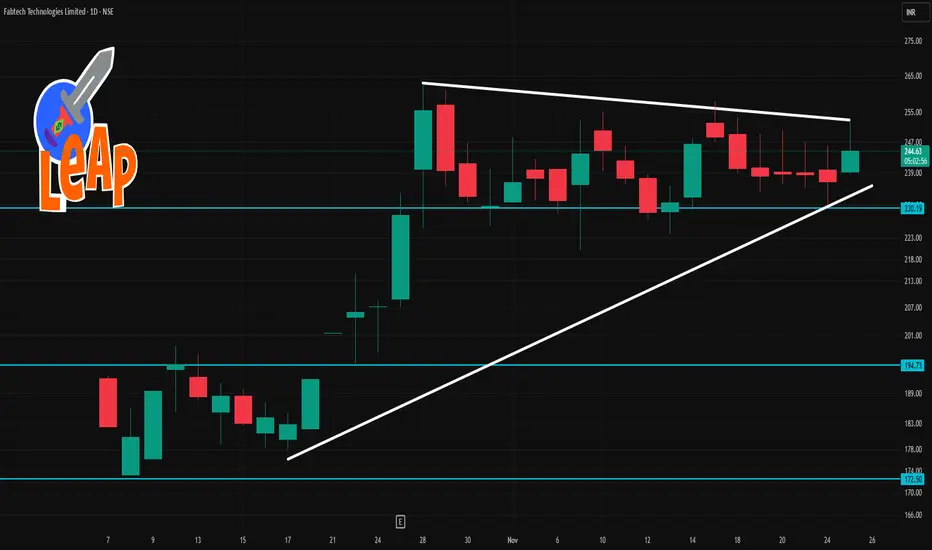
Fabtech 1 Day Time Frame 🔍 Technical Context
Moving averages (20-day, 50-day) are showing price above them, which suggests bullish bias.
Oscillators: RSI ~ 59-60 meaning moderate strength.
A recent source says the daily summary is “Neutral” on investing.com, indicating caution.
1-day pivot levels (classic) from Investing.com:
Pivot ~ ₹ 237.73
Resistance R1 ~ ₹ 240.46, R2 ~ ₹ 244.72, R3 ~ ₹ 247.45
Support S1 ~ ₹ 233.47, S2 ~ ₹ 230.74, S3 ~ ₹ 226.48
📊 Key Levels to Watch Today
Support Zone: ~ ₹ 233-235
If the stock approaches or dips into this area, watch for whether it holds or breaks.
Immediate Pivot / Mid-range: ~ ₹ 237-238
The pivot (~₹237.73) is a critical inflection point. A clear move above might bias upside; a break below may shift focus downward.
Resistance Zone: ~ ₹ 240-245
Upper resistance around ~₹240.46 to ~₹244.72. If momentum picks up and this zone is breached, next upside target ~₹247.45.
Lower Breakdown Level: ~ ₹ 230-227
If support in the ~233-235 zone fails, look toward ~₹230.74 and then ~₹226.48 as next real support.
MARKET CONTEXT – XAUUSD (1H)Gold is currently trading right below the intersection of the short-term descending trendline and the long-term ascending trendline, creating a compression zone. This is the type of structure that often leads to a strong breakout.
1. Volume Profile Structure
VAH zone (Value Area High) around 4080–4085, indicating a strong previous selling area where buying pressure weakens and profit-taking increases.
POC zone (4067–4072): The most traded area—where buyers and sellers are balanced. Price keeps getting rejected here, showing the market is not yet ready for a strong bullish push.
VAL zone (4051–4055): Price is moving right at VAL, showing the market is testing the lower boundary of value.
2. Market Structure
Price remains within a short-term downtrend channel and has not broken the descending trendline yet.
However, the recent lows continue to be defended around 4050–4047, showing buyers are still protecting this level.
If price breaks above the descending trendline and closes above the POC, the market may retrace toward:
4058
4067
4080
3. Key Levels
Major Support: 4047–4044 (previous low + lower VAL boundary)
Big Demand Zone: 4035–4028 → if tapped, it may generate a strong rebound.
Strong Resistance: 4065–4072 (POC), then 4080–4085 (VAH)
4. Current Signals
Price is sitting at the edge of VAL → a common area for small reversals.
No clear reversal structure yet, but buying pressure is still holding the lows firmly.

ULTRACEMCO 1 Week Time Frame ✅ Current picture
1. The stock is trading around ₹11,650-11,700 in the NSE market.
2. Weekly indicators show caution: moving averages (20, 50, 100) are above the current price, signalling short‐term weakness.
3. According to weekly pivot‐levels from Moneycontrol:
Resistance around ₹11,865 – ₹12,115 (Classic)
Support around ₹11,501 – ₹11,365
4. Another source gives near-term support ~ ₹11,684 / ₹11,639 / ₹11,587, pivot ~ ₹11,736, resistance ~ ₹11,781 / ₹11,833.
5. Technically the sentiment is “Sell” on short‐term/higher timeframes: e.g., all major moving averages show “Sell” in investing.com.
6. Weekly MACD and RSI are showing mild bearish or neutral signals.
⚠️ Key caveats
These are purely technical levels for the very short term (≈ 1 week) and assume no major news/shock.
Market, sector (cement) and macro conditions (costs, demand) can sharply change the picture.
Strongest moving averages (100/200) are still significantly higher, signalling a broader weakness in trend.

HAL – Trendline Rejection & Short SetupPrice has approached a major descending trendline and shown clear rejection near the supply zone. The structure is still respecting lower highs, indicating sellers are active at the top of the range.
I’ve taken a short position based on:
Retest of the descending trendline
Rejection from the previous supply zone
Overall bearish momentum within the channel
Good risk–reward towards the major demand zone around 4360
Invalidation:
Idea becomes invalid if price breaks and sustains above the trendline + supply zone.
Targets:
Major support / demand zone around 4360
Further downside if structure breaks
This is a technical analysis–based idea, not financial advice.
Let’s see how price reacts in the coming sessions.

BEL 1 Month Time Frame📌 Key Levels & Observations
Current price: approximately ₹ 416.35 per share.
Recent range: Daily highs ~₹ 423–424, lows ~₹ 415.50.
52-week high ~₹ 436 and 52-week low ~₹ 240.25.
🎯 Short-Term (1-Month) Important Levels
Support zone: ~₹ 405-410 — falling below this may weaken short-term structure.
Resistance zone: ~₹ 430-435 — breaking above this could open scope toward ₹ 440.
Near-term target range: If bullish momentum holds, look toward ~₹ 430-440.
Risk zone: If momentum falters and the support zone fails, price may drift back toward ~₹ 400 or lower.
⚠️ Caveats
These levels are technical estimates, not fundamental valuations or guarantees.
Market sentiment, order flows (for BEL), defence‐policy changes, etc. can shift the picture quickly.
Always use stop-loss or risk controls.

Venus Remedies Limited - Breakout Setup, Move is ON...#VENUSREM trading above Resistance of 638
Next Resistance is at 1182
Support is at 424
Here is previous chart:
Chart is self explanatory. Levels of breakout, possible up-moves (where stock may find resistances) and support (close below which, setup will be invalidated) are clearly defined.
Disclaimer: This is for demonstration and educational purpose only. This is not buying or selling recommendations. I am not SEBI registered. Please consult your financial advisor before taking any trade.

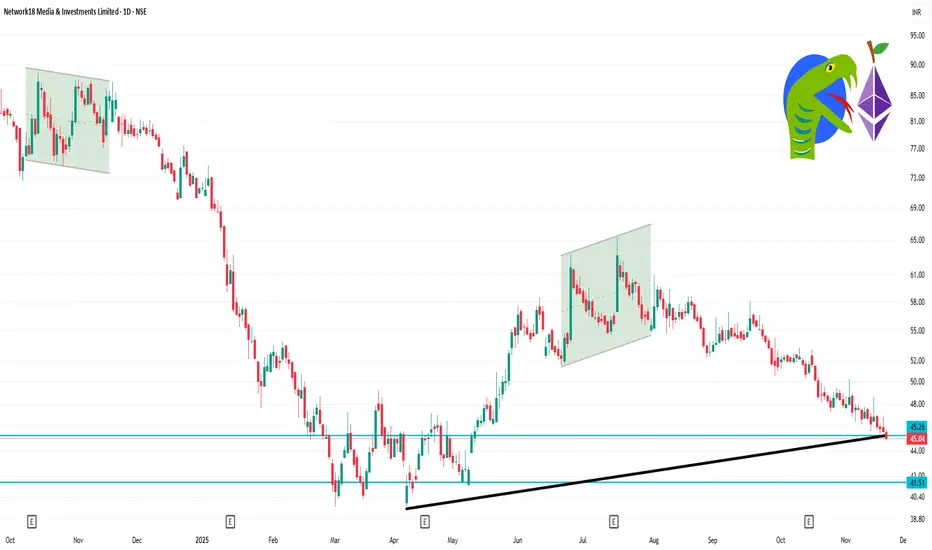
NETWORK18 1 Day Time Frame Current Price: ~ ₹ 45.04.
Day’s Range: ~ ₹ 44.89 (low) to ₹ 45.76 (high)
Key Support Level: Around ₹ 44.50-45.00 — if price breaks below this, further downside may open.
Key Resistance Level: Around ₹ 46.50-47.00 — if price breaks above this with volume, upside potential may resume.
52-week range: Low ~ ₹ 39.66, High ~ ₹ 85.39.
MARKET CONTEXT BTC H1 I NOV.221. Market Overview
Main Trend: BTC is currently in a correction phase following the drop from the highs (92,000+ area). Price is moving sideways within a wide range defined by the Volume Profile.
Current Position: Price is trading around $83,959, positioned just below the POC (Point of Control) and below the Daily Open ($85,054). The fact that price is below the daily open suggests that selling pressure is slightly dominant in today's session.
Trendline Structure: There is a descending trendline (dashed black line) connecting lower highs. The price attempted a breakout above this line but is currently showing signs of a retest or potentially a weakness (fakeout).
2. Price Action Analysis
Key Resistance Zones:
POC Zone (84,250 - 85,054): This is the area with the highest traded volume. Price is currently stuck right below this zone. Specifically, the $85,054 (Daily Open) level is a critical barrier. If BTC fails to reclaim this, the short-term bearish trend will continue.
VAH Zone (87,764 - 87,983): This is the extended target if the Bulls manage to regain control (Value Area High).
Key Support Zones:
Descending Trendline: Price is retesting this breakout line (around the 83,000 - 83,500 area).
VAL Zone (81,329 - 81,441): This is the Value Area Low. This serves as the final line of defense for buyers before prices potentially drop deeper.
3. Price Scenarios & Signals
Given the price location relative to the POC and Trendline, there are two main scenarios for today:
Scenario 1: Bearish Rejection (High Probability)
Since the price is below the Daily Open and struggling at the POC, bears are trying to push the price lower.
Development: Price rallies slightly to the 84,200 - 84,500 area but gets rejected, leaving long upper wicks or large bearish candles. Price then slips back below the descending trendline.
Signal: A 1H candle close below 83,500.
Targets:
TP1: 82,500
TP2: 81,441 (VAL Zone). If this level breaks, price will look for lower liquidity (79k-80k).
Scenario 2: Bullish Reclaim
For this scenario to play out, strong buying power (Volume) is needed to break the current indecision.
Development: Price bounces strongly from the current trendline, piercing through the POC zone and closing firmly above the Daily Open.
Signal: A decisive 1H candle close above 85,100 (clearing both Daily Open and POC).
Targets:
TP1: 86,500
TP2: 87,764 - 87,983 (VAH Zone).
4. Summary
The current status of BTC is Neutral leaning Bearish (Bearish Bias) in the short term (intraday) because the price is trading below the key equilibrium zone (POC) and the Daily Open.
"Kill Zone" (Watch Area): 84,000 - 85,000. This zone will decide the trend for the day.
Recommended Action:
Short: Look for reversal/rejection signals around 84,500 or if the price breaks back down below the trendline at 83,500. Stop loss above 85,200.
Long: Only enter if the price confirms a breakout above 85,100 (Reclaim POC) or wait to buy the dip at the hard support of 81,441 (VAL) if a reversal signal appears there. Avoid Longing in the current "middle of nowhere" zone.
Disclaimer: The analysis and information provided above are for educational and informational purposes only and do not constitute financial investment advice. Please do your own research (DYOR) and take full responsibility for your trading decisions.

Gold XAUUSD – Fresh Resistance Tested Twice, Bears Eye 4057 PullGold gave us a clean reaction today, rejecting the 4107–4110 supply zone not once, but twice. That double tap reinforced a fresh resistance band at 4087–4095, where sellers stepped back in with intention.
As long as 4012 holds on the upside, this resistance zone remains my short-term line in the sand. Any push back into 4087–4095 may attract renewed selling pressure, keeping the door open for a move toward 4057, with momentum potentially extending lower if sellers stay in control.
I’ll be watching how price behaves on each revisit—structure remains king.
Your feedback drives our content and keeps everyone trading smarter. Let’s make those pips together! 🚀
Happy Trading,
– The InvestPro Team

TVSMOTOR 1 Day Time Frame 📌 Key levels (approximate)
Pivot (classic) for recent day: around ₹ 3,408.73.
Resistance levels:
R1 ≈ ₹ 3,448.47
R2 ≈ ₹ 3,510.43
R3 ≈ ₹ 3,550.17
Support levels:
S1 ≈ ₹ 3,346.77
S2 ≈ ₹ 3,307.03
S3 ≈ ₹ 3,245.07
🎯 What to watch for possible trade decisions
Bullish scenario: If price breaks above the pivot (~₹3,409) and holds above R1 (~₹3,448), a move toward R2 (~₹3,510) or higher may be possible.
Bearish scenario: A break below S1 (~₹3,347) could open risk toward S2 (~₹3,307) or S3 (~₹3,245).
Neutral/Ranging: The stock may also trade between ~₹3,347 and ~₹3,448 while the trend remains unclear.

[INTRADAY] #BANKNIFTY PE & CE Levels(21/11/2025)Bank Nifty is likely to open flat today, indicating a neutral start with no strong directional bias in the early session. A sustained move above the 59050–59100 zone will activate the buying levels, opening targets of 59250, 59350, and 59450+.
If momentum continues and price moves into the higher resistance band at 59550–59600, the next buying opportunity becomes active with upside targets at 59750, 59850, and 59950+.
On the downside, weakness will be confirmed only if the index slips below the 59450–59400 area, triggering a selling entry with targets of 59250, 59150, and 59050-. Since the opening is flat, price action near these key trigger zones will decide the trend. Until then, the market may remain inside the range with mild volatility.

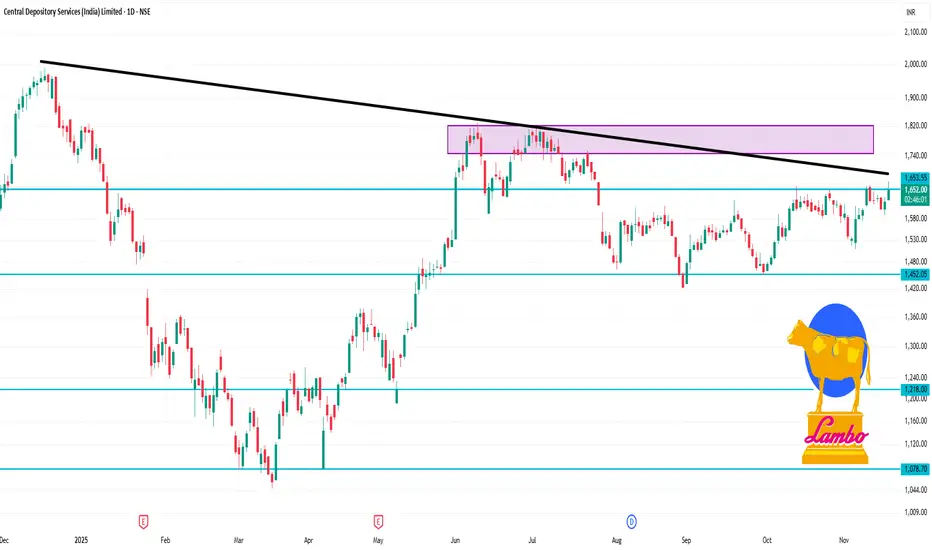
CDSL 1 Day Time Frame Stock Price & Day’s Range
The share price is approximately ₹1,625.80 on the NSE.
The day’s trading range is roughly ₹1,616 to ₹1,648.80.
52-week range: about ₹1,047.45 (low) to ₹1,989.80 (high).
On a 1-day time-frame perspective
From an intraday point of view, the range (~₹1,616-1,649) shows the market is consolidating rather than making a sharp breakout or breakdown.
Key levels to watch intraday:
Support: around the lower end of the day’s range (~₹1,616).
Resistance: near the upper end (~₹1,648.80) for now.
If price breaks above ₹1,650 convincingly with volume, it might trigger further upside intraday; conversely a break below ~₹1,610 could signal intraday weakness.
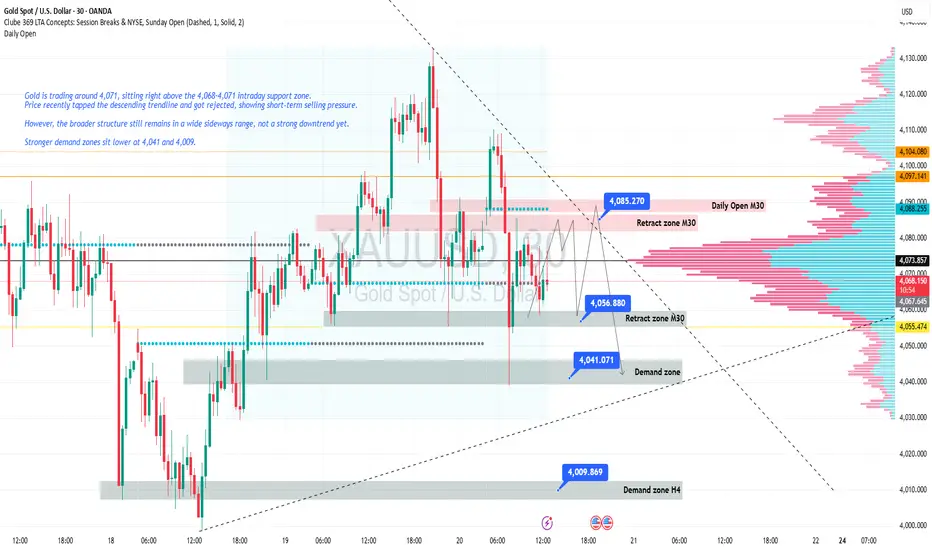
OVERVIEW MARKET CHART M30 11/201. Current Context
Gold is trading around 4,071, sitting right above the 4,068–4,071 intraday support zone.
Price recently tapped the descending trendline and got rejected, showing short-term selling pressure.
However, the broader structure still remains in a wide sideways range, not a strong downtrend yet.
Stronger demand zones sit lower at 4,041 and 4,009.
⸻
2. Price Action at 4,071
Currently gold is:
• Retesting 4,068–4,071 support
• Showing lower wicks → light buying pressure
• Still trading below M30/H1 downtrend line
This suggests the probability of sideways movement – accumulation – or a small bullish retest is high.
📌 If 4,068 breaks → price may head to 4,056 and then 4,041
📌 If 4,071 holds → price may bounce toward 4,077–4,080, possibly 4,085
⸻
3. Conclusion (Real-Time)
👉 No BUY yet – wait for confirmation at 4,071
👉 No SELL yet – only sell if price closes below 4,068
👉 Low volatility – prioritize safety
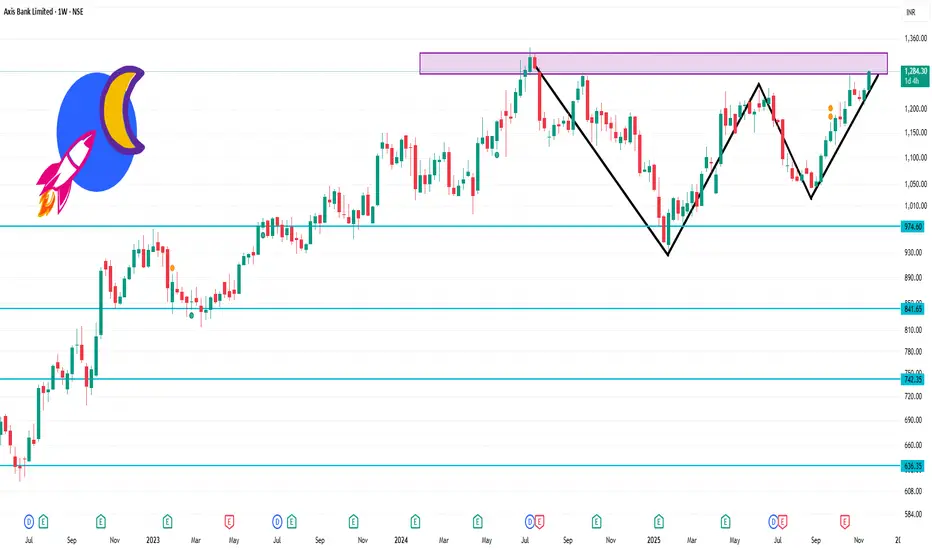
AXISBANK 1 Week Time Frame 🔍 Key Levels for the Week
Based on recent pivot/technical data:
Resistance levels: ~ ₹1,276 to ₹1,282 (around daily R1/R2)
Higher resistance: ~ ₹1,290-₹1,302 if uplink happens
Support levels: ~ ₹1,252-₹1,246 as near-term floor
Broader weekly support: ~ ₹1,232-₹1,218 region if deeper pullback
⚠️ Things to keep in mind
Current price is near the 52-week high region (~₹1,284) which increases risk of resistance/strain.
Short-term signals/pivots are useful but market news, macro banking events, FII/DII flows can quickly shift dynamics.
Use stop-losses or risk-controls if trading around these levels given the tight range and possible whipsaw.