AI & Machine Learning Models in Market Prediction1. Overview of AI and Machine Learning in Finance
1.1 Artificial Intelligence in Finance
AI refers to computer systems designed to perform tasks that normally require human intelligence. In finance, AI can perform tasks like risk assessment, fraud detection, sentiment analysis, and predictive modeling. Its ability to simulate human-like decision-making is particularly valuable in trading, where speed, accuracy, and adaptability are crucial.
1.2 Machine Learning as a Subset of AI
Machine Learning is a subset of AI that focuses on algorithms that learn from data. Unlike traditional statistical methods, ML models improve their predictive accuracy as they are exposed to more data. ML can be categorized into:
Supervised Learning: The model learns from labeled historical data to predict future outcomes (e.g., stock prices).
Unsupervised Learning: The model identifies hidden patterns in unlabeled data (e.g., market clustering, anomaly detection).
Reinforcement Learning: The model learns by trial and error to maximize rewards, often used in algorithmic trading.
2. Types of Machine Learning Models Used in Market Prediction
2.1 Regression Models
Regression analysis predicts continuous outcomes, such as stock prices, interest rates, or commodity values. Common models include:
Linear Regression: Models the relationship between a dependent variable and one or more independent variables.
Ridge and Lasso Regression: Improve linear regression by adding regularization to prevent overfitting.
Polynomial Regression: Captures non-linear relationships in market data.
2.2 Classification Models
Classification models are used when outcomes are categorical, such as predicting whether a stock will go up or down. Examples include:
Logistic Regression
Support Vector Machines (SVM)
Random Forests
Gradient Boosting Machines
2.3 Time Series Models
Financial data is inherently sequential. Time series models exploit temporal dependencies to forecast future trends:
ARIMA (Auto-Regressive Integrated Moving Average)
SARIMA (Seasonal ARIMA)
Prophet (by Facebook)
LSTM (Long Short-Term Memory networks): A type of neural network ideal for capturing long-term dependencies in sequential data.
2.4 Deep Learning Models
Deep learning involves multi-layer neural networks capable of modeling complex, non-linear relationships in market data:
Convolutional Neural Networks (CNNs): Typically used for image recognition but applied to visualized market data like candlestick charts.
Recurrent Neural Networks (RNNs): Designed for sequential data, with LSTM and GRU as advanced versions.
Transformers: Advanced models that handle large datasets and multiple features, increasingly used in financial forecasting.
2.5 Reinforcement Learning
Reinforcement Learning (RL) models are particularly popular in algorithmic trading. In RL:
The agent (trading algorithm) interacts with an environment (market).
It receives feedback (reward or penalty) based on its actions.
Over time, it learns strategies to maximize cumulative rewards.
Applications include high-frequency trading, portfolio optimization, and dynamic hedging strategies.
3. Data Sources for AI Market Prediction
AI models require large and diverse datasets. Key sources include:
Historical Market Data: Prices, volumes, and volatility indices.
Economic Indicators: GDP, inflation, employment rates.
Company Fundamentals: Financial statements, earnings reports, and debt levels.
Alternative Data: Social media sentiment, news articles, Google Trends, satellite imagery.
High-Frequency Data: Tick-by-tick data used in HFT algorithms.
Data quality is critical: noisy, incomplete, or biased data can significantly reduce model accuracy.
4. Features and Variables in Market Prediction
Feature engineering transforms raw data into meaningful input variables. Common features include:
Technical Indicators: Moving averages, RSI, MACD, Bollinger Bands.
Sentiment Scores: Derived from social media or news sentiment analysis.
Macroeconomic Variables: Interest rates, commodity prices, geopolitical events.
Market Microstructure: Order book depth, bid-ask spreads, and trade volume.
Feature selection helps reduce dimensionality, improve computation efficiency, and avoid overfitting.
5. Advantages of AI and ML in Market Prediction
Speed and Efficiency: Can analyze millions of data points in seconds.
Pattern Recognition: Detects complex non-linear patterns invisible to human analysts.
Adaptability: Models can adjust to new market conditions.
Risk Management: Improves predictive accuracy, helping mitigate losses.
Automation: Enables algorithmic trading and continuous market monitoring.
6. Challenges and Limitations
Data Quality and Availability: Poor or biased data reduces model effectiveness.
Overfitting: Models may perform well on historical data but fail in real-time markets.
Market Unpredictability: Black swan events and irrational market behavior are difficult to model.
Interpretability: Complex models like deep neural networks are often “black boxes.”
Regulatory Compliance: Financial regulations may restrict the use of certain AI models.
7. Case Studies and Applications
7.1 Stock Price Prediction
Companies use LSTM networks and hybrid models combining technical indicators and sentiment analysis to forecast stock movements. Some hedge funds leverage AI for short-term price predictions.
7.2 Algorithmic and High-Frequency Trading
AI-driven HFT systems execute thousands of trades per second using reinforcement learning and predictive analytics to exploit market inefficiencies.
7.3 Portfolio Optimization
AI models can rebalance portfolios dynamically, considering risk, expected returns, and correlations between assets, often outperforming traditional mean-variance optimization.
7.4 Risk Assessment and Fraud Detection
Machine learning models assess credit risk, detect unusual trading patterns, and flag potential fraud in real-time.
8. Future Trends
Explainable AI (XAI): Increasing demand for transparent models that can explain decisions to regulators and investors.
Integration with Alternative Data: Enhanced predictive power through social media, news sentiment, and satellite imagery.
Quantum Computing: Potential to accelerate complex computations and improve prediction accuracy.
AI-Driven Macroeconomic Forecasting: Integration of global economic, political, and environmental data for holistic market prediction.
Conclusion
AI and Machine Learning have transformed financial market prediction, offering unprecedented speed, accuracy, and adaptability. By leveraging historical and real-time data, these technologies can identify complex patterns, optimize trading strategies, and improve risk management. However, challenges such as data quality, overfitting, interpretability, and market unpredictability remain.
As AI continues to evolve, combining explainable models, alternative data, and advanced computational techniques will redefine the future of market analysis, making financial decision-making more informed and strategic.
Chart Patterns

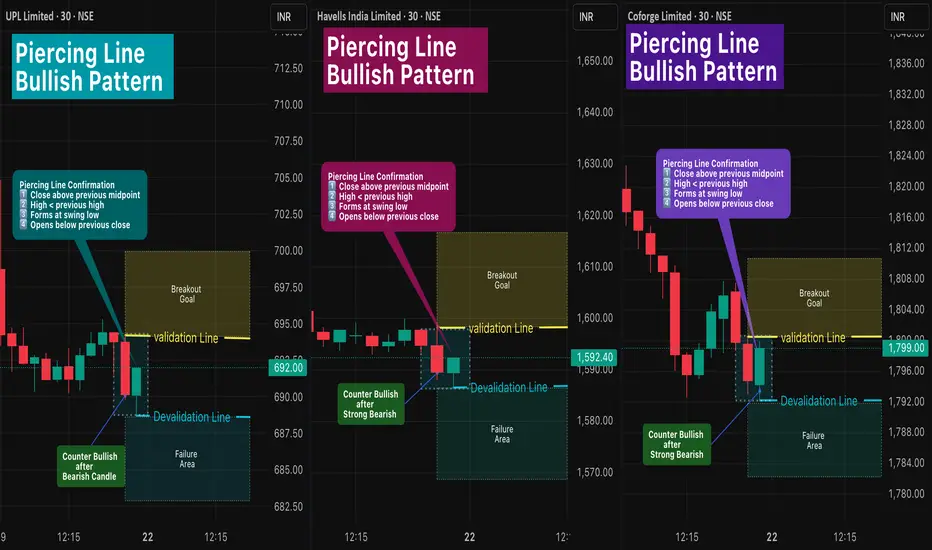
Piercing Line Bullish Pattern 🔎 Intro / Overview
The Piercing Line Pattern is a two-candle bullish reversal setup that forms after a downtrend.
- Sellers lose control → Buyers step in strongly.
- Entry and exit are rule-based using Validation and Devalidation lines to restrict false signals.
- Stop-loss is based on swing low, and Target is 1R (equal to risk distance).
This setup can be applied across any symbols and any timeframe (Just make sure it is after Downtrend or at Swing Low).
📊 Example symbols in this idea:
NSE:UPL · NSE:HAVELLS · NSE:COFORGE
___________________________________________________________
📌 How to Use
✅ Piercing Line Pattern – Confirmation Rules
1️⃣ Close Above Midpoint → The second candle must close above the midpoint of the first bearish candle.
2️⃣ Lower High Condition → The second candle’s high should be lower than the previous candle’s high, showing controlled recovery rather than immediate breakout.
3️⃣ Swing Low Context → The pattern forms after a swing low or decline, signaling potential reversal from bearish to bullish.
4️⃣ Gap/Open Condition → The second candle should open below the prior candle’s close, reflecting initial selling pressure before buyers take over.
When Pattern Confirm - Entry Rules -
📌 Validation → Close above the Pattern High .
📌 Devalidation → Close below Swing Low before validation.
When all conditions align, the Piercing Line confirms a bullish reversal opportunity.
__________________________________
🎯 Trading Plan
- Entry → Candle closes above the Validation line (Pattern high).
- Failure → If candle closes below Devalidation line before validation.
- Stoploss → Swing Low.
- Target → Equal to stoploss distance (1R).
___________________________________________________________
📊 Chart Explanation
All Patterns shown in 30-min timeframe :
1️⃣ NSE:UPL (UPL Limited)
- Entry @ 694.20 → Breakout Goal confirmed only on candle close above this level.
- Devalidation Level: If price closes below 688.70 , the Pattern shifts to the Failure Area.
2️⃣ NSE:HAVELLS (Havells India Limited)
- Entry @ 1598.20 → Breakout Goal confirmed only on candle close above this level.
- Devalidation Level: If price closes below 1586.50 , the Pattern shifts to the Failure Area.
3️⃣ NSE:COFORGE (Coforge Limited)
- Entry @ 1800.50 → Breakout Goal confirmed only on candle close above this level.
- Devalidation Level: If price closes below 1792.10 , the Pattern shifts to the Failure Area. .
📊 All three Patterns are live and active in the same timeframe.
___________________________________________________________
👀 Observation
- Piercing Line is most effective near swing lows after a clear downtrend.
- Strict validation/devalidation rules help avoid false entries.
- Works well across multiple symbols when conditions align.
___________________________________________________________
❗ Why It Matters?
- Defines entries and exits clearly with rule-based validation.
- Provides a structured framework to trade reversals confidently.
___________________________________________________________
🎯 Conclusion
The Piercing Line Pattern is a disciplined bullish reversal signal.
By combining Validation and Devalidation Rules, traders gain clarity and protection against false trades.
🔥 Patterns don’t predict. Rules protect. 🚀
___________________________________________________________
⚠️ Disclaimer
📘 For educational purposes only.
🙅 Not SEBI registered.
❌ Not a buy/sell recommendation.
🧠 Purely a learning resource.
📊 Not Financial Advice.
Part 1 Master Candlestick PatternIntroduction
Options trading has always attracted traders and investors because of its flexibility, leverage, and the ability to profit in both rising and falling markets. Unlike simple stock buying, where you purchase shares and wait for them to rise, options allow you to speculate, hedge, or even create income-generating strategies. But this flexibility comes at a cost: risk.
In fact, while options provide opportunities for huge rewards, they also carry risks that can wipe out capital quickly if not managed properly. Many new traders get lured by the promise of quick profits and ignore the hidden dangers. The truth is, every option trade is a balance between potential gain and potential loss — and understanding the nature of these risks is the first step to trading responsibly.
In this guide, we’ll explore all major types of risk in options trading — from market risk and time decay to volatility traps, liquidity issues, and even psychological mistakes.
1. Market Risk – The Most Obvious Enemy
Market risk is the possibility of losing money due to unfavorable price movements in the underlying asset. Since options derive their value from stocks, indices, currencies, or commodities, any sharp move against your position can create losses.
For call buyers: If the stock fails to rise above the strike price plus premium, you lose money.
For put buyers: If the stock doesn’t fall below the strike price minus premium, the option expires worthless.
For sellers (writers): The risk is even greater. A short call can lead to unlimited losses if the stock keeps rising, and a short put can cause heavy losses if the stock collapses.
👉 Example:
Suppose you buy a call option on Reliance Industries with a strike price of ₹3,000 at a premium of ₹50. If the stock stays around ₹2,950 at expiry, your entire premium (₹50 per share) is lost. Conversely, if you had sold that same call, and the stock shot up to ₹3,300, you’d lose ₹250 per share — far more than the premium you collected.
Lesson: Market risk is unavoidable. Every trade needs a pre-defined exit plan.
2. Leverage Risk – The Double-Edged Sword
Options provide huge leverage. You control a large notional value of stock by paying a small premium. But this magnifies both profits and losses.
A 5% move in the stock could mean a 50% change in the option’s premium.
A trader who overuses leverage can blow up their capital in just a few trades.
👉 Example:
With just ₹10,000, you buy out-of-the-money (OTM) Bank Nifty weekly options. If the market moves in your favor, you might double your money in a day. But if it goes the other way, you could lose everything — and very fast.
Lesson: Leverage is powerful, but without discipline, it’s deadly.
3. Time Decay Risk – The Silent Killer (Theta Risk)
Options are wasting assets. Every day that passes reduces their time value, especially as expiry nears. This is called Theta decay.
Option buyers suffer from time decay. Even if the stock doesn’t move, the option premium keeps falling.
Option sellers benefit from time decay, but only if the market stays within their expected range.
👉 Example:
You buy an at-the-money (ATM) Nifty option one week before expiry at ₹100. Even if Nifty stays flat, that option could drop to ₹40 by expiry simply because of time decay.
Lesson: If you are an option buyer, timing is everything. If you are a seller, time decay works in your favor, but risk still exists from sudden moves.
4. Volatility Risk – The Invisible Factor (Vega Risk)
Volatility is the heartbeat of options pricing. Higher volatility means higher premiums because there’s a greater chance of large price moves. But this creates Vega risk.
If you buy options during high volatility (like before elections, results, or big events), you may pay inflated premiums. Once the event passes and volatility drops, the option’s value can collapse, even if the stock moves as expected.
Sellers face the opposite problem. Selling options in low volatility periods is dangerous because any sudden jump in volatility can cause premiums to spike, leading to losses.
👉 Example:
Before Union Budget announcements, Nifty options trade at very high premiums. If you buy expecting a big move, but the budget turns out uneventful, volatility drops sharply, and the option loses value instantly.
Lesson: Never ignore implied volatility (IV) before entering an option trade.

Divergence Secrets1. Understanding Options: The Foundation
Options are derivative instruments that derive their value from an underlying asset, such as stocks, indices, commodities, or currencies. They grant the buyer the right—but not the obligation—to buy or sell the underlying asset at a predetermined price within a specified period. There are two primary types of options:
Call Option: Provides the right to buy the underlying asset at a specified price (strike price) before or at expiration.
Put Option: Provides the right to sell the underlying asset at a specified price before or at expiration.
Key Terms:
Strike Price: The price at which the underlying asset can be bought or sold.
Expiration Date: The date on which the option contract expires.
Premium: The cost paid by the buyer to acquire the option.
In-the-Money (ITM): When exercising the option is profitable.
Out-of-the-Money (OTM): When exercising the option is not profitable.
Options provide leverage, enabling traders to control large positions with a relatively small capital outlay, creating unique opportunities for profit in both bullish and bearish markets.
2. Market Opportunities in Options Trading
Options trading opportunities are vast, ranging from directional plays to hedging strategies. The unique characteristics of options allow market participants to exploit price volatility, market inefficiencies, and changing investor sentiment.
2.1. Directional Opportunities
Traders can use options to profit from price movements in underlying assets:
Bullish Outlook: Buying call options allows traders to benefit from rising stock prices with limited risk.
Bearish Outlook: Buying put options provides an opportunity to profit from falling prices without short-selling.
Example: If a stock trading at ₹1,500 is expected to rise to ₹1,650 in two months, a trader could buy a call option with a strike price of ₹1,520. The profit potential is theoretically unlimited, while the maximum loss is limited to the premium paid.
2.2. Hedging Opportunities
Options provide risk mitigation for portfolios, protecting against adverse price movements:
Protective Puts: Investors holding stocks can buy put options to hedge against potential declines.
Covered Calls: Investors owning shares can sell call options to generate income, reducing portfolio volatility.
Example: An investor holding 100 shares of a stock priced at ₹2,000 may buy a put option at a ₹1,950 strike price. If the stock falls to ₹1,800, losses in the stock are offset by gains in the put option.
2.3. Income Generation
Options can be used to generate consistent income through premium collection:
Cash-Secured Puts: Selling put options on stocks an investor wants to acquire can generate premium income.
Covered Call Writing: Selling call options on held stock can earn income while potentially selling the stock at a target price.
2.4. Volatility-Based Opportunities
Options prices are highly sensitive to implied volatility, creating opportunities even when the market direction is uncertain:
Long Straddles: Buying both call and put options at the same strike price allows traders to profit from significant price swings, irrespective of direction.
Long Strangles: Similar to straddles but with different strike prices, strangles are cost-effective strategies for volatile markets.

Part 2 Support and Resistance1. How Option Pricing Works
Option pricing is determined primarily by two components:
1.1 Intrinsic Value
The intrinsic value of an option is the difference between the current market price of the underlying asset and the option’s strike price:
For a call option: Intrinsic Value = Max(0, Current Price – Strike Price)
For a put option: Intrinsic Value = Max(0, Strike Price – Current Price)
1.2 Time Value
The time value accounts for the possibility that the option’s price may increase before expiration. Factors influencing time value include:
Time to Expiry: Longer durations increase the likelihood of profitable movement.
Volatility: Higher volatility increases the potential for price swings, making options more expensive.
Interest Rates and Dividends: These factors can adjust the expected returns of the underlying asset and, consequently, the option premium.
1.3 The Black-Scholes Model
The Black-Scholes model is a widely used formula for estimating theoretical option prices. It considers factors like:
Current stock price
Strike price
Time to expiration
Volatility
Risk-free interest rate
This model forms the foundation of modern option pricing, though practical trading often considers market sentiment and liquidity as well.
2. Types of Option Styles
Options come in several styles, each dictating when the option can be exercised:
American Options: Can be exercised any time before expiration.
European Options: Can only be exercised on the expiration date.
Exotic Options: Include complex derivatives such as barrier options, Asian options, and lookback options, often used by institutional investors.
3. Uses of Options
Option trading serves multiple purposes in financial markets:
3.1 Hedging
Investors use options to protect their portfolios from adverse price movements:
Protective Put: Buying a put option to insure a long stock position.
Covered Call: Selling a call option on a stock already owned to earn additional premium income.
3.2 Speculation
Traders can use options to profit from anticipated price movements without owning the underlying asset:
Buying call options for bullish expectations.
Buying put options for bearish expectations.
Using leverage, a small investment can yield substantial returns if predictions are correct.
3.3 Income Generation
Selling options allows traders to collect premiums regularly:
Cash-Secured Puts: Selling put options while holding enough cash to buy the underlying asset if exercised.
Covered Calls: Generates income by selling calls against owned stock.
3.4 Arbitrage
Institutional traders use options to exploit price discrepancies between markets, combining options and underlying assets for risk-free profits.

Leveraged & Margin Trading1. Understanding Margin and Leverage
1.1. Margin Trading
Margin trading is a practice where traders borrow funds from a broker to trade financial instruments beyond the capital they own. Essentially, the trader puts up a portion of the trade’s value as a “margin,” while the broker provides the remainder.
Initial Margin: The amount a trader must deposit to open a position.
Maintenance Margin: The minimum account balance required to keep the position open. Falling below this can trigger a margin call.
Example:
If an investor wants to buy $10,000 worth of stock but only has $2,000, they can borrow the remaining $8,000 from the broker. Here, $2,000 is the initial margin.
2. How Margin Trading Works
2.1. Opening a Margin Account
Margin trading requires a margin account with a brokerage. Unlike a standard cash account:
Brokers assess creditworthiness and risk tolerance.
Regulatory bodies often impose minimum equity requirements.
Margin accounts allow borrowing for long and short positions.
2.2. Margin Call and Liquidation
A margin call occurs when the trader’s equity falls below the maintenance margin. Brokers demand additional funds or liquidate positions to cover losses.
Example:
Initial equity: $5,000
Maintenance margin: 25%
Position value drops, equity falls below $1,250 → margin call issued.
2.3. Interest and Costs
Borrowing funds incurs interest. Traders must account for:
Daily or monthly interest rates on borrowed funds.
Fees for overnight or extended positions.
Potential hidden costs in leveraged ETFs or derivatives.
3. Types of Leverage and Margin Instruments
3.1. Equity Margin Trading
Allows buying more shares than one can afford.
Popular in stock markets like the NYSE, NSE, and NASDAQ.
Often subject to regulatory limits, e.g., max 2x leverage for retail investors.
3.2. Forex Leverage
Forex brokers often provide high leverage (50:1 to 500:1) due to low volatility per pip.
Extremely high risk due to rapid market movements.
Margin is expressed as a percentage (e.g., 2% margin = 50x leverage).
3.3. Derivatives and Futures
Futures contracts inherently involve leverage.
Traders only deposit a fraction of the contract value as margin.
Profit/loss calculated daily (“mark-to-market”).
3.4. CFD (Contract for Difference) Trading
CFDs let traders speculate on asset price movements without owning the asset.
Leverage is widely used, amplifying gains and losses.
4. Benefits of Leveraged & Margin Trading
Amplified Returns: Small price movements can generate substantial profits.
Capital Efficiency: Traders can deploy limited capital across multiple positions.
Hedging Opportunities: Use leverage to hedge existing portfolios.
Short-Selling: Margin accounts enable profiting from falling markets.
Access to Advanced Markets: Leverage allows participation in markets with high nominal value (commodities, derivatives).
5. Risks and Challenges
5.1. Magnified Losses
Leverage increases exposure to adverse price movements.
Small losses can quickly exceed initial capital, leading to debt.
5.2. Margin Calls and Forced Liquidation
Margin calls can trigger automatic liquidation at unfavorable prices.
Timing and liquidity are critical to avoid catastrophic losses.
5.3. Interest and Fees
Borrowing costs reduce net gains.
Long-term leveraged positions can become expensive.
5.4. Psychological Pressure
High leverage induces stress, emotional trading, and overconfidence.
Traders may exit positions prematurely or double down recklessly.
6. Strategies in Leveraged & Margin Trading
6.1. Trend Following
Use leverage to maximize profits in strong trending markets.
Combine technical analysis, moving averages, and momentum indicators.
6.2. Scalping and Intraday Trading
Small positions with tight stop-losses reduce exposure.
High-frequency trades magnified through margin can yield substantial intraday gains.
6.3. Hedging and Portfolio Protection
Leveraged instruments hedge existing investments.
Options and futures contracts allow downside protection.
6.4. Swing Trading
Capture medium-term price swings.
Leverage allows traders to scale positions while maintaining capital efficiency.
7. Risk Management in Leveraged Trading
7.1. Setting Stop-Loss Orders
Essential to limit downside.
Automated stop-losses prevent emotional decision-making.
7.2. Position Sizing
Calculate leverage based on volatility and account size.
Avoid risking more than a small percentage of total capital per trade.
7.3. Diversification
Spread exposure across multiple assets.
Reduces risk of catastrophic losses from a single position.
7.4. Monitoring Margin Levels
Keep track of maintenance margin requirements.
Avoid last-minute margin calls by maintaining buffer equity.
8. Regulatory and Ethical Considerations
Regulators impose limits on retail leverage to protect investors.
Brokers must disclose risks clearly.
Leveraged trading carries ethical responsibility—reckless use can lead to systemic market instability.
9. Practical Examples
9.1. Stock Margin Trade
Buy 500 shares at $50 each = $25,000
Own capital: $5,000
Borrowed: $20,000 (5:1 leverage)
Scenario A: Price rises 10% → $27,500 value
Profit = $2,500 → 50% return on own capital
Scenario B: Price falls 10% → $22,500 value
Loss = $2,500 → 50% loss on own capital, risk of margin call
9.2. Forex Leverage
EUR/USD position: $100,000
Own capital: $2,000 → 50:1 leverage
100 pips movement → profit/loss = $1,000 (50% of equity)
9.3. Futures Contracts
Oil futures: 1 contract = 1,000 barrels, $80/barrel → $80,000
Margin: 10% → $8,000 deposit
Price increase to $85 → $5,000 profit → 62.5% return on margin
10. Psychological Aspects
Leverage magnifies emotions: greed, fear, and overconfidence.
Discipline is crucial—traders must stick to pre-defined risk strategies.
Education and simulation trading can build confidence before risking real capital.
11. Leveraged ETFs
Exchange-Traded Funds designed to multiply returns of an underlying index.
Examples: 2x or 3x daily returns of S&P 500.
Ideal for short-term strategies; long-term holding can lead to compounding decay.
12. Leveraged Trading in Crypto Markets
Cryptocurrency exchanges offer extreme leverage (up to 100x).
High volatility makes margin calls frequent.
Traders must combine technical analysis, position sizing, and stop-losses rigorously.
13. Common Misconceptions
Leverage guarantees profit: False—losses are amplified too.
Higher leverage = better returns: False—risk management is more important than high leverage.
Margin trading is only for experts: False—but education is crucial.
14. Best Practices
Always calculate maximum potential loss before opening positions.
Use leverage conservatively, especially in volatile markets.
Diversify trades across assets and strategies.
Keep an emergency equity buffer to avoid forced liquidation.
Continuously review and adjust risk exposure.
15. Conclusion
Leveraged and margin trading are potent tools in modern financial markets. They provide opportunities to magnify returns, access sophisticated trading strategies, and enhance portfolio efficiency. However, they come with inherent risks: magnified losses, margin calls, psychological stress, and the potential for total capital erosion.
Success in leveraged trading depends on education, risk management, discipline, and strategic execution. Understanding the mechanics of margin accounts, leverage ratios, and market dynamics is essential. When used prudently, leverage can be a powerful ally; when mismanaged, it can become a trader’s downfall.
In essence, leveraged and margin trading are not merely about borrowing money—they are about amplifying strategic thinking, market insights, and disciplined execution. Traders who respect both the power and the peril of leverage are often those who succeed in the long run.

Geopolitical Risks and Their Impact on Global MarketsIntroduction
Geopolitical risks encompass a broad spectrum of political, economic, and military events that can disrupt the global economic landscape. These risks, ranging from armed conflicts and trade wars to policy shifts and regime changes, have profound implications for financial markets, investment strategies, and economic stability. Understanding the nature of these risks and their potential impacts is crucial for investors, policymakers, and businesses operating in an increasingly interconnected world.
1. Nature and Sources of Geopolitical Risks
Geopolitical risks arise from various sources, each with unique characteristics and potential consequences:
Armed Conflicts and Wars: Military engagements, such as the ongoing Russia-Ukraine conflict, can lead to significant disruptions in global supply chains, especially in energy and commodities markets. For instance, attacks on critical infrastructure can cause immediate price spikes and long-term supply shortages.
Trade Wars and Sanctions: Economic measures like tariffs, export controls, and sanctions can alter trade flows and affect the profitability of multinational corporations. The U.S.-China trade tensions are a prime example, influencing global supply chains and market sentiments.
Political Instability and Regime Changes: Shifts in political power, especially in key economies, can lead to policy uncertainties that affect investor confidence and market stability. Changes in leadership can result in abrupt policy shifts, impacting sectors such as energy, finance, and technology.
Cybersecurity Threats: Increasing reliance on digital infrastructure makes economies vulnerable to cyberattacks, which can disrupt financial systems, trade, and national security.
Environmental and Resource Conflicts: Competition for scarce resources, exacerbated by climate change, can lead to geopolitical tensions, particularly in regions dependent on natural resources.
2. Mechanisms of Market Impact
Geopolitical events influence markets through several channels:
Market Volatility: Uncertainty surrounding geopolitical events can lead to increased volatility in stock and bond markets. Investors often react swiftly to news, leading to sharp price movements.
Commodity Price Fluctuations: Conflicts in resource-rich regions can disrupt supply chains, leading to price increases in commodities like oil, gas, and metals. For example, tensions in the Middle East often result in spikes in oil prices due to concerns over supply disruptions.
Currency Instability: Geopolitical risks can affect investor confidence in a country's currency, leading to depreciation or volatility. Countries directly involved in conflicts may see their currencies weaken due to capital outflows.
Capital Flows and Investment Patterns: Heightened risks can lead to shifts in investment strategies, with investors seeking safe-haven assets like gold, government bonds, or stable currencies. Emerging markets may experience capital outflows as investors seek safer investments.
Supply Chain Disruptions: Conflicts and trade restrictions can interrupt the flow of goods and services, leading to shortages and increased costs for businesses and consumers.
3. Case Studies of Geopolitical Events and Market Reactions
Russia-Ukraine Conflict: The invasion of Ukraine by Russia in 2022 led to significant disruptions in global energy markets. Sanctions imposed on Russia resulted in soaring oil and gas prices, affecting global inflation rates and energy security.
U.S.-China Trade War: The imposition of tariffs between the U.S. and China in 2018-2019 disrupted global supply chains, affecting industries from electronics to agriculture. Markets experienced heightened volatility as investors adjusted to the changing trade landscape.
Brexit: The United Kingdom's decision to leave the European Union introduced uncertainties regarding trade agreements, regulatory standards, and economic relations, leading to fluctuations in the British pound and stock market volatility.
Middle East Tensions: Periodic conflicts and tensions in the Middle East, particularly involving Iran, have led to spikes in oil prices due to concerns over supply disruptions, impacting global markets.
4. Quantifying Geopolitical Risk
Measuring geopolitical risk is challenging due to its multifaceted nature. However, several indices and models have been developed to assess and quantify these risks:
Geopolitical Risk Index (GPR): Developed by Caldara and Iacoviello (2022), this index quantifies geopolitical tensions based on news coverage and policy uncertainty. It provides a historical perspective on the frequency and intensity of geopolitical events.
BlackRock Geopolitical Risk Indicator (BGRI): This indicator tracks market attention to geopolitical risks by analyzing brokerage reports and financial news stories. It helps investors gauge the level of concern in the market regarding specific geopolitical events.
Market-Driven Scenarios (MDS): Employed by institutions like BlackRock, MDS frameworks estimate the potential impact of geopolitical events on global assets by analyzing historical parallels and expert insights.
5. Investor Strategies in the Face of Geopolitical Risks
Investors can adopt several strategies to mitigate the impact of geopolitical risks:
Diversification: Spreading investments across various asset classes, sectors, and geographies can reduce exposure to specific geopolitical events.
Hedging: Utilizing financial instruments like options, futures, and currency swaps can help protect portfolios from adverse market movements.
Focus on Fundamentals: Investing in companies with strong fundamentals, such as robust balance sheets and resilient business models, can provide stability during turbulent times.
Monitoring Geopolitical Developments: Staying informed about global events and understanding their potential implications can help investors make timely and informed decisions.
Scenario Planning: Developing and regularly updating risk scenarios can prepare investors for potential geopolitical shocks and guide strategic responses.
6. Implications for Policymakers and Businesses
Policymakers and businesses must recognize the significance of geopolitical risks and take proactive measures:
Policy Formulation: Governments should develop policies that enhance economic resilience, promote diversification, and reduce dependence on volatile regions.
Crisis Management Plans: Establishing frameworks to respond to geopolitical crises can help mitigate their impact on national security and economic stability.
Public-Private Collaboration: Cooperation between governments and businesses can lead to more effective risk management strategies and resource allocation during crises.
Investment in Technology and Infrastructure: Strengthening digital infrastructure and cybersecurity can reduce vulnerabilities to cyber threats and enhance economic resilience.
Conclusion
Geopolitical risks are an inherent aspect of the global economic landscape, with the potential to influence markets, investment strategies, and economic policies. While these risks cannot be entirely eliminated, understanding their sources, mechanisms, and potential impacts allows investors, businesses, and policymakers to develop strategies to mitigate their effects. By adopting proactive risk management approaches and staying informed about global developments, stakeholders can navigate the complexities of geopolitical risks and maintain stability in an interconnected world.
Futures & Hedging Techniques1. Understanding Futures Contracts
1.1 Definition and Basics
A futures contract is a standardized agreement between two parties to buy or sell an underlying asset at a predetermined price on a specific future date. Futures are traded on regulated exchanges and cover a wide range of assets, including commodities (oil, gold, wheat), financial instruments (bonds, stock indices), and currencies.
Key characteristics:
Standardization: Contract size, expiration date, and quality of the underlying asset are predefined.
Leverage: Futures allow traders to control a large position with a relatively small margin, magnifying both gains and losses.
Obligation: Unlike options, both parties are obligated to fulfill the contract unless it is closed before expiration.
1.2 Types of Futures Contracts
Futures contracts can be broadly classified into:
Commodity Futures: Contracts for physical goods like crude oil, natural gas, metals, or agricultural products.
Financial Futures: Contracts based on financial instruments such as stock indices (e.g., S&P 500), government bonds, or currencies.
Currency Futures: Agreements to exchange a specific amount of one currency for another at a future date.
Interest Rate Futures: Contracts based on the future level of interest rates, often used to hedge bond positions.
2. The Concept of Hedging
2.1 What is Hedging?
Hedging is a risk management strategy used to offset potential losses in an investment by taking an opposite position in a related asset. It acts as a financial "insurance policy," protecting against price volatility.
Example:
A wheat farmer expects to harvest 10,000 bushels in three months. To protect against a price drop, he sells wheat futures. If prices fall, gains from the futures contract offset losses in the cash market.
2.2 Hedging vs. Speculation
Hedgers: Aim to reduce risk and protect profit margins.
Speculators: Take on risk to profit from price movements.
Hedgers use futures primarily, while speculators are attracted to leverage and profit potential.
3. Hedging Techniques
3.1 Long Hedge
A long hedge is used when an investor or business anticipates purchasing an asset in the future and wants to protect against price increases. It involves buying futures contracts.
Example:
An airline company expects to buy jet fuel in three months. To hedge against rising fuel prices, it buys fuel futures. If fuel prices increase, gains from the futures offset higher cash market costs.
3.2 Short Hedge
A short hedge is applied when the investor or business owns the asset and wants protection against price declines. It involves selling futures contracts.
Example:
A farmer expecting to sell corn in six months may sell corn futures. If market prices drop, gains from futures contracts compensate for lower cash sales prices.
3.3 Cross Hedging
Cross hedging occurs when the exact underlying asset is not available for hedging, so a related asset's futures contract is used. This method carries basis risk, as the hedge may not perfectly offset price changes.
Example:
A steel manufacturer might use iron ore futures to hedge against steel price fluctuations when no steel futures are available.
3.4 Rolling Hedges
Futures contracts have expiration dates. To maintain continuous hedging, traders roll over contracts from a near-month to a later-month contract, locking in protection over a longer horizon.
4. Advanced Hedging Strategies
4.1 Delta Hedging
Primarily used in options trading, delta hedging involves adjusting positions to remain neutral against price movements of the underlying asset. Though complex, it can minimize directional risk.
4.2 Ratio Hedging
This involves using a proportionate number of futures contracts to hedge a position. Over-hedging or under-hedging can be applied based on risk appetite.
4.3 Hedging with Options on Futures
Options provide asymmetric protection:
Buying put options hedges against price declines.
Buying call options hedges against price increases.
This approach limits losses while retaining upside potential.
5. Real-World Applications of Futures and Hedging
5.1 Commodities
Agriculture: Farmers hedge crops to lock in prices and stabilize income.
Energy: Airlines and utilities hedge oil, gas, and electricity prices to manage operational costs.
Metals: Industrial manufacturers hedge metals like copper and aluminum to control production expenses.
5.2 Financial Markets
Equities: Portfolio managers hedge against market downturns using index futures.
Interest Rates: Banks hedge bond portfolios against interest rate fluctuations using Treasury futures.
Currency Exposure: Multinational companies hedge foreign currency transactions to mitigate exchange rate risk.
5.3 Corporate Finance
Corporations employ hedging to:
Protect profit margins.
Secure predictable cash flows.
Reduce volatility in earnings reports.
6. Advantages and Limitations
6.1 Advantages
Risk Management: Reduces exposure to adverse price movements.
Liquidity: Futures markets are highly liquid.
Price Discovery: Transparent pricing aids decision-making.
Standardization: Contracts are uniform and regulated.
6.2 Limitations
Basis Risk: Imperfect hedging can leave residual risk.
Margin Calls: Leverage can lead to unexpected losses.
Market Volatility: Extreme events may cause margin strain.
Complexity: Advanced hedging requires financial expertise.
7. Practical Tips for Effective Hedging
Identify Exposures: Determine what risks need hedging—commodity prices, interest rates, currencies.
Choose the Right Instrument: Use futures, options, or combinations to optimize coverage.
Calculate Hedge Ratios: Apply statistical methods for precision.
Monitor Positions: Markets are dynamic; regular evaluation is critical.
Understand Costs: Consider transaction costs, margin requirements, and potential losses.
8. Case Studies
Case Study 1: Airline Fuel Hedge
A major airline facing volatile fuel prices purchased crude oil futures. When prices surged 12% in three months, the gains from futures offset the higher fuel costs, stabilizing operational expenses.
Case Study 2: Wheat Farmer
A farmer expecting to sell wheat in 90 days sold futures contracts. Prices fell by 8%, but the futures gain neutralized losses, ensuring predictable revenue.
Case Study 3: Multinational Corporation
A tech firm receiving payments in euros hedged using currency futures. Adverse EUR/USD fluctuations could have reduced earnings, but gains from futures mitigated the impact.
9. Emerging Trends in Futures and Hedging
Algorithmic Hedging: AI and quantitative models optimize hedge ratios in real-time.
ESG Hedging: Companies hedge exposure to carbon credits or renewable energy costs.
Cryptocurrency Futures: Digital assets now offer hedging tools for crypto portfolios.
Globalization: Increasing cross-border trade creates diverse hedging needs in multiple currencies and commodities.
10. Conclusion
Futures and hedging techniques are indispensable tools in modern finance. They allow market participants to manage risk, protect profits, and plan for uncertainties. While futures provide standardized, leveraged instruments for price speculation and risk management, hedging techniques enable businesses and investors to achieve stability amid market volatility.
Mastering these concepts requires a combination of theoretical knowledge, practical experience, and an understanding of market behavior. With careful planning, risk assessment, and strategy execution, futures and hedging can transform uncertainty into a manageable, predictable component of financial decision-making.

High-Frequency Trading (HFT)1. The Evolution of Trading Technology
1.1 From Manual to Electronic Trading
Before HFT, financial markets relied primarily on human traders, floor brokers, and telephonic transactions. Orders were manually placed, reviewed, and executed—a process that was time-consuming and prone to errors.
The 1980s and 1990s witnessed a revolution in trading technology with the emergence of electronic trading platforms. Nasdaq became one of the first fully electronic markets, offering automated order execution, real-time price quotes, and faster transaction speeds. This shift laid the groundwork for algorithmic trading and, eventually, HFT.
1.2 Algorithmic Trading
Algorithmic trading refers to using pre-programmed instructions to execute trades based on market data. Algorithms can react to price movements, volumes, and news faster than any human. HFT is essentially an extreme form of algorithmic trading where execution speed is the primary advantage.
2. Core Characteristics of High-Frequency Trading
HFT differs from conventional trading in several key aspects:
2.1 Ultra-Low Latency
Latency is the time delay between market data reception and order execution. HFT firms invest heavily in technology to reduce latency to microseconds. They co-locate their servers near exchange data centers to gain nanoseconds in execution speed.
2.2 Massive Order Volumes
HFT strategies often involve placing thousands to millions of orders daily. Most orders are canceled within fractions of a second, a practice called “order-to-trade ratio management.”
2.3 Short Holding Periods
HFT trades rarely hold positions longer than a few seconds. Some strategies may close trades in milliseconds. Profits rely on exploiting tiny price discrepancies that exist only briefly.
2.4 Reliance on Market Data
HFT depends on real-time market data, including order books, trade histories, and economic news. Algorithms analyze this data continuously to identify patterns and opportunities invisible to human traders.
3. High-Frequency Trading Strategies
HFT strategies can be broadly categorized based on their objectives and techniques.
3.1 Market Making
Market-making HFT firms provide liquidity by continuously quoting bid and ask prices. They profit from the bid-ask spread, earning small but frequent gains on each trade. Their activity reduces price volatility and enhances market efficiency.
3.2 Statistical Arbitrage
Statistical arbitrage involves exploiting price inefficiencies across related assets. For instance, HFT algorithms may detect mispricings between futures and underlying stocks, executing trades that profit when the discrepancy corrects.
3.3 Event-Driven Strategies
Event-driven HFT reacts to news events, economic data releases, or corporate announcements. Algorithms scan news feeds and social media in real time, executing trades within microseconds of market-moving information.
3.4 Momentum Ignition
Some HFT strategies attempt to trigger rapid price movements by placing a series of orders designed to provoke reactions from other traders. This technique is controversial and often falls under regulatory scrutiny.
3.5 Latency Arbitrage
Latency arbitrage exploits time differences in price reporting between different exchanges. Firms can buy an asset on one exchange and sell it milliseconds later on another where the price has not yet adjusted.
4. Technological Infrastructure
HFT requires cutting-edge technology. Firms invest millions in the following areas:
4.1 Hardware
Ultra-Fast Servers: HFT firms use servers with high processing power to minimize computation time.
FPGAs (Field-Programmable Gate Arrays): Custom hardware accelerates data processing, reducing latency.
High-Speed Networking: Direct fiber-optic lines and microwave communication are employed to reduce transmission time between exchanges.
4.2 Software
Low-Latency Algorithms: Optimized to execute in microseconds.
Real-Time Analytics: Processes incoming market data instantly to make trade decisions.
Risk Management Systems: Monitor exposures, automatically adjusting or canceling orders to prevent significant losses.
4.3 Co-Location
Many exchanges offer co-location services, allowing HFT servers to be physically close to exchange servers. Proximity can reduce latency by fractions of a millisecond, which is crucial in a speed-sensitive environment.
5. Market Impact
5.1 Liquidity Enhancement
HFT provides liquidity by constantly placing buy and sell orders, reducing spreads and improving market depth. This allows other market participants to execute trades more efficiently.
5.2 Price Discovery
HFT accelerates the incorporation of new information into asset prices. By rapidly reacting to market signals, HFT helps markets reflect underlying values more accurately.
5.3 Volatility Concerns
Critics argue that HFT can exacerbate market volatility. During periods of market stress, algorithms may simultaneously withdraw liquidity, leading to flash crashes or sudden price swings.
5.4 Unequal Playing Field
HFT firms enjoy advantages unavailable to retail traders, including co-location, proprietary data feeds, and ultra-fast hardware. Critics contend that this undermines market fairness.
6. Regulation of High-Frequency Trading
Global regulators have increasingly focused on HFT due to its complexity and potential risks. Key regulatory measures include:
6.1 Market Surveillance
Exchanges and regulators monitor HFT activity to detect manipulative practices, such as quote stuffing (placing excessive orders to slow down competitors) and spoofing (placing orders with no intent to execute).
6.2 Minimum Resting Times
Some markets have introduced minimum order resting times, requiring orders to remain on the book for a short period to reduce excessive cancellations.
6.3 Trade Reporting and Transparency
Regulators require HFT firms to provide detailed trade reporting, ensuring oversight and traceability of rapid trading activity.
7. Advantages and Criticisms
7.1 Advantages
Increased Liquidity: HFT enhances market efficiency by providing continuous buy and sell orders.
Lower Spreads: Narrow bid-ask spreads benefit all market participants.
Efficient Price Discovery: Speeds up reflection of information in market prices.
Innovation in Trading Technology: Drives advancements in software and hardware.
7.2 Criticisms
Market Manipulation Risk: Certain strategies can manipulate prices temporarily.
Systemic Risk: Highly automated systems can exacerbate crashes.
Unequal Access: Retail traders cannot compete on speed or technology.
Short-Term Focus: HFT focuses on minuscule, fleeting opportunities rather than long-term value creation.
8. Case Studies and Notable Events
8.1 The Flash Crash of 2010
On May 6, 2010, U.S. stock markets experienced a sudden, dramatic drop, with the Dow Jones falling nearly 1,000 points in minutes. HFT algorithms amplified the crash by rapidly selling and withdrawing liquidity, illustrating the risks of ultra-fast trading.
8.2 HFT in Global Markets
HFT is not limited to U.S. exchanges. European and Asian markets have also witnessed significant HFT activity, with local regulations adapting to manage associated risks. In some regions, HFT has contributed positively to liquidity and price efficiency, demonstrating the dual nature of its impact.
9. The Future of High-Frequency Trading
9.1 Technological Advancements
HFT will continue to evolve with innovations such as quantum computing, AI-driven predictive analytics, and next-generation networking technologies. These may further reduce latency and enhance decision-making.
9.2 Regulation and Ethical Considerations
Regulators will likely impose stricter rules to prevent systemic risk and maintain fairness. The industry may need to balance speed-driven profits with broader market stability.
9.3 Integration with Other Trading Forms
HFT may increasingly interact with other forms of algorithmic trading, including options, futures, and cryptocurrency markets, creating complex, interconnected trading ecosystems.
Conclusion
High-Frequency Trading represents a pinnacle of technological integration into financial markets. It has reshaped the landscape, providing liquidity, speeding up price discovery, and introducing new risks. While it benefits markets in terms of efficiency and narrower spreads, it also raises concerns about fairness, volatility, and systemic risk. Understanding HFT requires recognizing its dual nature: a tool of innovation and speed that must be managed carefully to prevent unintended consequences.
As global markets become more interconnected, HFT will remain a critical area of study for traders, regulators, and technologists alike. Its future will be defined by the interplay between technological innovation, market dynamics, and regulatory oversight.
Part 8 Trading Master Class1. Introduction to Option Trading
Financial markets are constantly evolving, offering traders and investors a wide variety of tools to manage risk, speculate on price movements, or generate income. One of the most fascinating and versatile financial instruments is the option.
Unlike buying a share of a company directly, which gives you ownership, an option gives you rights, not obligations. This small distinction makes options powerful. They can amplify profits, reduce risks, and allow traders to play multiple angles of the market.
Option trading might sound complicated at first, but once you understand the foundation, it’s like learning a new language – everything starts connecting.
2. The Basics: What Are Options?
An option is a contract between two parties – a buyer and a seller – that gives the buyer the right, but not the obligation, to buy or sell an underlying asset at a predetermined price within a set time frame.
The underlying asset could be a stock, an index, a commodity (like gold or crude oil), or even currencies.
The predetermined price is called the strike price.
The time frame is defined by the expiry date.
In simple words:
Options are like a reservation ticket. You pay a small amount now (premium) to lock in the ability to buy/sell later, but you don’t have to use it if you don’t want to.
3. Types of Options: Call and Put
There are two main types:
Call Option: Gives the buyer the right to buy the underlying asset at the strike price.
Example: You buy a call option for Reliance at ₹2500. If Reliance goes to ₹2700, you can still buy it at ₹2500, making profit.
Put Option: Gives the buyer the right to sell the underlying asset at the strike price.
Example: You buy a put option for Infosys at ₹1500. If Infosys falls to ₹1300, you can still sell it at ₹1500.
Think of calls as a bet on prices going up, and puts as a bet on prices going down.
4. Key Terminologies in Options
To understand option trading, you must master its unique vocabulary:
Strike Price: The pre-agreed price at which you can buy/sell the underlying.
Expiry Date: The date on which the option contract expires.
Premium: The price you pay to buy the option.
In-the-Money (ITM): Option has intrinsic value. (E.g., stock is above strike for calls, below strike for puts).
Out-of-the-Money (OTM): Option has no intrinsic value.
At-the-Money (ATM): Stock price and strike price are nearly the same.
Option Writer: The seller of the option, who takes the opposite side.
Lot Size: The minimum quantity you can trade in an option contract.

Part 7 Trading Master Class1. Introduction to Options Trading
Options trading is one of the most versatile and complex areas of financial markets. It offers traders and investors the ability to hedge, speculate, or generate income. Unlike stocks, which represent ownership in a company, options are financial contracts giving the buyer the right, but not the obligation, to buy or sell an underlying asset at a predetermined price within a specified time frame.
Options are derivatives, meaning their value derives from an underlying asset such as equities, indices, commodities, or currencies. They are widely used by institutional traders, retail investors, and hedgers to manage risk and leverage positions efficiently.
2. Types of Options
There are two primary types of options:
Call Options
Gives the holder the right to buy an underlying asset at a specified price (strike price) before or on the expiry date.
Used by traders who expect the price of the asset to rise.
Put Options
Gives the holder the right to sell an underlying asset at a specified price before or on expiry.
Used by traders who expect the price of the asset to fall.
Key Terms in Options Trading
Strike Price (Exercise Price): The predetermined price at which the asset can be bought or sold.
Expiry Date: The date by which the option must be exercised.
Premium: The cost of buying the option.
Intrinsic Value: The actual value if exercised immediately (difference between market price and strike price).
Time Value: Extra value reflecting the possibility of future price movement before expiry.
3. How Options Work
Options can be exercised in two styles:
American Style Options: Can be exercised anytime before expiry.
European Style Options: Can only be exercised on the expiry date.
Example:
You buy a call option for stock XYZ with a strike price of ₹1,000, expiring in 1 month.
Current market price is ₹1,050, and the premium paid is ₹50.
If the stock rises to ₹1,200, you can exercise the option and make a profit:
Profit = (Stock Price − Strike Price − Premium) = 1,200 − 1,000 − 50 = ₹150 per share.

Part 6 Learn Institutional Trading 1. Introduction to Options Trading
Options trading is one of the most versatile and complex areas of financial markets. It offers traders and investors the ability to hedge, speculate, or generate income. Unlike stocks, which represent ownership in a company, options are financial contracts giving the buyer the right, but not the obligation, to buy or sell an underlying asset at a predetermined price within a specified time frame.
Options are derivatives, meaning their value derives from an underlying asset such as equities, indices, commodities, or currencies. They are widely used by institutional traders, retail investors, and hedgers to manage risk and leverage positions efficiently.
2. Types of Options
There are two primary types of options:
Call Options
Gives the holder the right to buy an underlying asset at a specified price (strike price) before or on the expiry date.
Used by traders who expect the price of the asset to rise.
Put Options
Gives the holder the right to sell an underlying asset at a specified price before or on expiry.
Used by traders who expect the price of the asset to fall.
Key Terms in Options Trading
Strike Price (Exercise Price): The predetermined price at which the asset can be bought or sold.
Expiry Date: The date by which the option must be exercised.
Premium: The cost of buying the option.
Intrinsic Value: The actual value if exercised immediately (difference between market price and strike price).
Time Value: Extra value reflecting the possibility of future price movement before expiry.
3. How Options Work
Options can be exercised in two styles:
American Style Options: Can be exercised anytime before expiry.
European Style Options: Can only be exercised on the expiry date.
Example:
You buy a call option for stock XYZ with a strike price of ₹1,000, expiring in 1 month.
Current market price is ₹1,050, and the premium paid is ₹50.
If the stock rises to ₹1,200, you can exercise the option and make a profit:
Profit = (Stock Price − Strike Price − Premium) = 1,200 − 1,000 − 50 = ₹150 per share.

Part 4 Learn Institutional Trading1. Uses of Options
Options trading is not just speculation; it serves multiple purposes:
Hedging (Risk Management):
Investors use options to protect against unfavorable price movements.
Example: A stock investor buys a put option to limit losses if the stock price drops.
Speculation:
Traders use options to bet on price direction with limited capital and potentially high returns.
Income Generation:
Selling options (writing calls or puts) can generate consistent income through premiums.
Covered calls are a popular income strategy where you hold the stock and sell a call option against it.
Arbitrage Opportunities:
Advanced traders exploit mispricing between options and underlying assets to make risk-free profits.
2. Option Strategies
Options provide flexibility through a variety of strategies, which range from simple to highly complex:
Basic Strategies
Long Call: Buy call option anticipating price increase.
Long Put: Buy put option anticipating price decrease.
Covered Call: Hold stock and sell a call to earn premium.
Protective Put: Buy a put for stock you own to limit downside risk.
Intermediate Strategies
Straddle: Buy call and put at the same strike and expiry to profit from volatility.
Strangle: Buy call and put with different strikes to benefit from large price moves.
Bull Spread: Combine two calls (different strikes) to profit from moderate upward movement.
Bear Spread: Combine two puts to profit from moderate downward movement.
Advanced Strategies
Butterfly Spread: Limit risk and reward for minimal cost, suitable for low volatility expectations.
Iron Condor: Sell an out-of-the-money call and put while buying further out-of-the-money options to cap risk.
Calendar Spread: Exploit differences in time decay by trading options with the same strike but different expiries.
3. Greeks in Options Trading
Options traders use Greeks to measure sensitivity of option prices to different variables:
Delta: Measures price change in option relative to underlying asset.
Gamma: Measures change in delta as asset price changes.
Theta: Measures time decay of the option’s premium.
Vega: Measures sensitivity to volatility.
Rho: Measures sensitivity to interest rates.
Understanding Greeks helps traders manage risk, hedge positions, and optimize strategies.
4. Risks in Options Trading
Options trading carries significant risk, especially for sellers/writers:
For Buyers:
Risk limited to premium paid.
Potential for total loss if option expires worthless.
For Sellers:
Risk can be unlimited for uncovered (naked) options.
Margin requirements can be high.
Time Decay Risk:
Options lose value as expiry approaches, especially OTM options.
Volatility Risk:
Unexpected changes in market volatility can affect option premiums dramatically.
Proper risk management, position sizing, and understanding of market conditions are crucial.
5. Practical Tips for Options Trading
Start Small: Begin with a few contracts until you understand mechanics and risk.
Focus on Liquid Options: Trade options with high volume to ensure tight spreads and easy entry/exit.
Use Stop-Loss: Protect capital by predefining risk limits.
Understand Time Decay: Avoid holding OTM options for too long without movement in underlying.
Diversify Strategies: Combine hedging, speculation, and income strategies.

Part 2 Ride The Big MovesHow Options Work
Options trading works through a combination of buying and selling call and put contracts. Here's an example:
Suppose you buy a call option for a stock currently trading at ₹1,000, with a strike price of ₹1,050, expiring in one month. You pay a premium of ₹20. If the stock rises to ₹1,100:
You can exercise the option to buy the stock at ₹1,050 and sell it at ₹1,100, making a profit of ₹50 per share minus the ₹20 premium, resulting in a net gain of ₹30 per share.
If the stock price stays below ₹1,050, the option expires worthless, and your loss is limited to the premium paid (₹20).
Similarly, with a put option, if the stock falls below the strike price, you can sell it at the higher strike price, profiting from the difference.
Advantages of Options Trading
Leverage: Options allow traders to control a large position with a relatively small investment, magnifying potential profits.
Risk Management: Investors use options to hedge against unfavorable price movements in their portfolios. For instance, buying put options on a stock you own can protect against a decline in its price.
Flexibility: Options provide various strategies to profit from upward, downward, or even sideways movements in the market.
Income Generation: Writing options, especially covered calls, can generate additional income from an existing portfolio.
Risks of Options Trading
Despite their advantages, options come with risks:
Limited Time: Options expire, so timing is crucial. An option can lose all its value if the underlying asset doesn’t move as anticipated before expiration.
Complexity: Options strategies, especially involving multiple legs (like spreads, straddles, and butterflies), can be complex and require careful planning.
Leverage Risk: While leverage can amplify profits, it also magnifies losses. A wrong bet can lead to losing the entire premium or more if you’re selling options.
Popular Options Strategies
Options traders use various strategies depending on market outlook and risk tolerance:
Covered Call: Selling a call option on a stock you already own to earn premium income.
Protective Put: Buying a put option on a stock you own to guard against downside risk.
Straddle: Buying a call and put option with the same strike price and expiration to profit from volatility in either direction.
Spread Strategies: Combining multiple options to limit risk while maintaining profit potential, such as bull spreads or bear spreads.

Part 1 Ride The Big MovesIntroduction to Options Trading
Options trading is a dynamic segment of the financial markets that allows investors to hedge risk, speculate on price movements, and enhance returns. Unlike stocks, which represent ownership in a company, options are financial derivatives—contracts whose value is derived from an underlying asset, such as stocks, indices, commodities, or currencies. By offering flexibility and leverage, options have become a popular tool for both professional traders and retail investors.
What Are Options?
An option is a contract that gives the buyer the right—but not the obligation—to buy or sell an underlying asset at a predetermined price, called the strike price, before or on a specific date known as the expiration date. The seller, or writer, of the option has the obligation to fulfill the contract if the buyer chooses to exercise it.
There are two main types of options:
Call Options – These give the holder the right to buy the underlying asset at the strike price. Investors purchase call options when they expect the price of the underlying asset to rise.
Put Options – These give the holder the right to sell the underlying asset at the strike price. Investors buy put options when they expect the price of the underlying asset to fall.
Key Terms in Options Trading
Understanding options requires familiarity with some key concepts:
Premium: The price paid by the buyer to the seller for the option. This is influenced by factors like the underlying asset price, strike price, time to expiration, volatility, and interest rates.
Strike Price: The price at which the buyer can buy (call) or sell (put) the underlying asset.
Expiration Date: The date on which the option expires. After this, the option becomes worthless if not exercised.
In-the-Money (ITM): A call option is ITM if the underlying price is above the strike price, and a put option is ITM if the underlying price is below the strike price.
Out-of-the-Money (OTM): A call option is OTM if the underlying price is below the strike price, and a put option is OTM if it’s above the strike price.
At-the-Money (ATM): When the underlying price is equal to the strike price.

Risk-Free Trading and Strategies1. Understanding Risk and the Risk-Free Concept
1.1 Definition of Risk in Trading
In trading, risk is defined as the probability of losing part or all of the invested capital due to market fluctuations. Market risks arise from several sources:
Price Risk: The chance that asset prices move against the trader’s position.
Interest Rate Risk: Fluctuations in interest rates affecting bond prices or currency valuations.
Liquidity Risk: Difficulty in executing a trade without impacting the asset’s price.
Counterparty Risk: The risk that the other party in a financial transaction may default.
1.2 The Risk-Free Rate
The risk-free rate is a foundational concept in finance. It represents the theoretical return an investor would receive from an investment with zero risk of financial loss. Government-issued securities, such as U.S. Treasury bills or Indian Government Bonds, are commonly used as proxies for risk-free assets because the probability of default is extremely low. All other investments are measured relative to this baseline using risk premiums, which compensate investors for taking additional risk.
1.3 The Myth of “Risk-Free Trading”
It is crucial to acknowledge that true risk-free trading does not exist in speculative markets. Even sophisticated strategies designed to minimize risk can fail due to unexpected market conditions, operational errors, or systemic shocks. However, financial markets offer near risk-free opportunities, often through arbitrage, hedging, or government-backed instruments.
2. Theoretical Foundations of Risk-Free Trading
2.1 Arbitrage Theory
Arbitrage is a cornerstone of risk-free trading. Arbitrage involves buying and selling the same asset simultaneously in different markets to profit from price discrepancies. Theoretically, arbitrage is considered “risk-free” because it exploits mispricing rather than market direction.
Example:
Suppose a stock trades at ₹100 on the National Stock Exchange (NSE) in India and $1.25 equivalent on an international exchange. A trader can:
Buy the cheaper stock in India.
Sell the same stock in the international market.
Lock in a risk-free profit equal to the price difference after accounting for transaction costs.
While arbitrage appears risk-free, practical execution involves risks, such as transaction delays, market volatility during execution, and high transaction costs.
2.2 Covered Interest Rate Parity
Covered Interest Rate Parity (CIRP) is a near risk-free strategy in the foreign exchange market. It exploits differences in interest rates between two countries while hedging currency risk through forward contracts.
How it Works:
Borrow funds in the currency with a lower interest rate.
Convert the borrowed funds into a higher interest rate currency.
Invest in a risk-free asset in the higher interest rate currency.
Use a forward contract to convert the proceeds back to the original currency at a predetermined rate.
This approach ensures a locked-in return with minimal exposure to currency fluctuations.
2.3 The Role of Hedging
Hedging is another critical element in risk-free trading. Hedging involves taking offsetting positions to reduce or neutralize market risk. Traders use derivatives like options, futures, and swaps to protect their portfolios from adverse price movements.
Common Hedging Strategies:
Protective Put: Buying a put option to limit downside on a stock holding.
Covered Call: Owning a stock while selling a call option to earn premium income while limiting upside.
Delta Neutral Strategy: Combining options and stock positions to minimize sensitivity to price changes.
Hedging reduces risk but does not entirely eliminate it. It is most effective in volatile markets where potential losses can be significant.
3. Practical Risk-Free Trading Strategies
Although no market strategy is entirely risk-free, several practical methods allow traders to approach near-zero risk levels.
3.1 Arbitrage Trading
Arbitrage remains the closest form of “risk-free trading.” Various types exist:
3.1.1 Stock Arbitrage
Exploits price discrepancies of the same stock across different exchanges.
Requires quick execution and sufficient capital.
3.1.2 Triangular Forex Arbitrage
Involves three currencies and takes advantage of discrepancies in cross-exchange rates.
For example, converting USD → EUR → GBP → USD to earn a risk-free profit.
3.1.3 Futures Arbitrage
Exploits the difference between spot and futures prices of the same asset.
Requires precise timing and understanding of carrying costs.
Pros: Low-risk, market-neutral.
Cons: Short-lived opportunities, requires technology and low transaction costs.
3.2 Hedged Trading with Derivatives
Options and futures provide tools for risk mitigation.
Protective Put Strategy:
Buy a put option for a stock already owned.
Limits maximum loss while allowing unlimited upside potential.
Covered Call Strategy:
Hold a stock and sell a call option.
Earn premium income, which offsets potential losses in small downturns.
Example:
Own 100 shares of a company at ₹1,000 each.
Sell a call option with a strike of ₹1,050 for ₹20 premium.
If stock rises above ₹1,050, you sell at ₹1,050 but keep ₹20 premium.
If stock falls, the premium offsets part of the loss.
3.3 Risk-Free Bonds and Government Securities
Investing in government securities is the most straightforward risk-free strategy. Examples include:
Treasury Bills (T-Bills): Short-term government debt with fixed returns.
Government Bonds: Longer-term instruments with predictable interest payments.
Fixed Deposits (FDs): Bank-backed deposits with guaranteed returns.
Pros: Extremely low risk and predictable returns.
Cons: Low returns compared to equities; susceptible to inflation risk.
3.4 Market-Neutral ETFs
Some ETFs employ long-short strategies to minimize market exposure.
Long-short ETFs: Buy undervalued stocks (long) and short overvalued stocks.
Market-neutral ETFs: Target returns independent of overall market movements.
These instruments provide a way for retail investors to engage in near-risk-free strategies without complex derivative setups.
3.5 Statistical Arbitrage
Statistical arbitrage uses historical correlations and mathematical models to trade pairs or baskets of securities.
How it Works:
Identify highly correlated assets.
Go long on underperforming and short on overperforming securities.
Profit as the spread converges.
This is a market-neutral strategy but requires sophisticated software, data analysis, and continuous monitoring.
4. Principles of Minimizing Risk
Even with strategies labeled “risk-free,” the following principles are essential:
Diversification: Spread capital across multiple assets to reduce exposure to a single market event.
Hedging: Protect positions using derivatives to offset adverse moves.
Position Sizing: Avoid over-leveraging, as even low-risk trades can become high-risk with excessive capital.
Liquidity Awareness: Trade only in liquid markets where positions can be exited quickly.
Cost Management: Transaction fees, spreads, and taxes can erode profits, converting low-risk strategies into potential losses.
5. Common Misconceptions
“Risk-free trading exists in all markets” → False. Only government-backed instruments are truly risk-free.
“High returns with zero risk is achievable” → Impossible; higher returns always involve higher risk.
“Hedging eliminates risk” → Hedging reduces risk but cannot remove systemic or operational risk.
6. Implementing Risk-Free Strategies in Real Markets
6.1 Tools and Platforms
Trading Platforms: NSE, BSE, Interactive Brokers, MetaTrader for forex arbitrage.
Derivatives Platforms: For options and futures hedging.
Data Analytics: High-speed software for identifying arbitrage opportunities.
6.2 Risk Monitoring
Set stop-loss orders even in hedged positions.
Use risk/reward analysis to evaluate each trade.
Monitor market conditions, interest rates, and geopolitical events that may affect “risk-free” assumptions.
6.3 Case Study: Arbitrage in Indian Markets
Scenario: Nifty futures trading at a premium to spot index.
Strategy:
Short Nifty futures.
Buy underlying stocks forming the index.
Lock in profit as futures and spot prices converge at expiry.
This is a classic cash-and-carry arbitrage, minimizing market risk while generating predictable returns.
7. Limitations of Risk-Free Trading
Capital Intensive: Arbitrage requires significant capital for small profits.
Execution Risk: Delays or errors can eliminate expected gains.
Regulatory Constraints: Some strategies may be restricted in certain markets.
Opportunity Scarcity: Risk-free opportunities are rare and often short-lived.
8. Conclusion
Risk-free trading is a concept grounded in finance theory but practically limited in speculative markets. True zero-risk investments are confined to government-backed securities, while near-risk-free strategies involve arbitrage, hedging, and market-neutral approaches. Traders aiming to minimize risk must combine strategic execution, diversification, and risk management tools to achieve consistent, low-risk returns.
While markets inherently carry uncertainty, understanding risk, leveraging arbitrage opportunities, and employing hedged strategies allows traders to approach the closest practical form of risk-free trading. In essence, the goal is not to eliminate risk entirely but to manage it intelligently, ensuring that potential losses are minimized while opportunities for gain remain accessible.
Cryptocurrency as a Digital Asset1. What is a Cryptocurrency?
At its core, a cryptocurrency is a digital or virtual currency that relies on cryptography for security. Unlike physical currencies issued by governments (fiat money), cryptocurrencies operate on decentralized networks based on blockchain technology—a distributed ledger maintained by a network of computers (nodes). These digital assets can be used as a medium of exchange, a store of value, and a unit of account, although their adoption varies widely.
The first and most widely known cryptocurrency is Bitcoin, introduced in 2009 by the pseudonymous creator Satoshi Nakamoto. Bitcoin was designed as a peer-to-peer electronic cash system, enabling users to transact without intermediaries like banks. Since then, thousands of alternative cryptocurrencies (altcoins) have emerged, each with unique features, purposes, and communities.
2. Characteristics of Cryptocurrencies as Digital Assets
Cryptocurrencies possess distinct characteristics that differentiate them from traditional assets:
a. Decentralization
Unlike centralized financial systems controlled by banks or governments, cryptocurrencies operate on decentralized networks. This decentralization reduces reliance on intermediaries, enhances transparency, and mitigates single points of failure in financial systems.
b. Digital Nature
Cryptocurrencies exist solely in digital form, making them easily transferable across borders, instantaneously, without the need for physical exchange. This digital nature allows for programmable transactions, automated contracts, and integration with emerging technologies like smart contracts and decentralized finance (DeFi).
c. Security and Immutability
Transactions are secured using cryptographic algorithms. Once recorded on a blockchain, transactions are immutable, meaning they cannot be altered or deleted. This feature enhances trust and integrity in digital financial transactions.
d. Scarcity and Supply Mechanisms
Many cryptocurrencies, like Bitcoin, have a fixed maximum supply. Bitcoin, for instance, has a cap of 21 million coins. This scarcity creates a potential store of value similar to precious metals, and it can influence market dynamics through supply-demand mechanisms.
e. Volatility
Cryptocurrencies are notorious for price volatility. The same digital asset may experience significant fluctuations in a single day due to speculative trading, adoption news, regulatory announcements, or macroeconomic factors. While this volatility presents high-risk opportunities for traders, it can also pose challenges for long-term investors.
3. The Technology Behind Cryptocurrencies
The backbone of cryptocurrencies is blockchain technology—a distributed ledger that records all transactions across a network of computers. Key technological aspects include:
a. Blockchain
A blockchain is a chain of blocks containing transaction records. Each block is linked to the previous one using cryptographic hashes, creating a secure, immutable record. Blockchains can be public (like Bitcoin and Ethereum) or private/permissioned (used by enterprises).
b. Consensus Mechanisms
Cryptocurrencies rely on consensus mechanisms to validate transactions without a central authority. Common mechanisms include:
Proof of Work (PoW): Miners solve complex mathematical problems to validate transactions (e.g., Bitcoin).
Proof of Stake (PoS): Validators are chosen based on the number of coins they hold and are willing to “stake” (e.g., Ethereum 2.0).
Other mechanisms: Delegated Proof of Stake (DPoS), Proof of Authority (PoA), and hybrid models.
c. Smart Contracts
Smart contracts are self-executing contracts with terms directly written into code. They run on blockchain platforms like Ethereum and enable decentralized applications (DApps) for lending, insurance, gaming, and other financial services.
d. Wallets and Keys
Cryptocurrency ownership is represented by cryptographic keys:
Public key: Acts like an address for receiving funds.
Private key: Acts as a password for authorizing transactions. Proper management of private keys is crucial for asset security.
4. Cryptocurrencies as an Investment Asset Class
Cryptocurrencies have evolved from speculative instruments to a recognized asset class in global finance. Investors view them through various lenses:
a. Store of Value
Bitcoin is often referred to as “digital gold” due to its limited supply and potential to hedge against inflation. Unlike fiat currency, whose value may erode due to monetary expansion, Bitcoin offers a deflationary characteristic.
b. Diversification
Cryptocurrencies provide portfolio diversification due to their low correlation with traditional asset classes like equities and bonds. Including crypto assets in an investment portfolio can enhance risk-adjusted returns.
c. High-Risk, High-Reward
The cryptocurrency market is volatile and speculative. While early adopters have earned significant returns, the market is also prone to crashes. Understanding risk tolerance, time horizon, and market cycles is critical for investors.
d. Yield Opportunities
Beyond price appreciation, cryptocurrencies offer opportunities for earning yields through mechanisms like staking, lending, and decentralized finance protocols.
5. Market Dynamics and Trading
The cryptocurrency market operates 24/7, unlike traditional stock markets. Key factors influencing crypto prices include:
Supply and demand: Limited supply and growing adoption can drive prices higher.
Speculation: Retail and institutional investors’ buying/selling patterns create volatility.
Regulatory news: Announcements regarding crypto regulations significantly impact market sentiment.
Technological developments: Upgrades, forks, and innovations affect the value of specific cryptocurrencies.
Macro trends: Inflation, monetary policy, and geopolitical events influence crypto markets indirectly.
Trading strategies in cryptocurrency markets range from long-term holding (HODLing) to intraday trading, arbitrage, and algorithmic trading. Each strategy carries its own risk-reward profile.
6. Risks Associated with Cryptocurrencies
Investing or trading in cryptocurrencies comes with multiple risks:
Volatility Risk: Prices can swing dramatically within hours.
Regulatory Risk: Governments can impose bans, restrictions, or heavy taxation.
Security Risk: Hacks, scams, and wallet mismanagement can lead to loss of funds.
Liquidity Risk: Smaller cryptocurrencies may have low trading volumes, making it difficult to enter or exit positions.
Technological Risk: Bugs, forks, or software vulnerabilities can compromise networks or assets.
Investors must conduct thorough research, employ security best practices, and consider risk management strategies before entering the crypto market.
Conclusion
Cryptocurrencies as digital assets represent one of the most profound financial innovations of the 21st century. By combining cryptography, decentralized networks, and digital scarcity, they have created a new paradigm for value exchange. Investors, technologists, and regulators continue to explore their potential, benefits, and risks.
While volatility, security, and regulatory uncertainty present challenges, the long-term prospects for cryptocurrencies remain promising. They offer an alternative financial system that is borderless, programmable, and transparent, potentially transforming the way we think about money, investments, and global trade. As adoption grows and technology matures, cryptocurrencies are likely to become an increasingly integral part of both individual portfolios and institutional financial strategies.
AI Trading: Revolutionizing Financial Markets1. The Evolution of AI in Trading
Trading has evolved significantly over centuries. From the days of barter and physical stock exchanges to electronic trading and algorithmic trading, the financial markets have consistently embraced technology to improve efficiency. AI trading represents the latest stage in this evolution.
Manual Trading Era: Traders relied on intuition, experience, and basic technical analysis to make investment decisions. Decisions were slow and prone to human errors.
Electronic Trading Era: The introduction of computers allowed traders to place orders electronically, improving speed and accuracy.
Algorithmic Trading Era: Algorithms began executing pre-defined rules for buying and selling securities, such as moving average crossovers or mean-reversion strategies.
AI Trading Era: The incorporation of AI allows systems to learn from historical data, adapt to market changes, predict trends, and even understand unstructured data like news, social media sentiment, and macroeconomic reports.
AI trading represents a fundamental shift: moving from rule-based execution to intelligence-driven decision-making.
2. Core Technologies Behind AI Trading
AI trading relies on several advanced technologies. Understanding these technologies is crucial for grasping the mechanics and potential of AI-driven markets.
2.1 Machine Learning (ML)
Machine learning enables systems to learn patterns from historical data and make predictions without explicit programming. In trading, ML can identify relationships between variables like price, volume, and volatility. Key applications include:
Predicting price movements.
Forecasting market volatility.
Classifying stocks into buy/sell/hold categories.
Common ML algorithms in trading include linear regression, decision trees, support vector machines, and ensemble methods like random forests.
2.2 Deep Learning
Deep learning, a subset of ML, uses neural networks to model complex, non-linear relationships in data. Deep learning is particularly effective for:
High-frequency trading (HFT) where speed and precision are essential.
Analyzing large-scale unstructured data like images, news articles, and social media sentiment.
Detecting complex patterns in financial time series data.
Techniques like recurrent neural networks (RNNs) and long short-term memory (LSTM) networks are widely used for predicting stock prices and market trends.
2.3 Natural Language Processing (NLP)
Financial markets are influenced not just by numbers but by news, reports, tweets, and corporate statements. NLP allows AI systems to:
Interpret news headlines and articles.
Gauge market sentiment from social media.
Analyze earnings calls and financial reports.
By extracting sentiment and context from textual data, AI can anticipate market reactions before human traders even comprehend them.
2.4 Reinforcement Learning (RL)
Reinforcement learning trains AI to make decisions by rewarding profitable actions and penalizing losses. In trading, RL models simulate different market scenarios to optimize strategies over time. Applications include:
Dynamic portfolio management.
Trade execution optimization.
Strategy testing in simulated environments.
3. Types of AI Trading Strategies
AI trading strategies can be broadly categorized based on their objectives, data inputs, and execution speed.
3.1 Predictive Analytics Strategies
AI predicts future price movements using historical and real-time data. Strategies include:
Price Prediction Models: Forecasting asset prices using machine learning and time series analysis.
Volatility Forecasting: Identifying periods of high or low volatility to adjust risk exposure.
3.2 Sentiment Analysis Strategies
Using NLP, AI analyzes textual data to gauge market sentiment. For instance:
Positive news coverage of a company may trigger AI to buy its shares.
Negative tweets about economic conditions could prompt AI to reduce risk exposure.
3.3 High-Frequency Trading (HFT) Strategies
HFT involves executing thousands of trades in milliseconds. AI helps:
Identify micro-patterns in price fluctuations.
Exploit arbitrage opportunities.
Execute trades with minimal latency.
3.4 Portfolio Optimization
AI constructs and rebalances portfolios based on risk-return profiles. Using ML and RL, AI can:
Diversify across assets and sectors.
Adjust allocations in response to market shifts.
Minimize drawdowns and maximize returns.
3.5 Market Making and Arbitrage
AI can act as a market maker by continuously quoting buy and sell prices. In arbitrage, AI exploits price discrepancies across exchanges or assets, executing trades automatically to capture profits.
4. Data Sources in AI Trading
The success of AI trading depends heavily on data. AI systems analyze vast and diverse datasets, including:
Market Data: Historical and real-time price, volume, and order book data.
Economic Data: GDP, inflation, interest rates, and employment statistics.
Alternative Data: Satellite imagery, web traffic, geolocation data, and credit card transactions.
Sentiment Data: News articles, press releases, and social media posts.
Corporate Data: Financial statements, earnings reports, and insider transactions.
By integrating multiple data sources, AI creates a holistic view of the market environment.
5. Benefits of AI Trading
AI trading offers several advantages over traditional methods:
5.1 Speed and Efficiency
AI executes trades at lightning speed, far beyond human capabilities, reducing execution risk and capitalizing on fleeting opportunities.
5.2 Objectivity
Unlike human traders, AI operates without emotions. It strictly follows data-driven rules, reducing biases like fear, greed, or overconfidence.
5.3 Continuous Learning
AI systems continuously learn from market data, adapting strategies to changing conditions and improving over time.
5.4 Scalability
AI can monitor and trade thousands of assets simultaneously, which is impossible for human traders.
5.5 Predictive Power
By analyzing historical patterns, AI can forecast trends, anticipate market reactions, and enhance decision-making.
6. Challenges and Risks in AI Trading
Despite its advantages, AI trading is not without risks:
6.1 Model Overfitting
AI models trained on historical data may perform poorly in unforeseen market conditions, leading to losses.
6.2 Data Quality and Bias
AI relies on high-quality data. Inaccurate or biased data can produce flawed predictions.
6.3 Market Impact
Large AI-driven trades can unintentionally move the market, especially in illiquid securities.
6.4 Lack of Transparency
Complex AI models, particularly deep learning, can be “black boxes,” making it difficult to explain decisions to regulators or stakeholders.
6.5 Cybersecurity Risks
AI trading systems are vulnerable to hacking, manipulation, or technical failures.
7. The Future of AI Trading
The future of AI trading is promising, driven by advancements in computing power, data availability, and machine learning techniques. Emerging trends include:
Explainable AI (XAI): Enhancing transparency and trust by making AI decisions interpretable.
Integration with Blockchain: Using decentralized finance (DeFi) for faster and more secure AI-driven trades.
Quantum Computing: Potentially revolutionizing AI trading by solving complex optimization problems in seconds.
Adaptive Multi-Asset Trading: AI simultaneously managing diverse portfolios across stocks, bonds, derivatives, and digital assets.
Ethical AI Frameworks: Ensuring AI operates responsibly and aligns with human values.
As AI continues to mature, it will not just assist human traders but could redefine financial markets entirely.
8. Conclusion
AI trading marks a revolutionary shift in the world of finance. By leveraging machine learning, deep learning, NLP, and reinforcement learning, AI enables faster, more accurate, and adaptive trading strategies. While the benefits of AI trading—speed, scalability, objectivity, and predictive power—are immense, it also brings challenges related to model risk, data quality, transparency, and regulatory compliance.
The integration of AI into trading represents both an opportunity and a responsibility. Traders, institutions, and regulators must collaborate to ensure that AI-driven markets remain efficient, fair, and resilient. With proper oversight and innovation, AI trading promises to redefine the future of investing, making markets smarter, faster, and more interconnected than ever before.
Managing Market Volatility Through Smart Trade ExecutionUnderstanding Market Volatility
Before delving into trade execution, it is essential to understand what drives market volatility. Volatility refers to the degree of variation in the price of a security or market index over a given period. High volatility indicates large price swings, while low volatility suggests stability.
Key Drivers of Volatility
Macroeconomic Factors: Interest rate changes, inflation data, GDP growth, and employment figures can cause sharp market reactions. For example, an unexpected hike in interest rates by a central bank can trigger sudden sell-offs in equities.
Geopolitical Events: Political instability, trade disputes, and conflicts often lead to market uncertainty. These events may not directly affect fundamentals but can create panic-driven price movements.
Earnings Announcements: Quarterly earnings reports can lead to significant stock-specific volatility, particularly when results deviate from analyst expectations.
Liquidity Conditions: Thinly traded securities or markets with low liquidity are more prone to extreme price swings.
Market Sentiment and Psychology: Fear and greed are powerful forces. Herd behavior and panic selling amplify volatility, creating both risk and opportunity.
Volatility is not inherently negative. Traders often thrive in volatile markets because price swings can create opportunities for profit—but only if executed with precision.
The Importance of Smart Trade Execution
Trade execution refers to the process of placing and completing buy or sell orders in the market. Smart execution is more than just entering an order; it involves strategically planning when, how, and at what price the trade is executed to minimize risk and maximize efficiency.
Key benefits of smart trade execution include:
Reduced Market Impact: Large orders executed without strategy can move the market against the trader. Smart execution breaks orders into smaller chunks or uses algorithms to minimize price disruption.
Lower Transaction Costs: Strategic execution can reduce costs like bid-ask spreads, slippage, and commissions.
Enhanced Risk Management: By using techniques like limit orders or conditional orders, traders can control exposure and avoid being caught on the wrong side of sudden volatility.
Improved Profitability: Capturing favorable entry and exit points allows traders to take advantage of volatility instead of being hurt by it.
Core Strategies for Managing Volatility Through Trade Execution
Effective trade execution during volatile periods involves a combination of planning, technology, and disciplined decision-making. Here are the core strategies:
1. Algorithmic Trading
Algorithmic trading involves using computer programs to execute orders based on pre-defined rules. These rules may include timing, price, volume, or other market conditions.
Benefits in Volatile Markets:
Precision and Speed: Algorithms can react to market changes faster than humans, executing trades in milliseconds.
Reduced Emotional Bias: Volatile markets often trigger fear or greed, but algorithms stick to the plan.
Customizable Execution Strategies: Traders can use algorithms for Volume Weighted Average Price (VWAP), Time Weighted Average Price (TWAP), or other execution tactics that minimize market impact.
2. Use of Limit Orders
Limit orders allow traders to set a maximum buying price or minimum selling price, providing control over execution.
Advantages:
Protects against unexpected price swings.
Ensures that trades are executed at desired levels.
Reduces the risk of slippage in volatile conditions.
Example: A trader wants to buy shares of a volatile stock priced around ₹500. Instead of placing a market order, they set a limit order at ₹495. If the market dips, the order executes at or below ₹495, preventing overpaying.
3. Risk-Based Position Sizing
Position sizing involves determining the amount of capital allocated to each trade based on risk tolerance and market conditions.
In Volatile Markets:
Reduce position size to manage exposure.
Increase diversification to avoid concentrated risk.
Use risk/reward ratios to guide entry and exit points.
Practical Tip: Traders often risk only 1-2% of their total capital per trade in highly volatile conditions to preserve capital.
4. Stop-Loss and Conditional Orders
Stop-loss orders automatically exit positions when a security reaches a predetermined price. Conditional orders, like stop-limit or trailing stops, provide more sophisticated control.
Benefits:
Prevents catastrophic losses during sudden market swings.
Allows traders to lock in profits automatically.
Reduces the need for constant market monitoring.
Example: In a volatile market, a stock trading at ₹1,000 could quickly drop to ₹900. A stop-loss order at ₹950 automatically exits the position, protecting the trader from larger losses.
5. Diversification Across Assets and Instruments
Diversification is a traditional risk management tool that works well in volatile markets. By spreading exposure across multiple assets—equities, commodities, currencies, or derivatives—traders reduce the impact of adverse moves in any single instrument.
Advanced Approach:
Use hedging strategies such as options or futures to protect positions.
Implement pairs trading, where gains in one asset offset losses in another.
Rotate positions between low-volatility and high-volatility assets based on market cycles.
6. Real-Time Market Data and Analytics
Having access to high-quality, real-time data is critical for smart execution. Price feeds, order book data, and market depth provide insights into liquidity, momentum, and potential price swings.
Advantages:
Identify support and resistance levels in volatile conditions.
Anticipate liquidity gaps that could affect execution.
Adjust trade strategies dynamically based on live market information.
Example: A trader notices that a sudden spike in volume is concentrated in a few price levels. Using this information, they can place limit orders at levels that maximize execution probability while minimizing slippage.
7. Dynamic Hedging
Hedging involves taking positions that offset potential losses in an existing portfolio. In volatile markets, dynamic hedging adjusts hedge positions continuously based on changing market conditions.
Common Techniques:
Options hedging to limit downside risk.
Futures contracts to lock in prices.
Cross-asset hedging, such as balancing equity exposure with commodity or currency positions.
8. Psychological Discipline and Execution Routine
Volatility tests a trader’s mental discipline. Even the best execution strategies fail if emotions dominate decision-making.
Key Practices:
Stick to pre-defined execution rules and risk parameters.
Avoid impulsive trades during sharp market moves.
Review trades post-execution to refine strategies and improve performance.
Technology and Tools for Smart Execution
Modern trading is heavily technology-driven. Smart execution relies on tools that optimize order placement, monitor market conditions, and automate risk management.
1. Trading Platforms
Advanced trading platforms offer features like algorithmic trading, conditional orders, market scanning, and portfolio management.
2. Execution Management Systems (EMS)
EMS are designed for professional traders to manage high-volume orders across multiple markets and venues efficiently. They optimize order routing and reduce execution costs.
3. Market Analytics and AI
Artificial intelligence and machine learning algorithms analyze historical and real-time market data to identify patterns and predict short-term volatility. This information can be integrated into execution strategies.
4. Low-Latency Infrastructure
Speed is critical in volatile markets. Low-latency connections to exchanges and co-located servers enable faster order execution, reducing slippage and improving profitability.
Best Practices for Managing Volatility Through Execution
Plan Before You Trade: Define entry, exit, and risk parameters before market opens.
Use Technology Wisely: Integrate algorithmic strategies and analytics tools.
Control Position Size: Adjust exposure based on market conditions.
Diversify: Spread risk across instruments and asset classes.
Stay Disciplined: Avoid emotional trading; stick to pre-defined rules.
Continuously Monitor: Track execution performance and adjust strategies dynamically.
Conclusion
Managing market volatility is both an art and a science. While volatility introduces uncertainty, it also creates opportunities for informed traders and investors. Smart trade execution—leveraging technology, disciplined strategies, and risk management—serves as the bridge between potential risk and profitable outcomes.
By understanding market drivers, using advanced execution techniques, and maintaining psychological discipline, traders can navigate volatile markets with confidence, protect capital, and achieve long-term success. In today’s fast-moving financial landscape, mastering smart trade execution is not just advantageous; it is essential.
Volatility may never disappear from financial markets, but with intelligent execution, it becomes a tool for growth rather than a source of fear.
Option Trading 1. Introduction to Options
In the world of financial markets, investors and traders are always looking for instruments that allow them flexibility, leverage, and opportunities to manage risks. One of the most popular derivatives that provide such opportunities is options trading.
An option is a financial contract between two parties: a buyer and a seller. The buyer of the option gets the right, but not the obligation, to buy or sell an underlying asset (like stocks, indices, or commodities) at a predetermined price within a specified time. The seller (also called the option writer) has the obligation to fulfill the contract if the buyer decides to exercise it.
This feature—right without obligation—is what makes options unique compared to other financial instruments.
2. Basic Terminology
Before diving deeper, let’s clarify some key terms:
Call Option: Gives the buyer the right to buy the underlying asset at a fixed price (strike price).
Put Option: Gives the buyer the right to sell the underlying asset at a fixed price.
Strike Price: The pre-agreed price at which the buyer can buy or sell the underlying.
Premium: The cost paid by the option buyer to the seller for the right.
Expiration Date: The last date the option is valid.
In the Money (ITM): When exercising the option is profitable (e.g., stock price above strike for calls, below strike for puts).
Out of the Money (OTM): When exercising leads to a loss, so the buyer won’t exercise.
At the Money (ATM): When the stock price is very close to the strike price.
3. How Options Work – An Example
Suppose stock ABC Ltd. is trading at ₹100.
You expect the stock to rise.
You buy a Call Option with a strike price of ₹105 for a premium of ₹3, expiring in one month.
Scenario 1: Stock rises to ₹115
You exercise your right to buy at ₹105 and immediately sell at ₹115.
Profit = (115 – 105) – 3 = ₹7 per share.
Scenario 2: Stock stays at ₹100
Buying at ₹105 makes no sense, so you let the option expire.
Loss = premium paid = ₹3.
This shows the limited loss (premium only) but unlimited profit potential for an option buyer.
4. Types of Options Trading Participants
There are broadly four categories:
Call Buyers – bullish traders expecting price rise.
Put Buyers – bearish traders expecting price fall.
Call Sellers – take opposite side of call buyers, hoping price stays flat or falls.
Put Sellers – take opposite side of put buyers, hoping price stays flat or rises.
Buyers take on risk by paying premiums, while sellers assume obligations but earn premiums upfront.

Divergence Secrets1. Basic Option Trading Strategies
These are simple, beginner-friendly strategies where risks are limited and easy to understand.
1.1 Covered Call
How it Works: You own 100 shares of a stock and sell a call option against it.
Goal: Earn income (premium) while holding stock.
Best When: You expect the stock to stay flat or slightly rise.
Risk: If stock rises too much, you must sell at the strike price.
Example: You own Infosys at ₹1,500. You sell a call at strike ₹1,600 for premium ₹20. If Infosys stays below ₹1,600, you keep the premium.
1.2 Protective Put
How it Works: You buy a put option to protect a stock you own.
Goal: Hedge downside risk.
Best When: You fear a market drop but don’t want to sell.
Example: You own TCS at ₹3,500. You buy a put with strike ₹3,400. If TCS falls to ₹3,200, your stock loses ₹300, but the put gains.
1.3 Cash-Secured Put
How it Works: You sell a put option while holding enough cash to buy the stock if assigned.
Goal: Earn premium and possibly buy stock at a discount.
Best When: You’re okay owning the stock at a lower price.
2. Intermediate Strategies
Now we step into strategies combining multiple options.
2.1 Vertical Spreads
These involve buying one option and selling another of the same type (call/put) with different strikes but same expiry.
(a) Bull Call Spread
Buy lower strike call, sell higher strike call.
Limited risk, limited profit.
Best when moderately bullish.
(b) Bear Put Spread
Buy higher strike put, sell lower strike put.
Best when moderately bearish.
2.2 Calendar Spread
Buy a long-term option and sell a short-term option at the same strike.
Profits if stock stays near strike as short-term option loses value faster.
2.3 Diagonal Spread
Like a calendar, but strikes are different.
Offers flexibility in adjusting for trend + time.
3. Advanced Option Trading Strategies
These are for experienced traders who understand volatility and time decay deeply.
3.1 Straddle
Buy one call and one put at same strike, same expiry.
Profits if the stock makes a big move in either direction.
Best before major events (earnings, policy announcements).
Risk: If stock stays flat, you lose premium.
3.2 Strangle
Similar to straddle, but strike prices are different.
Cheaper, but requires larger move.
3.3 Iron Condor
Sell an out-of-the-money call spread and put spread.
Profits if stock stays within a range.
Great for low-volatility environments.
3.4 Butterfly Spread
Combination of calls (or puts) where profit peaks at a middle strike.
Limited risk, limited reward.
Best when expecting very little movement.
3.5 Ratio Spreads
Sell more options than you buy (like 2 short calls, 1 long call).
Higher potential reward, but can be risky if stock trends too far.

PCR Trading StrategiesIntroduction
Options are among the most fascinating tools in the financial markets. Unlike regular stock trading, where you simply buy or sell shares, options allow you to control risk, leverage your money, and design strategies that profit in multiple market conditions—whether the market goes up, down, or even stays flat.
But here’s the catch: options can be confusing at first. Many beginners look at terms like strike price, premium, Greeks, spreads, and quickly feel overwhelmed. That’s why the key to mastering options is not memorizing definitions but understanding how strategies work in different situations.
This guide takes you step by step, from the basics to advanced strategies, with real-world logic and human-friendly explanations. By the end, you’ll not only know the common option strategies but also when and why traders use them.
1. The Foundations of Options Trading
1.1 What is an Option?
An option is a contract that gives the buyer the right, but not the obligation, to buy or sell an asset at a certain price within a certain time frame.
Call Option: Right to buy an asset at a set price (strike price).
Put Option: Right to sell an asset at a set price.
Example: Suppose Reliance stock is at ₹2,500. You buy a call option with strike price ₹2,600 expiring in one month. If Reliance goes to ₹2,700, your option becomes valuable, because you can buy at ₹2,600 when the market price is ₹2,700.
1.2 Key Terms
Strike Price: The price at which you can buy/sell.
Premium: The cost of the option.
Expiration Date: The last date the option is valid.
In the Money (ITM): Option already has value.
Out of the Money (OTM): Option has no intrinsic value yet.
1.3 Why Use Options?
Hedging: Protect your portfolio from risk.
Speculation: Bet on market direction with less money.
Income: Earn regular premiums by selling options.
2. The Core Building Blocks
Before strategies, let’s understand what influences an option’s price:
2.1 Intrinsic vs. Extrinsic Value
Intrinsic Value: The real value if exercised now.
Extrinsic Value: The time and volatility premium.
Example: Nifty at 20,000. A call with strike 19,800 has intrinsic value = 200. If premium is 250, then 200 is intrinsic, 50 is extrinsic.
2.2 Time Decay (Theta)
Options lose value as they approach expiry. This is why sellers often make money if the stock doesn’t move much.
2.3 Volatility (Vega)
Higher volatility increases option premiums. Ahead of big events like earnings, option prices rise. After the event, prices usually drop (called volatility crush).

Part 2 Candle Stick Pattern 1. Types of Options
Options are classified based on the right they provide and the market they trade in.
1. Based on Rights
Call Option: Right to buy.
Put Option: Right to sell.
2. Based on Market
American Options: Can be exercised anytime before expiry.
European Options: Can only be exercised on the expiry date.
3. Based on Underlying Asset
Equity Options: Based on individual stocks.
Index Options: Based on stock indices like Nifty 50.
Commodity Options: Based on commodities like gold, oil, or wheat.
Currency Options: Based on forex pairs.
2. Options Pricing
Option prices (premium) are determined using complex models like the Black-Scholes model, but in simple terms, two main components matter:
Intrinsic Value: Profit potential if exercised now.
Time Value: Extra cost reflecting time until expiry and market volatility.
Example:
If a stock trades at ₹120 and a call option strike is ₹100, intrinsic value = ₹20. Premium may be ₹25, meaning time value = ₹5.
3. Options Trading Strategies
Options allow traders to adopt different strategies depending on market outlook:
A. Basic Strategies
Long Call: Buy call, bet on rising prices.
Long Put: Buy put, bet on falling prices.
Covered Call: Own the stock and sell call to earn premium.
Protective Put: Own the stock and buy a put for protection.
B. Advanced Strategies
Straddle: Buy call and put at the same strike price—profit from high volatility.
Strangle: Buy call and put with different strike prices—cheaper than straddle.
Spread: Combine buying and selling options to reduce risk.
Bull Call Spread
Bear Put Spread
Iron Condor: Sell OTM call and put, buy further OTM options—profit in sideways markets.
4. Risks in Options Trading
Options can be profitable, but they carry risks:
Time Decay (Theta): Options lose value as expiry approaches.
Volatility Risk (Vega): Lower volatility can reduce option premiums.
Unlimited Losses: Writing naked calls can be very risky.
Complexity Risk: Advanced strategies require careful understanding.
Liquidity Risk: Some options may be hard to sell before expiry.
5. Tips for Beginners
Start Small: Trade with a small portion of capital.
Understand the Greeks: Learn Delta, Theta, Vega, and Gamma for managing risk.
Paper Trading: Practice in simulation before using real money.
Stick to Simple Strategies: Start with basic calls and puts.
Manage Risk: Always define maximum loss and use stop-loss if needed.
Focus on Education: Read, attend webinars, and follow market news.
