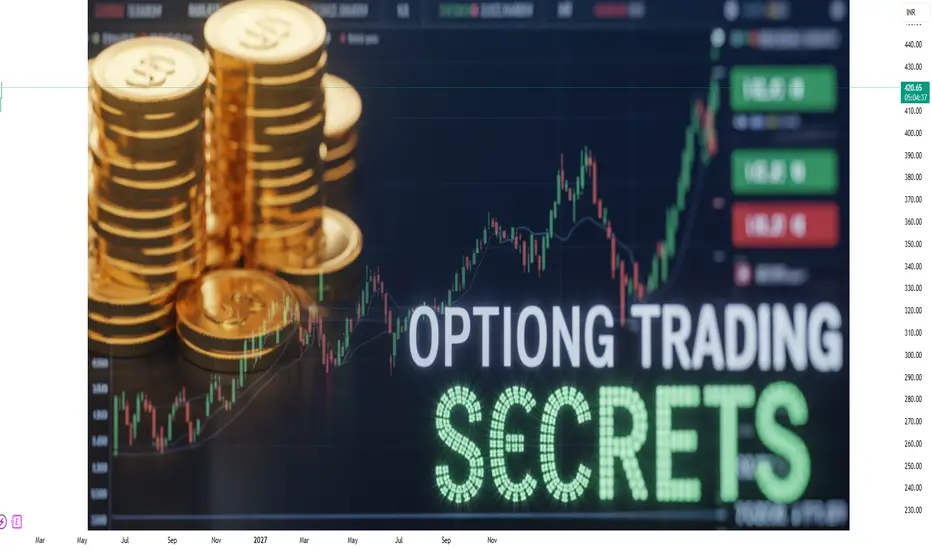
Proven Strategies to Trade Options Like a ProfessionalOption Trading Secrets:
Option trading is often seen as complex, risky, and suitable only for experts. However, when understood correctly, options can become one of the most powerful tools for generating consistent income, managing risk, and enhancing portfolio returns. The real “secrets” of option trading are not hidden formulas or insider tricks, but a combination of knowledge, discipline, strategy selection, and risk control. Successful option traders think in probabilities, not predictions, and focus on process rather than excitement.
Below is a detailed explanation of the key option trading secrets that separate consistently profitable traders from those who struggle.
1. Understanding Options Beyond Buy and Sell
The first secret is understanding that options are not just about buying calls or puts. Options are financial instruments that allow traders to design strategies based on market direction, volatility, and time. While beginners focus only on direction (price going up or down), professionals focus on three dimensions:
Direction (Bullish, Bearish, Sideways)
Volatility (High or Low)
Time decay (Theta)
Once you understand these three forces, options become flexible tools rather than gambling instruments.
2. Time Decay Is Your Biggest Advantage
One of the biggest secrets in option trading is that time decay works in favor of option sellers, not buyers. Every option loses value as it approaches expiry, especially in the last few days. Professional traders often sell options to take advantage of this natural decay.
Option buyers need a fast and strong move to profit.
Option sellers can profit even if the market moves slowly or stays sideways.
This is why many experienced traders prefer strategies like credit spreads, iron condors, and short strangles instead of naked option buying.
3. Volatility Matters More Than Direction
Another hidden truth is that volatility is often more important than price movement. Many traders lose money even when the market moves in their direction because they ignored volatility.
Buying options during high volatility is risky because premiums are expensive.
Selling options during high volatility is beneficial because premiums are inflated.
Smart traders sell options when volatility is high and buy options when volatility is low. Understanding indicators like Implied Volatility (IV) and IV Percentile gives traders a strong edge.
4. Probability-Based Trading Wins Long Term
Successful option traders trade based on probabilities, not emotions. Every option strategy has a probability of success, which can be calculated using option Greeks and statistical models.
Instead of asking:
“Will the market go up?”
Professionals ask:
“What is the probability that the market will stay within this range?”
Strategies with a 60–75% probability of success may give smaller profits per trade, but they work consistently over time.
5. Risk Management Is the Real Secret
The biggest secret of all is that risk management matters more than strategy. Even the best option strategy will fail without proper risk control.
Key risk management rules include:
Never risk more than 1–2% of total capital on a single trade.
Always define maximum loss before entering a trade.
Avoid over-leveraging or selling too many lots.
Use stop-losses or adjustment rules.
Professional traders survive because they protect capital first and chase profits second.
6. Strategy Selection Based on Market Conditions
One common mistake is using the same option strategy in every market. The secret is to match strategy with market condition:
Trending Market: Debit spreads, call/put spreads
Sideways Market: Iron condors, strangles, straddles
High Volatility: Option selling strategies
Low Volatility: Option buying strategies
There is no “best” strategy—only the right strategy for the right condition.
7. Adjustments Are More Important Than Entries
Many traders obsess over perfect entries, but professionals know that trade adjustments are what save losing positions.
Adjustments may include:
Rolling positions to a later expiry
Converting naked positions into spreads
Reducing risk by booking partial profits
Shifting strikes to balance delta
Option trading is dynamic. Flexibility and adjustment skills turn losing trades into manageable outcomes.
8. Discipline Beats Intelligence
Option trading does not reward intelligence alone—it rewards discipline and consistency. Traders lose money not because strategies fail, but because emotions take control.
Common emotional mistakes:
Overtrading after losses
Holding losing trades hoping for reversal
Booking profits too early out of fear
Breaking rules after one bad day
Successful traders follow a written trading plan and execute it without emotional interference.
9. Small Consistent Profits Compound Big Wealth
Another secret is that option trading is not about hitting jackpots. It is about small, consistent gains that compound over time.
Making:
2–3% per month consistently
can outperform risky strategies that aim for quick profits but blow up accounts.
Professional traders think in terms of monthly and yearly returns, not daily excitement.
10. Learning Never Stops
Markets evolve, volatility changes, and instruments behave differently over time. The best option traders continuously:
Review past trades
Analyze mistakes
Adapt strategies
Learn new market dynamics
Option trading is a skill that improves with experience, patience, and continuous education.
Conclusion
The real secrets of option trading are not hidden indicators or insider tips. They lie in understanding time decay, volatility, probability, and risk management. Option trading rewards traders who think logically, act patiently, and follow rules consistently.
If you treat option trading as a business rather than a gamble, focus on capital protection, and trade with discipline, options can become a powerful wealth-building tool over the long term.
Chart Patterns
Best Candle Patterns Candlestick patterns were developed in Japan hundreds of years ago and remain one of the most effective tools for understanding market psychology. Each candle shows:
Open
Close
High
Low
The shape of the candle and relationship with previous candles help traders unlock the sentiment behind the move.
Candlestick patterns can be grouped into:
Bullish Reversal Patterns
Bearish Reversal Patterns
Continuation Patterns
Indecision Candles

How Smart Money Dominates Financial Markets Institutional Trading Strategies:
Institutional trading strategies refer to the methods and frameworks used by large financial entities such as banks, hedge funds, mutual funds, pension funds, insurance companies, and proprietary trading firms. These institutions control massive capital, sophisticated technology, and deep market access, allowing them to influence price movements and market structure itself. Unlike retail traders, institutional participants focus on scalability, risk-adjusted returns, liquidity management, and long-term consistency rather than short-term excitement. Understanding institutional trading strategies provides valuable insight into how markets truly operate and why prices move the way they do.
At the core of institutional trading is capital preservation and steady growth. Institutions are not trying to double money overnight; instead, they aim to generate predictable returns while minimizing volatility and drawdowns. Every strategy is built around strict risk controls, diversification, and disciplined execution. This mindset alone separates institutional traders from most retail participants.
Market Structure and Order Flow Focus
One of the most critical aspects of institutional trading is the understanding of market structure. Institutions study how price moves between areas of liquidity, such as previous highs, lows, support, resistance, and high-volume zones. Since large orders cannot be executed instantly without affecting price, institutions break trades into smaller chunks and execute them strategically around liquidity pools.
Order flow analysis plays a major role here. Institutions track where buy and sell orders are accumulating and position themselves accordingly. Instead of chasing price, they wait for liquidity to come to them. This is why markets often move sharply after consolidations—liquidity is collected before the real move begins.
Accumulation and Distribution Strategies
Institutions operate through accumulation and distribution phases. During accumulation, large players quietly build positions at favorable prices without alerting the market. This often appears as sideways price action with low volatility. Retail traders frequently lose patience during these phases, unaware that institutions are preparing for a significant move.
Once accumulation is complete, institutions push the price higher (or lower in bearish scenarios) to distribute their positions. Distribution typically happens during high volatility, news events, or strong trending moves, where retail participation increases. By the time retail traders enter aggressively, institutions are often reducing or exiting positions.
Trend-Following and Position Trading
Many institutions rely heavily on trend-following strategies, especially in equities, commodities, and currencies. These strategies are based on the idea that strong trends tend to persist due to macroeconomic forces, capital flows, and investor behavior. Institutions enter trends early using technical and fundamental confirmations and hold positions for weeks, months, or even years.
Position trading allows institutions to avoid noise and short-term fluctuations. They use tools like moving averages, market structure breaks, macroeconomic data, and sector rotation analysis to stay aligned with dominant trends. Risk is managed through portfolio diversification rather than tight stop-losses alone.
Mean Reversion and Statistical Arbitrage
Another powerful institutional approach is mean reversion, which assumes that prices tend to revert to their historical averages over time. Institutions identify overbought or oversold conditions using statistical models, volatility measures, and historical price behavior. These strategies are often automated and executed across hundreds or thousands of instruments simultaneously.
Statistical arbitrage takes this concept further by exploiting pricing inefficiencies between correlated assets. For example, if two historically correlated stocks diverge abnormally, institutions may short the overperformer and buy the underperformer, expecting convergence. These strategies rely heavily on data, probability, and mathematical precision rather than market prediction.
High-Frequency and Algorithmic Trading
Large institutions deploy algorithmic trading systems to execute trades efficiently and minimize market impact. Algorithms determine optimal entry points, execution speed, order size, and timing. High-frequency trading (HFT) firms operate on extremely short timeframes, profiting from tiny price discrepancies repeated thousands of times per day.
While retail traders cannot compete directly in this space, understanding algorithmic behavior helps explain sudden price spikes, liquidity gaps, and rapid reversals. These movements are often liquidity-driven rather than sentiment-driven.
Risk Management as the Foundation
Risk management is the backbone of all institutional trading strategies. Institutions define risk before entering any trade. Position sizing is calculated based on portfolio exposure, volatility, and correlation with other holdings. Losses are accepted as part of the business, but they are controlled and planned.
Institutions rarely risk more than a small percentage of their capital on a single idea. Hedging is also widely used, employing derivatives such as options and futures to protect portfolios against adverse movements. This disciplined approach ensures survival during unfavorable market conditions.
Fundamental and Macro-Based Strategies
Many institutional traders integrate fundamental analysis into their decision-making. This includes studying interest rates, inflation, central bank policies, earnings reports, geopolitical developments, and economic cycles. Macro-driven strategies aim to capture large, long-term moves driven by shifts in global capital flows.
For example, a change in monetary policy can influence currency trends, bond yields, and equity valuations simultaneously. Institutions position themselves across multiple asset classes to benefit from these macroeconomic shifts.
Psychology and Patience
Institutional traders operate with extreme patience. They wait for ideal conditions, execute with precision, and allow trades to develop naturally. Emotional decision-making is minimized through systems, rules, and team-based oversight. This psychological stability gives institutions a significant edge over emotional retail traders.
They also understand that being inactive is a strategic choice. Not trading is often more profitable than forcing trades in uncertain conditions.
Lessons Retail Traders Can Learn
Retail traders cannot replicate institutional resources, but they can adopt institutional principles. Focusing on market structure, liquidity, risk management, patience, and disciplined execution can dramatically improve trading performance. Avoiding impulsive trades and aligning with higher time-frame trends brings retail behavior closer to professional standards.
Conclusion
Institutional trading strategies are built on structure, discipline, data, and long-term thinking. Institutions succeed not because they predict markets perfectly, but because they manage risk effectively, understand liquidity dynamics, and operate with patience and precision. By studying how institutional traders think and act, individual traders can gain a deeper understanding of market behavior and significantly improve their own trading approach.

Divergence Secrets How Expiry Works in Options
In India:
Weekly expiry happens every Thursday.
Monthly expiry occurs on last Thursday.
On expiry:
ITM options are settled at intrinsic value.
OTM options expire worthless.
Most premium erosion happens near expiry due to time decay.

Part 2 Support and ResistanceRisks in Option Trading
Option trading can be rewarding but has risks:
1. For Buyers
High probability of premium loss (because theta works against them).
Market must move fast and in the right direction.
2. For Sellers
Unlimited loss possible (especially in naked selling).
Requires big margin.
High stress during volatile markets.

Part 1 Support and Resistance 1. Low Capital Requirement
You can control a large position with a small premium.
2. Hedging Risks
Investors hedge portfolios using Puts to protect against market drops.
3. Speculation
Traders predict short-term movements using calls and puts.
4. Income Generation
Sellers earn regular income from premium writing strategies (covered call, short straddle, iron condor, etc.).
5. Flexibility
Options allow bullish, bearish, neutral, and even volatility-based strategies.

Part 2 Intraday Trading Master Class1. Option Buyer (Call Buyer or Put Buyer)
Pays premium.
Risk is limited to the premium paid.
Profit is unlimited (Call) or large (Put).
2. Option Seller/Writer (Call Writer or Put Writer)
Receives premium.
Risk can be unlimited (Call writer).
Profit is limited to the premium received.
3. Retail Traders
Most common segment in options.
4. Institutional Traders (FIIs, DIIs)
They use options for hedging and arbitrage with high capital.

Part 1 Intraday Trading Master Class How Option Pricing Works
Option prices (premiums) depend on multiple factors:
1. Underlying Price Movement
Biggest factor.
CE rises when market rises.
PE rises when market falls.
2. Time to Expiry (Theta)
As expiry approaches, options lose value due to time decay.
Buyers suffer from theta.
Sellers benefit from theta.
3. Volatility (Vega)
Higher volatility = higher premiums.
4. Demand–Supply and Market Sentiment
Aggressive buying or selling changes premium rapidly.

Tremendous FALL and RECOVERY of LMT on News & Sentiments1st News
- Donald Trump said that he would not permit dividends or stock buybacks for U.S. defense companies until they fix military equipment production and delivery issues.
- Now it is required to understand that dividends are payouts to shareholders out of profits
- Generally, when dividends are not paid, the company uses the retained fund in its development, research, investing, etc.
But what's the matter? Why is he not allowing defense companies to pay dividends to their shareholders??
- Basically, he is criticizing the defense industry for prioritizing shareholder payouts over investing in factories, R&D, and faster production of military equipment.
- He also suggested capping executive pay until those issues are resolved.
Impact: The stock prices of LMT fell 7% during the regular trading hours upon the ban on shareholders' payout
--------------------------------------------------------------------------------------------------------------
2nd News
President Trump announced that he is determined to increase the US Military budget to $1.5 trillion in 2027 due to “tremendous” tariff revenue.
This would be a near 70% increase from 2025 levels.
Impact: Later, in the extended trading hours, prices recovered substantially, rising ~8.30% on the announcement of a hike in the defense budget

Part 12 Trading Master Class Key Terminologies in Option Trading
1. Strike Price
The price at which the buyer can exercise the option.
2. Premium
The cost paid by the option buyer to the seller for the contract.
3. Expiry
The date when the option contract expires (weekly/monthly).
4. In-the-Money (ITM)
When the option has intrinsic value.
CE is ITM if underlying > strike.
PE is ITM if underlying < strike.
5. Out-of-the-Money (OTM)
When the option has no intrinsic value.
CE is OTM if underlying < strike.
PE is OTM if underlying > strike.
6. Lot Size
Options trade in fixed quantities called lots (e.g., NIFTY lot size = 50).

Part 11 Trading Master ClassWhat Are Options?
Options are financial contracts that derive their value from an underlying asset such as:
A stock (e.g., Reliance)
An index (e.g., NIFTY 50)
A commodity (e.g., Gold)
A currency pair
Options are called derivatives because their price derives from the underlying market.
There are two types of options:
1. Call Option (CE)
A Call Option gives the buyer the right to buy the underlying asset at a fixed price (strike price) before expiry.
Buyers expect price to rise.
Sellers (writers) expect price to stay below strike.
2. Put Option (PE)
A Put Option gives the buyer the right to sell the underlying asset at a strike price before expiry.
Buyers expect price to fall.
Sellers expect price to stay above strike.

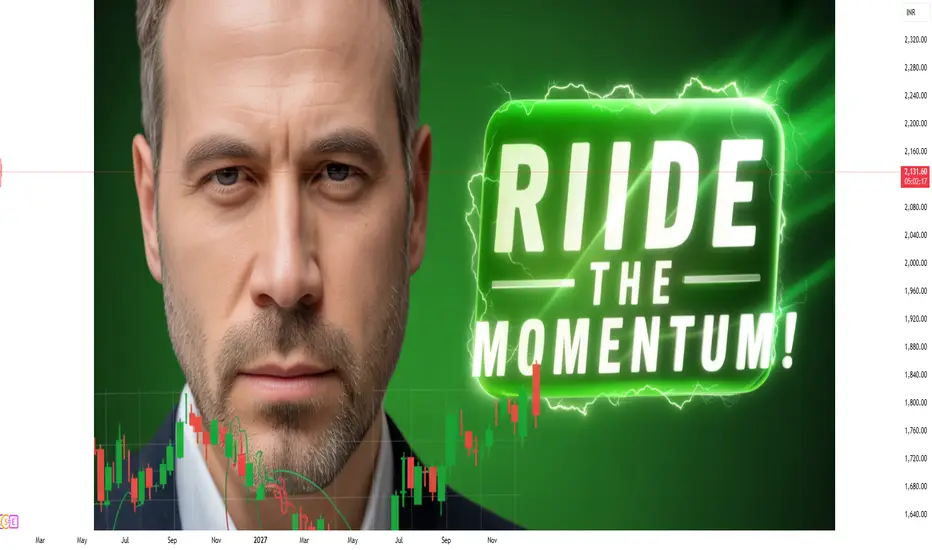
Turning Market Strength into Consistent Trading OpportunitiesRide the Momentum:
In financial markets, momentum is one of the most powerful forces driving price movement. When prices start moving strongly in one direction, they often continue in that direction longer than most traders expect. The concept of “riding the momentum” is about identifying these strong moves early, entering with confirmation, and staying with the trend until clear signs of weakness appear. This approach is widely used by professional traders because it aligns trading decisions with market psychology, liquidity flow, and institutional behavior.
Understanding Momentum in the Market
Momentum refers to the speed and strength of price movement over a given period. When buyers dominate, prices rise quickly and steadily; when sellers dominate, prices fall with force. Momentum is not random—it is fueled by news, earnings, economic data, sentiment, and large institutional orders. Once a strong move begins, it attracts more participants, creating a self-reinforcing cycle.
Momentum trading does not try to predict tops or bottoms. Instead, it focuses on participating in the middle of the move, where probability and volume are highest. This mindset shift is crucial because many traders lose money trying to catch reversals rather than following strength.
Why Momentum Works So Well
Momentum works because markets are driven by human emotions such as fear, greed, and urgency. When prices rise rapidly, fear of missing out (FOMO) pushes more traders to buy. Similarly, when prices fall sharply, fear accelerates selling. Institutions, hedge funds, and algorithmic traders often build large positions over time, not in a single transaction. Their continuous buying or selling creates sustained momentum.
Another reason momentum strategies succeed is liquidity. Strong moves usually occur in stocks or indices with high volume. This makes entry and exit easier and reduces the risk of slippage. Momentum also reflects market consensus—when everyone agrees on direction, price tends to move smoothly.
Identifying Momentum Early
Successful momentum trading begins with identification. Traders look for clear signs that a stock, index, or asset is entering a strong phase. Common characteristics include higher highs and higher lows in an uptrend, or lower highs and lower lows in a downtrend. Expanding volume is a key confirmation, as it shows real participation behind the move.
Technical tools such as moving averages, Relative Strength Index (RSI), MACD, and price breakouts help spot momentum. A price breaking above a well-defined resistance with strong volume often signals the start of a momentum move. Similarly, a breakdown below strong support can indicate bearish momentum.
Entry Strategies for Riding Momentum
Timing the entry is critical. Entering too early can result in false breakouts, while entering too late reduces reward-to-risk. The best entries usually occur after a small pullback or consolidation within the trend. This allows traders to join momentum at a better price without fighting the overall direction.
For example, in an uptrend, traders may wait for price to pull back to a short-term moving average or previous resistance turned support. When price resumes upward movement with volume, it confirms that momentum is intact. This approach improves accuracy and reduces emotional decision-making.
Staying in the Trade: Letting Winners Run
One of the biggest advantages of momentum trading is the ability to capture large moves. However, many traders exit too early due to fear of losing unrealized profits. Riding momentum requires discipline and trust in the trend. Instead of focusing on small price fluctuations, traders should watch the overall structure and strength of the move.
Trailing stop-losses are commonly used to stay in momentum trades. As price moves in favor of the trade, the stop is gradually adjusted to lock in profits while allowing room for natural pullbacks. This method protects capital without cutting winning trades short.
Risk Management in Momentum Trading
While momentum offers high reward potential, it also carries risk. Strong moves can reverse quickly, especially after extended runs. Proper risk management is essential to survive long-term. Traders should always define risk before entering a trade, using fixed position sizing and stop-loss levels.
A common rule is to risk only a small percentage of capital on each trade. This ensures that even a series of losing trades does not significantly damage the account. Momentum traders also avoid overtrading, focusing only on high-quality setups rather than chasing every move.
Common Mistakes to Avoid
One of the most common mistakes in momentum trading is chasing price after it has already moved too far. Late entries often result in buying near the top or selling near the bottom. Another mistake is ignoring market context. Momentum works best in trending markets; during sideways or low-volatility conditions, momentum signals often fail.
Emotional trading is another major issue. Fear of missing out leads to impulsive entries, while fear of loss causes premature exits. Successful momentum traders follow a predefined plan and remain patient, understanding that not every move needs to be traded.
Momentum Across Different Time Frames
Momentum exists on all time frames, from intraday charts to long-term investments. Day traders may ride momentum for minutes or hours, while swing traders hold positions for days or weeks. Even long-term investors use momentum principles to stay invested in strong sectors or stocks while avoiding weak ones.
The key is consistency. Traders should choose a time frame that matches their personality, capital, and lifestyle, then apply momentum principles consistently within that framework.
The Mindset of a Momentum Trader
Riding the momentum is as much about mindset as it is about strategy. It requires patience to wait for the right setup, confidence to stay in winning trades, and humility to exit when momentum fades. Momentum traders accept that losses are part of the game, but they focus on maximizing gains when the market moves strongly in their favor.
Instead of fighting the market, they move with it. This alignment with market direction reduces stress and increases long-term profitability.
Conclusion
Riding the momentum is a powerful and time-tested trading approach that leverages the natural behavior of financial markets. By focusing on strength, volume, and trend confirmation, traders can participate in high-probability moves with controlled risk. Success in momentum trading comes from discipline, patience, and consistent execution rather than prediction.
When traders learn to respect momentum and let the market lead the way, they shift from reactive decision-making to strategic participation. Over time, this approach builds confidence, consistency, and the ability to capitalize on the market’s most profitable opportunities.
Part 12 Trading Master ClassOption Trading in the Indian Market
In India, the most actively traded options are:
NIFTY
BANKNIFTY
FINNIFTY
SENSEX
Stocks like Reliance, HDFC Bank, TCS, Infosys
Weekly expiries have increased retail participation significantly.

Part 9 Trading Master ClassWhy Trade Options?
Option trading offers several advantages:
A. Leverage
Options allow you to control large positions with small capital.
For example, instead of buying shares worth ₹2,00,000, you may buy a call option for just ₹5,000.
B. Flexibility
Options let you trade bullish, bearish, or neutral markets.
C. Hedging
Investors use options to protect portfolio losses—like buying insurance.
D. Income Generation
Selling options earns premium income every expiry.
E. Risk Management
Defined-risk strategies like spreads help in controlled exposure.

Part 8 Trading Master ClassHow Option Trading Works
Unlike stock trading where you buy shares directly, in option trading you buy contracts. Each contract controls a certain quantity of the underlying asset.
Example:
If NIFTY is trading at 24,000 and you buy a NIFTY 24,000 CE, you are purchasing a call option with strike 24,000. If NIFTY moves above this level before expiry, your call option gains value.
In options, your potential loss is limited to premium paid, but profits can be unlimited for calls and substantial for puts. This limited risk attracts many traders.

Part 7 Trading Master Class What Are Options?
Options are financial derivatives, meaning their value is derived from an underlying asset such as stocks, indices, commodities, or currencies.
An option is a contract that gives the buyer the right, but not the obligation, to buy or sell the underlying asset at a predefined price before or on a fixed date.
There are two types of options:
1. Call Option
Gives the right to buy.
A trader buys a call if they expect the price of the underlying asset to go up.
2. Put Option
Gives the right to sell.
A trader buys a put if they expect the price to go down.
Each option has:
Strike Price: The price at which buying/selling occurs.
Expiry Date: The last date the contract is valid.
Premium: The price paid to buy the option.

Agile practitioner + FinTech data-driven trader + execution discFrom 2011 to 2025, my professional journey has evolved at the intersection of Agile delivery, financial markets, and data-driven execution. What began as hands-on trading gradually transformed into a structured FinTech-oriented practice, shaped by the same principles I applied in technology and product environments—empiricism, continuous improvement, and disciplined execution. Today, my work reflects a hybrid professional identity: a trader who operates with the mindset of an Agile practitioner and the rigor of a data-led market operator.
Over the years, I built a comprehensive analytical framework using EMA structures, RSI momentum, VWAP alignment, trendlines, Bollinger Band volatility, and stochastic oscillators to guide execution across intraday and positional timeframes. These indicators are not treated as standalone signals but integrated into a confluence-based system, much like backlog prioritisation in Agile—where decisions are driven by validated data rather than intuition. This approach positioned my trading as a FinTech-style discipline, grounded in repeatability, transparency, and measurable outcomes.
As my practice matured, I expanded into derivatives and market microstructure analysis, incorporating gamma exposure, theta decay patterns, option-chain behaviour, pivot levels, and institutional buy–sell data. I further aligned my execution with FII and DII flow analytics, allowing me to interpret price movement within the context of capital rotation rather than isolated price action. This multi-layered framework mirrors Agile operating models: short feedback loops, rapid hypothesis testing, and continuous calibration based on real-time data.
Between 2020 and 2025, I formalised this methodology into rule-based execution models for index options and high-liquidity equities. These models embedded Agile principles directly into trading discipline—fixed time-boxed execution windows, predefined risk thresholds, post-trade retrospectives, and behavioural checkpoints. The result was a measurable shift from reactive trading to system ownership, where consistency, drawdown control, and process adherence became core performance metrics.
Today, my professional identity is defined not by individual trades, but by the decision systems I design to operate under uncertainty. By combining Agile practices with FinTech-style analytics, I have built a trading discipline that reflects international standards of execution governance, data integrity, and continuous improvement. This journey represents more than personal growth—it demonstrates the ability to translate Agile leadership and data-driven thinking into high-stakes financial environments, forming the foundation of my contribution to the global FinTech and trading ecosystem.

Profit with Options: Strategies, Principles, Practical Insights1. Understanding Options and Their Profit Potential
An option is a financial derivative that gives the buyer the right, but not the obligation, to buy or sell an underlying asset at a specific price (strike price) before or on a specified date (expiry).
Call options allow profits when the price of the underlying asset rises.
Put options allow profits when the price of the underlying asset falls.
Options profit potential comes from leverage. A relatively small investment (premium) can control a large value of the underlying asset. This leverage amplifies gains but also increases risk, making knowledge and planning essential.
2. Profit with Options in Bullish Markets
In bullish market conditions, traders expect prices to rise. Options offer multiple ways to profit from this expectation:
Buying Call Options: Profits increase as the underlying price rises above the strike price plus premium paid.
Bull Call Spreads: Buying a call at a lower strike and selling a call at a higher strike reduces cost and risk while capping profit.
Selling Put Options: Traders earn premium income if the asset stays above the strike price.
These strategies allow traders to benefit from upward movement with controlled risk compared to buying stocks outright.
3. Profit with Options in Bearish Markets
Options are equally effective in bearish conditions:
Buying Put Options: Profits grow as the underlying price falls below the strike price.
Bear Put Spreads: Lower cost strategies that limit both risk and reward.
Selling Call Options: Generates income if prices remain below the strike price.
This ability to profit in falling markets makes options especially attractive during economic slowdowns or market corrections.
4. Profit with Options in Sideways Markets
One of the biggest advantages of options is the ability to profit even when markets do not move significantly:
Option Selling Strategies: Selling calls or puts benefits from time decay (theta).
Iron Condors and Straddles: Designed to profit when prices remain within a defined range.
Calendar Spreads: Profit from differences in time decay between short-term and long-term options.
In range-bound markets, option sellers often have an edge due to the natural erosion of option value over time.
5. Role of Time Decay and Volatility
Two critical factors determine option profitability:
Time Decay (Theta): Options lose value as expiry approaches. Sellers benefit from this, while buyers must overcome it through strong price movement.
Volatility (Vega): Rising volatility increases option premiums, benefiting buyers. Falling volatility benefits sellers.
Understanding when to buy options (low volatility) and when to sell options (high volatility) significantly improves profit consistency.
6. Risk Management in Options Trading
While options offer high profit potential, risk management is crucial:
Always define maximum loss before entering a trade.
Use spreads instead of naked positions to limit downside.
Avoid over-leveraging capital in a single trade.
Maintain a proper risk-to-reward ratio, ideally risking less to gain more.
Professional option traders focus more on capital protection than aggressive profit chasing.
7. Profit with Options through Hedging
Options are widely used as insurance for portfolios:
Protective Puts safeguard long-term investments from sudden market crashes.
Covered Calls generate additional income on stock holdings.
Though hedging may reduce short-term profit, it stabilizes long-term returns and protects capital during market uncertainty.
8. Importance of Strategy Selection
There is no single best option strategy. Profitability depends on:
Market direction (bullish, bearish, neutral).
Volatility levels.
Time horizon.
Successful traders match strategies to market conditions rather than forcing trades. Discipline and patience often determine long-term success.
9. Psychology and Discipline in Options Profit
Options trading demands emotional control:
Avoid revenge trading after losses.
Stick to predefined rules and strategies.
Accept that losses are part of the process.
Consistent profits come from process-driven trading, not impulsive decisions.
10. Long-Term Perspective on Option Profits
Options are not a get-rich-quick tool. Sustainable profits come from:
Continuous learning and practice.
Back-testing strategies.
Adapting to changing market dynamics.
Traders who treat options as a professional skill rather than speculation tend to achieve long-term profitability.
Conclusion
Profit with options is achievable across all market conditions when approached with knowledge, discipline, and proper risk management. Options provide flexibility unmatched by other instruments, allowing traders to design strategies tailored to their market outlook and risk appetite. By understanding option mechanics, leveraging time decay and volatility, applying disciplined strategies, and managing risk effectively, traders can convert options into a consistent and powerful profit-generating tool in the financial markets.

Risk Management in Trading: How to Avoid Big Trading LossesUnderstanding Risk in Trading
Risk in trading refers to the possibility of losing part or all of your invested capital due to adverse market movements. Every trade carries uncertainty because markets are influenced by countless factors such as economic data, global events, institutional activity, and market psychology. A trader who ignores this uncertainty often overexposes themselves, leading to large and sometimes irreversible losses. Recognizing that risk is unavoidable is the first step toward controlling it.
Capital Preservation Comes First
The primary goal of risk management is capital preservation. If you lose a large portion of your trading capital, it becomes mathematically harder to recover. For example, a 50% loss requires a 100% gain just to break even. This is why professional traders prioritize protecting their capital over chasing profits. Staying in the game is more important than making quick money.
Position Sizing: The Core of Risk Control
One of the most effective tools in risk management is proper position sizing. Position sizing determines how much capital you allocate to a single trade. A common rule followed by disciplined traders is risking only 1–2% of total trading capital on any single trade. This means that even if several trades fail consecutively, the overall damage to the account remains manageable. Proper position sizing ensures that emotions remain under control and trading decisions stay rational.
Use of Stop-Loss Orders
Stop-loss orders are essential for avoiding big losses. A stop-loss defines the maximum loss you are willing to accept on a trade before entering it. Without a stop-loss, traders often fall into the trap of holding losing positions, hoping the market will reverse. This behavior can turn small losses into devastating ones. A predefined stop-loss enforces discipline and removes emotional decision-making during volatile market conditions.
Risk-Reward Ratio Matters
A favorable risk-reward ratio is a key principle of long-term profitability. This ratio compares the potential loss of a trade to its potential gain. For example, risking ₹1 to make ₹2 gives a 1:2 risk-reward ratio. Even if you are right only 40–50% of the time, a good risk-reward structure can keep you profitable. Traders who accept large risks for small rewards often face consistent losses despite a high win rate.
Avoid Overtrading
Overtrading is one of the most common causes of large trading losses. It occurs when traders take too many trades due to boredom, revenge trading after losses, or the fear of missing out (FOMO). Each trade carries risk, and excessive trading increases exposure unnecessarily. A well-defined trading plan with strict entry criteria helps reduce overtrading and improves overall performance.
Diversification and Market Selection
Putting all your capital into one asset, one sector, or one type of trade increases risk significantly. Diversification helps spread risk across different instruments or strategies. While diversification does not eliminate losses, it reduces the impact of a single adverse event. At the same time, traders should avoid over-diversification, which can dilute focus and lead to poor execution.
Emotional Discipline and Psychology
Emotions such as fear, greed, hope, and frustration are major contributors to big trading losses. Fear can cause premature exits, while greed can lead to oversized positions. Revenge trading after a loss often results in even bigger losses. Strong risk management rules act as a psychological safety net, helping traders stay calm and disciplined regardless of market conditions.
Leverage: A Double-Edged Sword
Leverage allows traders to control larger positions with smaller capital, but it also magnifies losses. Many traders blow their accounts by misusing leverage. High leverage combined with poor risk management can wipe out an account in minutes. Sensible use of leverage, aligned with strict stop-losses and position sizing, is essential to avoid catastrophic losses.
Adapting to Market Conditions
Markets are dynamic, and risk levels change with volatility. During high-volatility periods such as major news events or earnings announcements, price swings can be unpredictable. Reducing position size or staying out of the market during such times is a smart risk management decision. Flexibility and adaptability are crucial traits of successful traders.
Keep a Trading Journal
A trading journal is a powerful tool for improving risk management. By recording entry reasons, position size, stop-loss levels, emotions, and outcomes, traders can identify patterns that lead to losses. Over time, this self-analysis helps refine strategies, eliminate costly mistakes, and strengthen discipline.
Consistency Over Perfection
Many traders aim for perfect entries and high win rates, but consistency is far more important. A trader who follows risk management rules consistently will outperform a trader who occasionally makes big gains but suffers massive losses. Small, controlled losses are part of the trading process and should be accepted without emotional distress.
Long-Term Perspective
Risk management encourages a long-term mindset. Instead of focusing on daily profits or losses, traders should evaluate performance over a series of trades. This approach reduces emotional pressure and promotes logical decision-making. Successful trading is a marathon, not a sprint.
Conclusion
Avoiding big trading losses is not about predicting the market with absolute accuracy; it is about managing risk intelligently. Proper position sizing, disciplined use of stop-losses, favorable risk-reward ratios, emotional control, and capital preservation form the foundation of effective risk management. Traders who respect risk survive market downturns, learn from mistakes, and compound their capital steadily over time. In trading, protecting what you have is the first step toward achieving what you want.

Understanding Market Structure Through Traded VolumeVolume Profile Analysis is a powerful market analysis technique that focuses not on time, but on price and volume interaction. Unlike traditional volume indicators that show how much volume was traded during a specific time period, volume profile reveals where trading activity was concentrated across different price levels. This makes it an essential tool for traders and investors who want to understand market structure, identify high-probability trade zones, and align themselves with institutional activity.
At its core, volume profile answers one crucial question: At which prices did the market accept value, and at which prices did it reject value? Understanding this distinction helps traders make better decisions about entries, exits, and risk management.
1. What Is Volume Profile?
Volume Profile is an advanced charting tool that displays a horizontal histogram on the price axis. This histogram shows the amount of volume traded at each price level over a selected period. Instead of vertical bars representing volume over time, volume profile shifts the focus horizontally, offering a clearer picture of price acceptance and rejection.
This tool is widely used by professional traders, proprietary desks, and institutions because it reflects real participation, not just price movement. Markets can move rapidly with low volume, but such moves are often unreliable. Volume profile helps traders identify where strong participation occurred and where moves lack conviction.
2. Key Components of Volume Profile
Volume profile is built around a few critical concepts that every trader must understand:
Point of Control (POC)
The POC is the price level where the highest volume was traded during the selected period. It represents the fairest price where buyers and sellers agreed most. Markets tend to gravitate toward the POC because it reflects balance and consensus.
Value Area (VA)
The value area is the price range where approximately 70% of total traded volume occurred. It is divided into:
Value Area High (VAH)
Value Area Low (VAL)
Prices inside the value area represent acceptance, while prices outside it indicate rejection or imbalance.
High Volume Nodes (HVN)
HVNs are price levels with heavy trading activity. They act as strong support or resistance zones because many positions are built there.
Low Volume Nodes (LVN)
LVNs are price levels with little trading activity. Price moves quickly through these areas, making them ideal for breakouts or fast directional moves.
3. Why Volume Profile Is Important
Volume profile gives traders a three-dimensional view of the market. While price shows direction and indicators show momentum, volume profile shows market intent.
Its importance lies in:
Identifying institutional accumulation and distribution
Filtering false breakouts
Understanding true support and resistance
Improving trade timing and accuracy
Enhancing risk-reward ratios
Markets are driven by large participants. Volume profile helps retail traders align with these larger forces instead of trading blindly based on indicators.
4. Market Phases Through Volume Profile
Volume profile clearly reveals different market phases:
Balanced Market (Range-Bound)
In balanced conditions, the profile is wide and bell-shaped. The POC remains stable, and price oscillates within the value area. Range trading strategies work best here.
Imbalanced Market (Trending)
In trending conditions, the profile shifts upward or downward, forming elongated shapes. The POC migrates in the direction of the trend, confirming strength.
Transition Phase
When price moves outside the value area and builds volume at new levels, the market transitions into a new balance. This phase often offers the best trading opportunities.
5. Using Volume Profile for Support and Resistance
Traditional support and resistance lines are subjective. Volume profile offers objective levels based on actual traded volume.
HVNs act as strong support/resistance zones.
VAH and VAL often behave like dynamic resistance and support.
POC works as a magnet price, pulling price back during consolidation.
These levels are more reliable than trendlines because they reflect real market participation.
6. Breakout and Rejection Analysis
Volume profile is highly effective in distinguishing real breakouts from fake ones.
A breakout above VAH with strong volume acceptance indicates trend continuation.
A move above VAH followed by quick rejection back into the value area signals a false breakout.
LVNs above or below value areas often become breakout targets.
This ability to read acceptance versus rejection makes volume profile invaluable for intraday, swing, and positional traders.
7. Entry and Exit Strategy Using Volume Profile
Traders can use volume profile to refine entries and exits:
Entries
Buy near VAL in an uptrend
Sell near VAH in a downtrend
Enter breakouts from LVNs with confirmation
Exits
Partial profits near POC or HVNs
Full exits near opposite value area boundaries
Trail stops beyond low-volume zones
This structured approach improves consistency and reduces emotional trading.
8. Volume Profile Across Timeframes
Volume profile works across all timeframes:
Intraday traders use session volume profiles
Swing traders use weekly or monthly profiles
Investors analyze long-term composite profiles
Higher timeframe volume levels always carry more weight and should be respected even when trading lower timeframes.
9. Combining Volume Profile with Other Tools
Volume profile is most effective when combined with:
Price action
Market structure
VWAP
Trend analysis
Candlestick patterns
It should not be used in isolation. Instead, it acts as a context tool, helping traders understand where trades make sense and where they do not.
10. Common Mistakes in Volume Profile Analysis
Many traders misuse volume profile by:
Ignoring market context
Overloading charts with multiple profiles
Trading every LVN without confirmation
Treating POC as a guaranteed reversal level
Discipline and proper interpretation are essential to extract its full potential.
11. Psychological Edge of Volume Profile
Volume profile enhances trading psychology by:
Providing clear reference levels
Reducing guesswork
Increasing confidence in trade decisions
Encouraging patience and discipline
When traders understand where value lies, they stop chasing price and start trading with logic.
12. Conclusion
Volume Profile Analysis is one of the most insightful tools for understanding market behavior. By focusing on where volume is traded rather than when, it reveals the true structure of the market. It helps traders identify value, spot institutional activity, and distinguish between genuine moves and false signals.
For traders seeking consistency, clarity, and a deeper understanding of price action, volume profile is not just an indicator—it is a framework for thinking about markets. Mastery of volume profile can significantly elevate trading performance when combined with sound risk management and disciplined execution.

A Step-by-Step Guide to Efficient and Disciplined TradingSimple Trade Execution:Below is a detailed point-wise explanation (approximately 1000 words) that clearly explains the concept of simple trade execution, suitable for beginners as well as intermediate traders.
1. Meaning of Simple Trade Execution
Simple trade execution refers to the process of entering, managing, and exiting a trade in the financial markets using clear, predefined, and easy-to-follow rules.
It focuses on clarity, discipline, and consistency, rather than complex strategies or excessive indicators.
The goal is to reduce emotional decision-making and execution errors.
2. Importance of Trade Execution in Trading
Even the best trading strategy fails if execution is poor.
Proper execution ensures that trades are placed at the right price, time, and quantity.
Slippage, delays, and emotional reactions can significantly reduce profitability.
Simple execution helps traders remain focused and calm during volatile market conditions.
3. Clear Trading Plan as the Foundation
Simple execution begins with a well-defined trading plan.
The plan must include:
Entry criteria
Exit criteria
Stop-loss rules
Position size
Without a plan, execution becomes random and inconsistent.
4. Identifying the Trade Setup
A trade setup is the condition under which a trader decides to enter a trade.
Simple setups may include:
Support and resistance levels
Trend continuation patterns
Breakouts with confirmation
Avoid over-analyzing multiple indicators; clarity improves execution speed.
5. Entry Execution Rules
Entry should be rule-based, not emotional.
Use limit orders or market orders depending on liquidity and volatility.
Enter only when price reaches your predefined level.
Avoid chasing price, as it leads to poor risk-reward outcomes.
6. Choosing the Right Order Type
Market Order: Executes immediately at the current price.
Limit Order: Executes at a specified price or better.
Stop Order: Activates when price reaches a certain level.
Simple traders prefer limit and stop orders to control execution price.
7. Position Sizing for Simple Execution
Position size determines how much capital is allocated to a trade.
A simple rule is to risk only 1–2% of total capital per trade.
Proper sizing ensures emotional stability and long-term survival.
Oversized positions lead to panic and poor execution.
8. Importance of Stop-Loss Placement
Stop-loss protects capital from unexpected market moves.
It should be placed at a logical technical level, not randomly.
Always place stop-loss at the time of trade entry.
Simple execution treats stop-loss as non-negotiable.
9. Risk-Reward Ratio
Simple trade execution focuses on favorable risk-reward ratios.
A common minimum ratio is 1:2 (risk 1 unit to gain 2 units).
High win rates are not necessary if risk-reward is disciplined.
This simplifies decision-making and execution.
10. Trade Confirmation Before Execution
Confirm trades using one or two factors only.
Examples:
Price action near key levels
Volume confirmation
Avoid conflicting signals, which delay execution and create doubt.
11. Timing the Market Entry
Timing matters, but perfection is not required.
Execute trades during high-liquidity sessions for better fills.
Avoid trading during major news releases unless planned.
Simple timing rules reduce execution stress.
12. Avoiding Overtrading
Simple execution emphasizes quality over quantity.
Too many trades increase costs and execution mistakes.
Trade only when setup matches your plan exactly.
Patience is a key execution skill.
13. Managing the Trade After Entry
Once entered, avoid unnecessary interference.
Follow predefined rules for trailing stop-loss or partial exits.
Do not move stop-loss emotionally.
Let the trade play out according to the plan.
14. Exit Execution Strategy
Exit is as important as entry.
Simple exit methods include:
Fixed target exit
Trailing stop exit
Time-based exit
Choose one method and apply it consistently.
15. Handling Losing Trades
Losses are a normal part of trading.
Simple execution accepts losses without emotional reaction.
Do not revenge trade or increase position size after a loss.
Focus on executing the next trade correctly.
16. Handling Winning Trades
Avoid greed after winning trades.
Stick to your exit plan even if market moves further.
Consistency matters more than maximizing every trade.
Simple execution values repeatable profits.
17. Emotional Discipline in Execution
Fear causes early exits; greed causes late exits.
Simple rules remove emotional conflict.
Use checklists before executing trades.
Discipline is built through repetition and journaling.
18. Role of Trading Journal
Maintain a record of executed trades.
Note entry, exit, stop-loss, and emotions.
Review execution mistakes regularly.
Continuous improvement depends on self-analysis.
19. Technology and Execution Speed
Use a reliable trading platform.
Ensure stable internet connection.
Avoid placing trades during platform glitches.
Simple execution requires minimal but reliable tools.
20. Avoiding Common Execution Mistakes
Entering without confirmation
Ignoring stop-loss
Changing plan mid-trade
Trading due to boredom
Overleveraging capital
21. Importance of Routine
Follow a fixed daily trading routine.
Analyze market, execute trades, review performance.
Routine improves execution consistency.
Simplicity thrives on structure.
22. Scalping vs Swing Execution Simplicity
Scalping requires faster execution and higher focus.
Swing trading allows slower, calmer execution.
Beginners benefit more from swing-based simple execution.
Choose style that matches your personality.
23. Capital Preservation Focus
Simple execution prioritizes survival over profits.
Protecting capital ensures long-term participation.
Consistent small gains outperform inconsistent large gains.
Risk control is the core of execution simplicity.
24. Learning Through Repetition
Execution skill improves with practice.
Paper trading helps refine execution without risk.
Gradual transition to real capital builds confidence.
Keep rules unchanged during learning phase.
25. Conclusion: Power of Simple Trade Execution
Simple trade execution is about doing fewer things correctly.
It removes complexity, emotion, and confusion.
Long-term success depends more on execution than strategy.
Consistency, discipline, and clarity are the true edge in trading.

How to Avoid Breakout Traps in TradingUnderstanding What a Breakout Trap Is
A breakout trap occurs when price appears to break an important level such as support, resistance, trendline, or chart pattern boundary, but fails to sustain that move. Instead of continuing in the breakout direction, the market reverses and moves aggressively in the opposite direction. Retail traders often enter late on excitement or fear of missing out, while smart money uses this liquidity to exit or enter opposite positions. Recognizing that markets are driven by liquidity rather than obvious patterns is the first step in avoiding breakout traps.
Importance of Market Context
One of the most effective ways to avoid breakout traps is to analyze the broader market context. Breakouts behave differently depending on whether the market is trending, ranging, or highly volatile. In a strong trending market, breakouts are more likely to succeed. In contrast, range-bound or choppy markets tend to produce frequent false breakouts. Traders should always ask: Is the market trending or consolidating? Entering breakout trades in tight ranges without strong momentum significantly increases the probability of getting trapped.
Volume as a Confirmation Tool
Volume is a critical factor in validating breakouts. A genuine breakout is usually supported by a noticeable increase in volume, reflecting strong participation and conviction. False breakouts often occur on low or average volume, indicating a lack of commitment. If price breaks a level but volume remains weak or declines, it is a warning sign that the move may fail. Traders should avoid entering breakouts that lack volume confirmation and instead wait for clear signs of market participation.
Waiting for Candle Close Confirmation
Many breakout traps happen because traders enter positions the moment price crosses a level. Professional traders often wait for a candle close beyond the breakout level on the chosen timeframe. A close confirms that the market accepted the new price area rather than rejecting it. For example, if resistance is broken intraday but the candle closes below it, the breakout has failed. Patience in waiting for confirmation significantly reduces false entries.
Role of Retest and Pullback
One of the safest ways to trade breakouts is to wait for a retest of the broken level. After a true breakout, price often pulls back to test the former resistance (now support) or former support (now resistance). If the level holds and price shows rejection signals such as strong bullish or bearish candles, the probability of a successful trade increases. Breakout traps often fail during retests, making this approach a powerful filter against false signals.
Avoiding News and High-Volatility Periods
Major economic news, earnings announcements, and central bank decisions often create sharp price spikes that look like breakouts but quickly reverse. These moves are driven by short-term volatility rather than sustainable trend shifts. Trading breakouts during such periods is risky unless one is experienced with news-based strategies. To avoid traps, traders should be aware of the economic calendar and either reduce position size or stay out of the market during high-impact events.
Using Multiple Timeframe Analysis
Analyzing multiple timeframes helps traders identify stronger and more reliable breakouts. A breakout that aligns with higher timeframe trends has a greater chance of success. For example, a breakout on a 15-minute chart that goes against the daily trend is more likely to fail. Checking higher timeframes for trend direction, key levels, and market structure can prevent traders from entering low-probability breakout trades.
Recognizing Liquidity Zones and Stop Hunts
Markets often move toward areas where stop-loss orders are clustered, such as above obvious resistance or below clear support. Smart money may intentionally push price beyond these levels to trigger stops and create liquidity before reversing. Traders should be cautious of breakouts at obvious levels that everyone is watching. Instead of entering immediately, observe price behavior to see whether the breakout is accepted or quickly rejected.
Risk Management and Position Sizing
Even with the best analysis, some breakout traps are unavoidable. Effective risk management ensures that a single false breakout does not cause significant damage. Using predefined stop-loss levels, limiting risk per trade, and maintaining proper position sizing are essential. Stops should be placed logically, not emotionally, and traders should accept small losses as part of the trading process rather than trying to avoid losses entirely.
Emotional Discipline and Patience
Breakout traps often exploit trader psychology, particularly fear of missing out and overconfidence. Emotional trading leads to impulsive entries and poor decision-making. Developing discipline, sticking to a trading plan, and accepting that not every breakout needs to be traded are crucial skills. Sometimes the best trade is no trade, especially when conditions are unclear.
Continuous Review and Learning
Finally, avoiding breakout traps requires continuous learning and self-review. Traders should maintain a journal documenting breakout trades, noting which ones succeeded and which failed. Over time, patterns emerge that highlight common mistakes and areas for improvement. Learning from past traps transforms losses into valuable lessons and strengthens overall trading performance.
Conclusion
Breakout traps are an inevitable part of trading, but they do not have to be devastating. By understanding market context, using volume and confirmation tools, waiting for retests, applying multi-timeframe analysis, and practicing strong risk management, traders can significantly reduce the impact of false breakouts. Success in breakout trading is not about catching every move, but about filtering out low-quality setups and focusing on high-probability opportunities. With patience, discipline, and experience, traders can turn breakout traps from costly mistakes into powerful learning experiences.

Part 6 Introduction to Institutional TradingArbitrage and Risk-Free Strategies
Options allow for advanced structures like:
Box spreads
Conversion and reversal
Put-call parity arbitrage
These take advantage of price differences between options, futures, and stocks to make risk-free or low-risk profit.
Arbitrage is widely used by:
Quant traders
HFT firms
Institutions
This adds liquidity and efficiency to the market.
