Quarterly Results TradingIntroduction
Quarterly results season is one of the most awaited periods in the stock market. For traders and investors alike, it brings excitement, volatility, and opportunities. Every three months, listed companies release their financial performance – revenues, profits, margins, guidance, and other key details. These numbers act as a report card for the company and often determine its short-term price direction.
For traders, this is not just about numbers but about market expectations versus reality. A company may post a strong profit jump, yet the stock could fall because the market expected even better. On the other hand, sometimes, even a small improvement compared to expectations can cause a stock to rally.
Quarterly results trading, therefore, is not simply about reading earnings reports but about understanding the psychology of the market, expectations, and how to position yourself before and after results.
1. Why Quarterly Results Matter
Quarterly results matter because:
Transparency: Companies must show how they are performing every three months, which helps investors evaluate progress.
Guidance: Many managements provide an outlook for upcoming quarters, shaping future stock expectations.
Catalyst for Price Movements: Earnings often trigger sharp stock moves – sometimes 5%, 10%, or even 20% in a single session.
Sectoral Trends: Results reveal which sectors are thriving (IT, banking, auto, FMCG, etc.) and which are struggling.
Macro Signals: Aggregated earnings give insight into the broader economy (e.g., consumer demand, credit growth, exports).
For traders, this creates volatility, and volatility equals opportunity.
2. Market Psychology During Earnings Season
Quarterly results trading is deeply tied to psychology. Here’s how it works:
Expectations vs Reality:
The market often “prices in” expectations before results. If analysts expect a 20% profit growth, and the company delivers only 18%, the stock may fall, even though profits grew.
Rumors & Hype:
Ahead of results, speculation and insider whispers move prices. “Buy on rumor, sell on news” often plays out.
Overreaction:
Investors sometimes overreact to one quarter. A temporary slowdown could cause panic selling, even if the long-term story remains intact.
Guidance Shock:
A company may post strong results but issue weak future guidance – causing a selloff. Conversely, weak results with strong future guidance may spark a rally.
3. Phases of Quarterly Results Trading
Quarterly earnings season typically unfolds in phases:
Pre-Results Run-Up (Speculation Phase):
Stocks often rally or decline based on rumors, channel checks, or analyst previews before official numbers.
Results Day (Volatility Spike):
Stocks witness sharp intraday moves – sometimes with gaps up/down at opening.
Immediate Reaction (1–3 days):
Price stabilizes based on how results compare with expectations and analyst commentary.
Post-Results Trend (1–4 weeks):
Institutional investors re-adjust portfolios, leading to sustained trends.
A good trader aligns strategies with these phases.
4. Key Metrics Traders Watch
When analyzing quarterly results, traders focus on:
Revenue (Top Line): Growth shows demand.
EBITDA & Operating Margin: Profitability efficiency.
Net Profit (Bottom Line): Final earnings after expenses.
Earnings Per Share (EPS): Direct impact on valuations.
Management Commentary/Guidance: Future growth outlook.
Order Book / New Contracts (for IT, infra, manufacturing).
Asset Quality (for Banks/NBFCs): NPA ratios, credit growth.
Volume Growth (for FMCG/Auto): Real demand indicator.
For traders, sometimes just one line in the commentary can swing sentiment.
5. Trading Strategies for Quarterly Results
A. Pre-Results Strategy (Speculative Positioning)
Approach: Buy/sell before results based on expectations.
Risk: Very high – numbers can surprise.
Tip: Suitable for experienced traders who can manage volatility.
B. Results-Day Strategy (Event Trading)
Approach: Trade intraday on sharp moves.
Tactics:
Momentum trading: Enter in direction of breakout.
Straddle/Strangle (Options): Trade volatility without directional bias.
Risk: Requires speed and discipline.
C. Post-Results Strategy (Confirmation Trading)
Approach: Wait for results + market reaction, then take position.
Example: If strong results + positive commentary + high volume buying, then go long for few weeks.
Advantage: Lower risk as clarity emerges.
D. Sector Rotation Strategy
Approach: Use results of large companies to gauge sector trend.
Example: If Infosys and TCS post strong results, smaller IT stocks may rally too.
E. Options Trading Around Results
Implied Volatility (IV): Rises before results due to uncertainty.
Strategy: Sell options after results when IV crashes (“volatility crush”).
Advanced Plays: Earnings straddles, iron condors, covered calls.
6. Case Studies (Indian Market Context)
Case 1: Infosys Quarterly Results
If Infosys posts weak guidance, entire IT sector (TCS, Wipro, HCLTech) reacts negatively.
Example: A 5% fall in Infosys can drag IT index down sharply.
Case 2: HDFC Bank Results
Being the largest bank, its results often set tone for entire banking sector.
NII growth, loan book expansion, and NPAs become benchmarks for peers.
Case 3: Maruti Suzuki Results
Auto stocks move not just on profits but on commentary about demand, chip supply, or new launches.
These show how one company’s results ripple across the market.
7. Risks in Quarterly Results Trading
Quarterly results trading is lucrative but risky. Main risks include:
Gap Openings: Stock may open with a huge gap, giving no chance to enter/exit.
Unexpected Commentary: Good numbers but weak guidance → stock falls.
Over-Leverage: Many traders use derivatives; sudden adverse moves cause big losses.
Noise vs Reality: Temporary slowdown may cause panic, while long-term fundamentals remain solid.
IV Crush in Options: Buying options before results often leads to losses post-results due to volatility collapse.
Risk management (stop-losses, position sizing) is essential.
8. Institutional vs Retail Traders
Institutional Investors:
Rely on detailed models, channel checks, analyst calls, and management interaction. They often position well in advance.
Retail Traders:
Often react after results, chasing momentum. Many fall into traps of speculative positioning without risk control.
Smart Approach for Retail:
Focus more on post-results trends rather than gambling pre-results.
9. Tools for Quarterly Results Trading
Earnings Calendar: NSE/BSE announcements.
Analyst Previews & Consensus Estimates: To know market expectations.
Financial Websites (Moneycontrol, Bloomberg, ET Markets): Quick numbers + commentary.
Charting Tools: Volume analysis, support/resistance for trading.
Options Data (OI, IV): To read market positioning.
10. Best Practices for Traders
Never trade all results – pick familiar sectors/stocks.
Avoid over-leverage; one wrong result can wipe out account.
Use options to hedge positions.
Study sector leaders first, then trade smaller peers.
Focus not just on results but on guidance and commentary.
If unsure, wait for confirmation trend post-results.
11. Long-Term Investor Angle
While traders focus on short-term volatility, long-term investors use quarterly results to:
Track consistent growth.
Evaluate management honesty.
Spot red flags (declining margins, debt buildup).
Accumulate during temporary corrections.
Thus, quarterly results season is not just for traders but also crucial for long-term positioning.
12. Global Context
Quarterly results trading is a global phenomenon:
US Markets: Tech giants like Apple, Amazon, Tesla move entire indices on results.
India: Banks, IT, and Reliance often dominate market direction.
Europe/Asia: Results reflect global demand and supply chain trends.
Indian traders increasingly follow US results (like Nasdaq tech earnings) to predict Indian IT stocks.
13. The Future of Quarterly Results Trading
With AI-driven trading and algorithmic models, quarterly results trading is evolving:
Algo Systems: Scan results instantly and trigger trades in seconds.
Social Media Sentiment: Twitter, Telegram groups influence sentiment.
Data Analytics: Alternative data (app downloads, credit card spending) gives early hints of results.
For retail traders, human intuition + discipline will remain valuable, but tech adoption is rising.
Conclusion
Quarterly results trading is one of the most exciting times in the stock market. It blends fundamentals, technicals, and psychology into a high-volatility environment. For traders, the key lies in understanding expectations, preparing strategies for different phases (pre-results, results day, post-results), and managing risk wisely.
Done right, quarterly results season can offer some of the biggest short-term opportunities in trading. Done wrong, it can lead to painful losses. The difference comes down to preparation, patience, and discipline.
Chart Patterns

Inflation & Interest Rates Shape Commodity PricesIntroduction
Commodities are the building blocks of the global economy. Crude oil fuels industries and transport, metals like copper and aluminum are vital for infrastructure and technology, while agricultural products like wheat, corn, and soybeans feed billions of people. But what truly drives their prices beyond just supply and demand?
Two of the most powerful forces are inflation and interest rates. These economic levers not only dictate consumer purchasing power and business costs, but also ripple through investment flows, currency valuations, and ultimately, the price of commodities across the globe.
In this discussion, we’ll dive deep into how inflation and interest rates shape commodity markets, exploring both theory and real-world cases, while keeping the explanation practical and easy to follow for traders, investors, and learners.
1. The Link Between Commodities and Inflation
1.1 Why Commodities Reflect Inflation
Commodities are often called the “canary in the coal mine” for inflation. That’s because:
When prices of raw materials like oil, metals, and food rise, the cost of finished goods increases.
Rising commodity prices feed into Consumer Price Index (CPI) and Wholesale Price Index (WPI).
This makes commodities not just a victim of inflation but also a driver of inflation.
For example:
If crude oil rises from $60 to $90 per barrel, fuel prices climb, logistics costs rise, and nearly every product (from groceries to electronics) becomes more expensive.
If wheat and corn prices jump, bread, meat, and packaged foods see higher retail prices.
Thus, inflation and commodities have a feedback loop.
1.2 Commodities as an Inflation Hedge
Investors often rush into commodities during inflationary times. Why?
Unlike paper currency, which loses value when inflation is high, commodities retain real value.
Gold, for instance, is historically seen as a store of value when fiat currencies weaken.
Energy and food are unavoidable necessities, so demand remains resilient even when money loses purchasing power.
This means in inflationary phases, commodity demand often rises not just for consumption, but for investment and speculation.
2. The Role of Interest Rates in Commodity Prices
Interest rates—set by central banks like the U.S. Federal Reserve, the RBI in India, or the ECB in Europe—act as the steering wheel of the economy. They determine the cost of borrowing, capital flows, and ultimately, investment appetite.
2.1 High Interest Rates and Commodities
When interest rates rise:
Borrowing becomes expensive, slowing down industrial production and construction.
This reduces demand for industrial commodities like steel, copper, and aluminum.
Investors shift money from risky assets (like commodities) into safe interest-bearing assets (like bonds).
Higher rates strengthen the local currency, which usually pushes commodity prices down (since most commodities are priced in USD).
Example: When the Fed raised interest rates aggressively in 2022, copper and aluminum prices dropped, reflecting weaker industrial demand.
2.2 Low Interest Rates and Commodities
When rates fall:
Borrowing is cheaper, stimulating economic activity.
Demand for commodities like oil, metals, and agricultural goods rises.
Investors seek returns in riskier assets, driving money into commodities and equities.
A weaker currency (due to low rates) often makes dollar-priced commodities cheaper for global buyers, increasing demand.
Example: After the 2008 global financial crisis, the Fed cut rates to near zero. Easy liquidity flooded into commodities, driving gold to record highs above $1,900 by 2011.
3. Inflation + Interest Rates: The Push-Pull Effect
Inflation and interest rates are not independent—they are two sides of the same coin. Central banks raise or lower interest rates mainly to control inflation.
High Inflation → Higher Interest Rates → Commodities pressured
Low Inflation → Lower Interest Rates → Commodities supported
But it’s not always linear. Some commodities, like gold, may rise both when inflation is high and when interest rates are high (if real interest rates are still negative).
4. Commodity-Specific Impacts
Let’s break down how inflation and interest rates affect major categories of commodities.
4.1 Energy (Oil, Natural Gas, Coal)
Inflationary effect: Energy is a primary driver of inflation since it impacts transport, electricity, and production costs. Rising oil prices often signal or cause inflation.
Interest rate effect: Higher rates can reduce oil demand as industries slow, but if inflation is too high, oil can still rise despite rate hikes (e.g., during 2022 Russia-Ukraine conflict).
4.2 Precious Metals (Gold, Silver, Platinum)
Inflationary effect: Gold and silver thrive when inflation is high, as investors use them as a hedge.
Interest rate effect: High interest rates typically hurt gold (since it doesn’t yield interest). However, if inflation exceeds rate levels (negative real interest rates), gold still shines.
4.3 Industrial Metals (Copper, Aluminum, Nickel)
Inflationary effect: Rising input and construction costs lift industrial metal prices.
Interest rate effect: Rate hikes slow housing, manufacturing, and infrastructure demand, weakening these metals.
4.4 Agricultural Commodities (Wheat, Corn, Soybeans, Sugar)
Inflationary effect: Food inflation hits hardest because it’s essential. Rising wages and population growth amplify the impact.
Interest rate effect: Higher rates increase farming credit costs and slow global trade, but food demand remains relatively inelastic.
5. Global Currency Connection
Most commodities are priced in U.S. dollars. That means:
When U.S. interest rates rise, the dollar strengthens, making commodities more expensive for buyers in other currencies → lower demand.
When rates fall, the dollar weakens, boosting demand globally → higher prices.
Thus, the USD Index and commodities often move inversely.
6. Historical Case Studies
6.1 1970s Stagflation
High oil prices + high inflation + weak growth.
Gold surged as an inflation hedge.
Central banks struggled to balance rates without worsening recession.
6.2 2008 Global Financial Crisis
Fed slashed rates → liquidity rush into commodities.
Gold, oil, and copper soared until demand collapsed during the recession.
6.3 2020 Pandemic & 2021–22 Inflation Surge
Initially, oil collapsed (negative prices in April 2020).
Massive stimulus + low rates → commodities roared back in 2021.
By 2022, inflation hit multi-decade highs → Fed hiked rates aggressively → commodity rally cooled except for energy (fueled by Ukraine war).
7. The Trader’s Perspective
For commodity traders and investors, understanding this cycle is critical:
Track inflation indicators (CPI, WPI, PPI).
Follow central bank policy (Fed, RBI, ECB).
Watch bond yields (real vs nominal).
Monitor USD Index (inverse relationship with commodities).
Example:
If inflation is rising but interest rates are low → bullish for commodities.
If inflation is peaking and central banks are hiking rates aggressively → bearish for commodities (except gold sometimes).
8. The Future: AI, Green Energy & Inflation Dynamics
Looking ahead:
Energy transition (from fossil fuels to renewables) will reshape how inflation flows into commodity markets. Lithium, cobalt, and rare earths may act like “new oil.”
AI-driven trading will make interest rate expectations even more quickly reflected in commodity prices.
Geopolitical conflicts will add to supply-driven inflation shocks, as seen in oil and wheat during Russia-Ukraine.
Conclusion
Inflation and interest rates are like the yin and yang of commodity pricing. Inflation fuels higher prices by raising demand for real assets, while interest rates act as the braking system, cooling overheated demand and strengthening currencies.
For traders, investors, and businesses, understanding this balance is essential. Commodities don’t just respond to supply and demand—they are deeply intertwined with monetary policy, global currency flows, and the psychology of inflation.
In simple terms:
Inflation pushes commodities up.
Interest rates can pull them down.
But the net effect depends on timing, central bank actions, and market sentiment.
Mastering this relationship is the key to anticipating commodity price trends in an ever-changing global economy.
Part 8 Trading Master Class Calls & Puts with Real-Life Examples
Call Option Example
Suppose Reliance stock is trading at ₹2,500.
You buy a Call Option with strike price ₹2,600, paying a premium of ₹50.
If Reliance goes to ₹2,800, your profit = (2800 - 2600 - 50) = ₹150 per share.
If Reliance stays below 2600, you lose only the premium = ₹50.
A call option = bullish bet (you expect prices to rise).
Put Option Example
NIFTY is at 22,000.
You buy a Put Option strike 21,800, premium ₹80.
If NIFTY falls to 21,200 → Profit = (21800 - 21200 - 80) = ₹520 per lot.
If NIFTY rises above 21,800, you lose only ₹80.
A put option = bearish bet (you expect prices to fall).
Why Traders Use Options
Options are powerful because they allow:
Leverage – Control large value with small money (premium).
Example: Buying Reliance stock directly at ₹2,500 may cost ₹2.5 lakh (100 shares). But buying a call option may cost just ₹5,000.
Hedging – Protect portfolio from losses.
Example: If you hold Infosys shares, you can buy a put option to protect against downside.
Speculation – Bet on market direction with limited risk.
Income generation – Selling options (covered calls, cash-secured puts) generates steady income.

PCR Trading StrategyMoneyness of Options
Moneyness shows whether the option has intrinsic value:
In the Money (ITM): Already profitable if exercised.
At the Money (ATM): Strike price = market price.
Out of the Money (OTM): No intrinsic value, only time value.
Factors Affecting Option Prices (Option Greeks)
Options are influenced by multiple factors:
Delta: Sensitivity to underlying price changes.
Gamma: Sensitivity of Delta.
Theta: Time decay – options lose value as expiry nears.
Vega: Sensitivity to volatility.
Rho: Sensitivity to interest rates.
Payoff Profiles
Buyer of Call/Put: Limited loss (premium), unlimited profit.
Seller of Call/Put: Limited profit (premium), unlimited or large risk.

Part 2 Support And ResistanceWhy Trade Options?
Leverage – You control large positions with small capital (premium).
Hedging – Protect portfolio from losses. (Insurance-like function).
Speculation – Bet on price movement (up, down, or sideways).
Income Generation – By selling options (collecting premiums).
Example in Real Life
Suppose you think Nifty (index) will go up:
Instead of buying Nifty futures (which needs big margin),
You buy a Nifty Call Option by paying just a small premium.
If Nifty rises, your profit multiplies due to leverage.
If Nifty falls, your maximum loss is only the premium paid.
In simple words: Options = flexibility + leverage + risk control.
They are widely used by retail traders, institutions, and hedgers across the world.

Part 1 Support And ResistanceWhat are Options?
Options are a type of derivative instrument in financial markets.
This means their value is derived from an underlying asset, such as stocks, indices, commodities, or currencies.
An option gives you the right, but not the obligation, to buy or sell the underlying asset at a predefined price (strike price) before or on a specific date (expiry date).
Types of Options
Call Option – Right to buy an asset at a fixed price before expiry.
Example: If you buy a call option of Reliance at ₹2,500, and the stock goes up to ₹2,700, you can still buy at ₹2,500 and profit.
Put Option – Right to sell an asset at a fixed price before expiry.
Example: If you buy a put option of Infosys at ₹1,500, and the stock falls to ₹1,300, you can still sell at ₹1,500 and profit.
Key Terms in Options
Premium – Price you pay to buy the option.
Strike Price – Pre-decided price at which you can buy/sell.
Expiry – The last date till which the option is valid.
ITM (In the Money) – Option has intrinsic value.
OTM (Out of the Money) – Option has no intrinsic value (only time value).

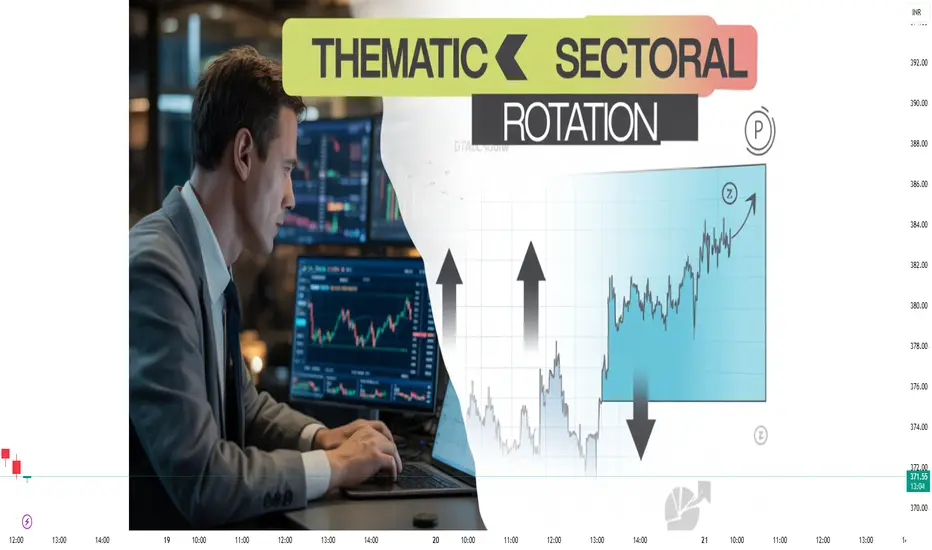
Sectoral Rotation & Thematic TradingIntroduction
The stock market is like a living organism – it breathes, evolves, and reacts differently under various economic and business conditions. If you observe closely, not all stocks move the same way at the same time. Some industries boom while others struggle, depending on interest rates, inflation, consumer demand, government policies, or even global events.
This constant shift of money from one sector to another is called sectoral rotation. Investors and traders who understand this flow can position themselves ahead of the curve, capturing strong returns from sectors that are about to outperform.
Alongside sector rotation, another powerful concept has gained popularity – thematic trading. Instead of focusing on short-term cycles, thematic investing captures long-term structural trends such as digitization, renewable energy, electric vehicles (EVs), artificial intelligence (AI), or climate change. These themes can cut across multiple sectors and create massive wealth opportunities.
Together, sectoral rotation and thematic trading provide a dual framework – one that captures short- to medium-term economic cycles, and another that taps into long-term megatrends. Let’s dive deep into both strategies.
Part 1: Understanding Sectoral Rotation
What is Sectoral Rotation?
Sectoral rotation is the strategy of moving investments across different sectors of the economy based on where money is likely to flow next.
Think of it like this:
During an economic boom, consumer spending rises → retail, automobiles, travel, and entertainment perform well.
When inflation rises, defensive sectors like FMCG, pharma, and utilities outperform because demand for essentials is steady.
In recovery phases, banking, infrastructure, and capital goods tend to benefit as credit and investments flow.
Smart traders ride this rotation of capital to maximize returns.
Why Does Sectoral Rotation Happen?
The economy moves in cycles, and different sectors react differently:
Interest Rate Sensitivity – When rates rise, sectors like banks may benefit (higher margins), while real estate may suffer (loans get costly).
Commodity Prices – High crude oil benefits oil & gas companies but hurts airlines.
Government Policies – A focus on renewable energy, infrastructure spending, or PLI schemes (Production Linked Incentives) boosts specific industries.
Global Trends – A technology boom in the US may spill over to Indian IT companies.
Earnings Cycle – Quarterly results highlight which industries are growing faster.
So, sector rotation is essentially the movement of money chasing relative strength across industries.
Sectoral Rotation and the Economic Cycle
Here’s how different sectors usually perform in economic cycles:
Early Recovery (Post-recession)
Beneficiaries: Banks, capital goods, infrastructure, real estate, auto.
Reason: Cheap money, rising demand, and credit expansion.
Mid-cycle Growth (Boom period)
Beneficiaries: Technology, manufacturing, consumer discretionary, travel, luxury goods.
Reason: Rising consumption and business expansion.
Late-cycle (Inflation & High Growth)
Beneficiaries: Energy, metals, commodities, FMCG, pharma.
Reason: Rising input prices, defensive consumption plays.
Downturn / Recession
Beneficiaries: FMCG, healthcare, utilities.
Reason: Essentials remain stable even in slowdown.
By understanding this cycle, traders can pre-position in sectors before they peak.
Tools & Indicators for Sectoral Rotation
Relative Strength (RS) Analysis – Compare one sector index vs. Nifty 50 to see outperformance.
Sectoral Indices – Nifty Bank, Nifty IT, Nifty FMCG, Nifty Pharma, etc. show trends clearly.
Volume & Price Breakouts – Surging volumes in sector leaders signal capital inflows.
Global Correlations – For IT, look at Nasdaq; for metals, track global commodity prices.
Macro Data – Interest rates, inflation numbers, IIP (Index of Industrial Production).
Sectoral Rotation in Indian Context
In India, sectoral plays are extremely visible:
2017–2019: IT and FMCG were strong as global tech demand rose and consumption stayed stable.
2020 (Covid crash): Pharma and IT outperformed while travel, banking, and autos collapsed.
2021: Banks, metals, real estate, and infra rallied as reopening boosted demand.
2022: Commodities surged due to the Russia-Ukraine war, while IT corrected after huge 2020–21 gains.
2023–2025: Energy transition (renewables, EVs), digital India, and PSU stocks have seen huge money rotation.
This proves sector rotation is not just theory – it’s visible in price action year after year.
Sectoral Rotation Trading Strategies
Rotational Allocation – Regularly move capital into outperforming indices (Bank Nifty, IT, Pharma).
Pair Trading – Go long a strong sector and short a weak one (e.g., Long IT / Short FMCG).
Top-Down Approach – First identify strong sector → then pick leading stocks in that sector.
ETF or Sectoral Funds – For investors who don’t want to pick individual stocks.
Event-Driven Rotation – Budget focus on infra? Buy infra stocks. RBI rate hike? Play banking.
Part 2: Thematic Trading
What is Thematic Trading?
While sectoral rotation looks at cyclical shifts, thematic trading focuses on long-term structural changes in the economy.
A theme is a broad investment idea that goes beyond individual sectors. For example:
Green Energy Theme: Includes solar, wind, EVs, batteries, and related supply chains.
Digital India Theme: Covers IT services, fintech, e-commerce, data centers, semiconductors.
Healthcare Theme: Pharma, diagnostics, insurance, medical devices.
Unlike sector rotation (which is cyclical), thematic investing is secular – it rides megatrends that play out over years or decades.
Why Thematic Trading Works
Government Push – Policies like “Make in India”, “PLI Schemes”, “Atmanirbhar Bharat” create multi-year opportunities.
Global Structural Shifts – AI, automation, and clean energy are not fads – they’re irreversible trends.
Changing Consumer Behavior – Millennials prefer digital payments, EVs, and sustainable products.
Innovation & Technology – Disruptive technologies create new industries from scratch.
Thematic trading aligns your portfolio with where the world is headed.
Popular Themes in India
Renewable Energy & EVs – Adani Green, Tata Power, NTPC Renewables, EV battery makers.
Digital & IT Transformation – Infosys, TCS, Tech Mahindra, SaaS companies, data centers.
Banking & Financial Inclusion – Fintech startups, PSU banks revival, UPI-based payments.
Healthcare & Pharma 2.0 – Biotech, vaccines, hospital chains, digital health platforms.
Infrastructure Boom – Railways, defense, roads, ports, smart cities.
Consumer Growth Story – Premium FMCG, e-commerce, retail, luxury consumption.
AI & Automation – Robotics, semiconductor, chip manufacturing, AI-driven SaaS.
Thematic Trading Strategies
Theme-first, stock-next – Identify a powerful trend → select companies best positioned to benefit.
ETF / Mutual Fund Route – Many thematic mutual funds (IT, infra, pharma) are available.
Long-Term Holding – Unlike rotation, themes require patience (5–10 years horizon).
Event-Based Entry – E.g., Global push for EV → enter when government announces subsidies.
Diversification within Theme – If betting on EV, don’t only buy car makers – also look at battery suppliers, charging infra, mining companies.
Risks in Thematic Trading
Overhype & Bubbles – Not every theme sustains (e.g., dot-com bubble).
Policy Dependency – If subsidies or government support fades, themes collapse.
Concentration Risk – Over-investing in one theme can hurt if it fails.
Execution Risk – Companies may not adapt fast enough to benefit from themes.
Hence, while themes are powerful, one must balance enthusiasm with realism.
Part 3: Combining Sectoral Rotation & Thematic Trading
A smart trader doesn’t choose one over the other – both strategies complement each other.
Sectoral Rotation → Captures short-term cyclical opportunities (3–12 months).
Thematic Trading → Rides long-term structural megatrends (5–10 years).
For example:
Theme: Renewable Energy (10+ years)
Sector Rotation: Within this theme, solar may outperform first, then EV batteries, then power utilities.
By combining both, you get the best of both worlds – short-term timing + long-term conviction.
Practical Framework for Traders & Investors
Macro Analysis First – Track GDP growth, inflation, interest rates, budget, and global trends.
Identify Sector Winners – Use sectoral indices & relative strength to see where money is flowing.
Overlay Themes – Check if the sector fits into a bigger theme (e.g., railways in infra theme).
Stock Selection – Pick leaders (highest market share, strong balance sheet, institutional backing).
Risk Management – Use stop-losses in trading; diversify across themes for investing.
Review & Rotate – Monitor quarterly results, news, and policy changes.
Case Studies
Case 1: Indian IT Boom (2000s–2020s)
Theme: Global digitization and outsourcing.
Sectoral Rotation: IT outperformed whenever global tech demand surged, then corrected during recessions.
Result: Infosys, TCS, Wipro created massive wealth.
Case 2: Renewable Energy (2020s)
Theme: Green energy transition.
Sectoral Rotation: Solar companies first, then EV batteries, then hydrogen economy.
Result: Adani Green, Tata Power, NTPC Renewables saw huge investor inflows.
Case 3: Banking Recovery Post-2019
Theme: Financial inclusion and digital banking.
Sectoral Rotation: PSU banks outperformed after years of underperformance due to NPA cleanup.
Result: Bank Nifty became one of the best-performing indices by 2023.
Advantages of Sectoral Rotation & Thematic Trading
Be Ahead of the Curve – Spot where money is moving before the crowd.
Diversification with Focus – Instead of random stock-picking, you align with strong groups.
Capture Both Cycles & Megatrends – Short-term opportunities + long-term wealth creation.
Higher Conviction – Investing with logic and evidence reduces emotional decisions.
Challenges
Timing is Hard – Entering too early or too late in rotation reduces returns.
False Themes – Not every hyped theme sustains (3D printing, VR, etc.).
Global Dependence – Many Indian sectors are linked to global trends (IT, metals).
Information Overload – Too many narratives make it hard to pick the right one.
Conclusion
Sectoral rotation and thematic trading are not just buzzwords – they are powerful frameworks to navigate markets intelligently. Sectoral rotation teaches us that markets are cyclical, and different industries lead at different times. Thematic trading shows us that beyond cycles, there are megatrends shaping the future.
The best traders and investors combine both – timing their entries with sectoral strength while riding multi-decade themes.
In simple terms:
Follow the money (sector rotation).
Follow the future (themes).
Do this consistently, and you’ll not only trade like a pro but also invest like a visionary.
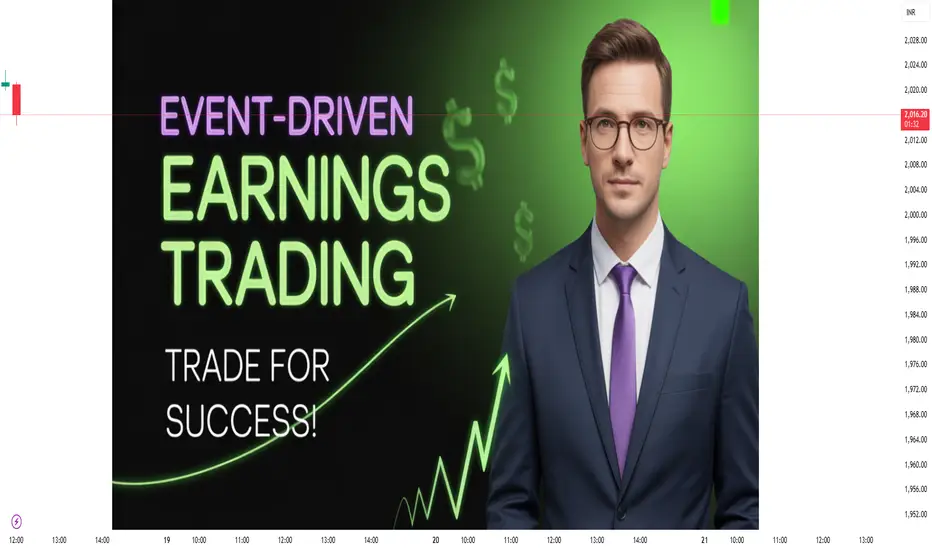
Event-Driven & Earnings Trading1. Introduction to Event-Driven Trading
Event-driven trading is a strategy where traders take positions in securities based on the expectation of a specific event and its potential market impact. Unlike long-term investors who might ignore short-term fluctuations, event-driven traders thrive on these catalysts because they create rapid price movements.
Events can be company-specific (like an earnings release), sector-wide (like regulatory approval for a new drug), or macroeconomic (like a Federal Reserve interest rate decision).
Key Characteristics:
Focuses on short- to medium-term price movements.
Involves research, timing, and speed.
Relies heavily on information flow and news tracking.
Often used by hedge funds, proprietary traders, and active retail traders.
2. Types of Event-Driven Trading
There are many forms of event-driven trading. Here are the most important ones:
a) Earnings Announcements
Quarterly earnings reports are one of the most predictable events. They reveal a company’s profitability, revenue growth, and outlook. Traders position themselves before or after these announcements.
Pre-earnings trades: Betting on volatility leading up to the release.
Post-earnings trades: Reacting quickly to surprises (earnings beats or misses).
b) Mergers & Acquisitions (M&A)
When companies announce mergers, the stock prices of both target and acquiring firms react sharply. Event-driven traders try to profit from these discrepancies.
Merger arbitrage: Buying the target company’s stock at a discount to the announced acquisition price, while sometimes shorting the acquirer.
c) Regulatory & Legal Events
Approval or rejection of drugs, antitrust rulings, or new government policies can send sectors soaring or crashing. For instance, a favorable ruling for a tech company can boost its stock, while a ban can sink it.
d) Macroeconomic Events
These include interest rate decisions, inflation reports, GDP data, central bank speeches, and geopolitical tensions. Traders anticipate how these events affect equities, currencies, and commodities.
e) Corporate Announcements Beyond Earnings
Stock splits
Dividend declarations
Buybacks
Management changes
3. Earnings Trading: A Specialized Event-Driven Strategy
Earnings trading is perhaps the most popular form of event-driven trading because:
Earnings dates are known well in advance.
The results often cause large price gaps.
Institutional investors and analysts closely track them.
Key Earnings Components:
Earnings Per Share (EPS): Profit divided by outstanding shares.
Revenue Growth: Top-line performance.
Guidance: Management’s future expectations.
Margins: Profitability ratios.
A company that beats analyst expectations often sees its stock jump, while a miss usually causes a drop. However, markets sometimes react differently than expected due to guidance, sentiment, or broader market conditions.
4. How Event-Driven & Earnings Trading Works in Practice
Let’s break down the trading process step by step.
Step 1: Research and Preparation
Track corporate calendars: Know when earnings, product launches, or policy announcements are scheduled.
Read analyst estimates: Consensus EPS/revenue forecasts.
Check historical reactions: How has the stock moved in past earnings?
Step 2: Pre-Event Positioning
Some traders enter before the event, speculating on outcomes. This is riskier but offers high reward if they are right.
Step 3: Trading During the Event
High-frequency traders (HFTs) and algorithmic traders react within milliseconds to earnings headlines or economic data. Retail traders typically react slightly slower, but can still profit from post-announcement moves.
Step 4: Post-Event Trading
Markets often overreact initially, creating opportunities for mean reversion or continuation plays. Skilled traders wait for confirmation before entering.
5. Tools for Event-Driven & Earnings Traders
To succeed, traders use a mix of technology, data, and analysis:
Economic & earnings calendars (e.g., Nasdaq, Investing.com, NSE/BSE announcements).
News terminals (Bloomberg, Reuters, Dow Jones Newswires).
Options market data: Implied volatility often spikes before earnings.
Charting tools & technical analysis for timing entries/exits.
Sentiment analysis tools: Tracking social media, analyst ratings, insider activity.
6. Trading Strategies
a) Pre-Earnings Volatility Trading
Buy options (straddles/strangles) expecting large price swings.
Short options if volatility is overpriced.
b) Post-Earnings Drift
Stocks often continue moving in the direction of the earnings surprise for several days or weeks. Traders ride this momentum.
c) Gap Trading
When a stock gaps up or down after earnings, traders wait for pullbacks or breakouts to position.
d) Merger Arbitrage
Buy the target, short the acquirer. Profit when the deal closes.
e) Event Hedging
Using options or futures to hedge positions ahead of risky events.
7. Risks in Event-Driven & Earnings Trading
While potentially rewarding, these strategies carry unique risks:
Event Uncertainty: Even if you predict earnings correctly, stock reaction may differ.
Volatility Risk: Sudden price gaps can wipe out traders using leverage.
Liquidity Risk: Smaller stocks may not have enough trading volume.
Information Asymmetry: Institutions with faster access to data may move ahead of retail traders.
Overconfidence: Traders often assume they can “predict” outcomes better than the market.
8. Psychology of Event-Driven Trading
Event-driven trading is highly psychological because it involves anticipation and reaction. Common biases include:
FOMO (Fear of Missing Out): Jumping into trades too late.
Confirmation Bias: Interpreting results in line with pre-existing beliefs.
Overtrading: Trying to catch every earnings play.
Emotional Volatility: Stress from sudden price moves.
Traders who remain calm, disciplined, and data-driven usually succeed more consistently.
9. Institutional vs. Retail Approaches
Institutions:
Have quants, algorithms, and real-time feeds.
Specialize in merger arbitrage, distressed debt, macro-event plays.
Can hedge using derivatives efficiently.
Retail Traders:
Limited by speed and access to insider info.
Best focus is earnings trading, technical post-event setups, or selective option strategies.
10. Case Studies
Case 1: Tesla Earnings
Tesla often beats or misses expectations dramatically, causing 8–15% post-earnings moves. Traders use options straddles to capture volatility.
Case 2: Pfizer & FDA Approval
When Pfizer announced vaccine approval, the stock spiked sharply. Event-driven traders who anticipated approval profited heavily.
Case 3: Reliance Jio Deals (India)
During 2020, Reliance Industries announced multiple foreign investments in Jio. Each event triggered price rallies, rewarding event-driven traders.
Conclusion
Event-driven and earnings trading is not for the faint-hearted—it demands preparation, quick thinking, and strong discipline. While the potential rewards are high, so are the risks. The best traders treat it as a probability game, not a prediction contest.
By mastering research, tools, psychology, and risk management, traders can consistently capture opportunities from corporate earnings, M&A deals, regulatory events, and macroeconomic announcements.
In short, event-driven trading is about being at the right place at the right time—but with the right plan.
Algo AutomationIntroduction
Trading and investing have come a long way from the days of physical stock exchanges, where brokers shouted buy and sell orders on the trading floor. Today, almost 80–90% of global market volume is generated through algorithmic trading (algo trading). In simple words, algo automation refers to the process of using computer programs, rules, and mathematical models to execute trades automatically—without human emotions interfering.
But algo automation is not just about “pressing a button and letting the computer trade.” It is a complete ecosystem that involves strategy building, coding, backtesting, optimization, execution, and risk management. From hedge funds on Wall Street to retail traders in India using platforms like Zerodha Streak or TradingView, algo automation has become an integral part of modern trading.
This article will break down algo automation in detail—covering concepts, history, strategies, benefits, risks, real-world applications, and the future.
1. What is Algo Automation?
Algo automation means creating a set of rules or instructions for the computer to follow while trading. These rules are usually based on:
Price
Volume
Technical indicators (moving averages, RSI, MACD, etc.)
Fundamental triggers (earnings announcements, balance sheet ratios)
Market events (news, interest rate changes, etc.)
Once the rules are coded into a software program, the algorithm monitors the market continuously and executes trades automatically whenever conditions are met.
Example:
Suppose you design a simple rule—
Buy Nifty futures if the 50-day moving average crosses above the 200-day moving average (Golden Cross).
Sell when the 50-day crosses below the 200-day moving average (Death Cross).
Instead of you sitting in front of the screen all day, the algorithm keeps checking and executes the trade instantly when conditions trigger.
This is algo automation in action.
2. The Evolution of Algo Automation
1970s: Early forms of program trading began in the US. Computers helped execute large orders faster.
1980s: Index arbitrage became popular—traders used algos to exploit price differences between futures and cash markets.
1990s: With better computing power, hedge funds like Renaissance Technologies used quantitative models to trade.
2000s: High-Frequency Trading (HFT) boomed, where algos executed trades in microseconds.
2010s onwards: Algo automation became available to retail traders with platforms like MetaTrader, Amibroker, NinjaTrader, Zerodha Streak, and TradingView.
Today, even small traders can run automated systems with as little as ₹10,000 capital, thanks to broker APIs and cloud-based systems.
3. Key Components of Algo Automation
Algo automation is not just about writing code. It involves several steps and components:
3.1 Strategy Development
The first step is designing the trading strategy. This can be based on:
Technical analysis (chart patterns, indicators).
Statistical models (mean reversion, pairs trading).
Event-driven models (earnings announcements, macro news).
3.2 Coding/Implementation
Once the idea is ready, it is coded into a language like:
Python
R
C++
Broker-specific scripting (like Pine Script for TradingView, AFL for Amibroker).
3.3 Backtesting
Backtesting means testing the strategy on past data to check performance. Important metrics include:
Win rate
Profit factor
Maximum drawdown
Sharpe ratio
3.4 Paper Trading
Before deploying real money, the algo is tested in live conditions without risk—this is called paper trading.
3.5 Execution Engine
The execution engine connects the algo with the broker’s API to place trades automatically. Speed and reliability are crucial here.
3.6 Risk Management
Stop-loss, position sizing, diversification, and hedging are coded into the system to control risk.
4. Types of Algo Strategies
Algo automation can power a variety of strategies:
4.1 Trend Following
Based on moving averages, breakout systems, etc.
Example: Buy when price breaks above 52-week high.
4.2 Mean Reversion
Assumes prices revert to average after deviations.
Example: Bollinger Bands reversal trades.
4.3 Arbitrage
Exploiting price differences in two markets.
Example: Spot-futures arbitrage in Nifty.
4.4 High-Frequency Trading (HFT)
Ultra-fast systems executing thousands of trades per second.
Mostly for institutions.
4.5 Market Making
Providing liquidity by quoting buy and sell prices simultaneously.
Earns the bid-ask spread.
4.6 Event-Driven
Based on news, earnings, dividend announcements.
Example: Buy ITC after strong quarterly results.
4.7 Options Algo Strategies
Automated straddle, strangle, iron condor, or hedging strategies.
Example: Deploying short straddle at specific IV levels automatically.
5. Benefits of Algo Automation
5.1 No Emotions
Humans get greedy, fearful, or impatient. Algos trade with discipline.
5.2 Speed
Execution happens in milliseconds—much faster than manual clicking.
5.3 Accuracy
No human error in entering wrong lot size or price.
5.4 Backtesting
Strategies can be tested before risking money.
5.5 Diversification
One trader can run multiple strategies across markets simultaneously.
5.6 24/7 Monitoring
Especially useful in crypto markets which never sleep.
6. Risks & Challenges of Algo Automation
While algo automation sounds attractive, it comes with risks:
6.1 Overfitting
A strategy that performs very well on past data may fail in real trading.
6.2 Technical Failures
Internet failure, broker downtime, or server crash can disrupt execution.
6.3 Slippage & Latency
In fast-moving markets, orders may not get executed at expected prices.
6.4 Regulatory Risks
In India, SEBI has strict rules for algo trading—unregistered algos may be banned.
6.5 Market Risk
No matter how advanced, if the market moves violently, algos can generate large losses quickly.
7. Algo Automation in India
Algo automation has grown rapidly in India after 2010. Initially, only institutions used it. Now retail traders have access to:
Broker APIs – Zerodha Kite Connect, Angel One SmartAPI, Upstox API.
No-Code Platforms – Streak, AlgoTest, Tradetron.
Coding-Based Platforms – Amibroker, Python libraries, NinjaTrader.
SEBI regulations require brokers to approve algos, but semi-automated retail platforms allow conditional trading without direct coding knowledge.
8. Practical Example of Algo Automation
Imagine you are a Bank Nifty options trader. You design a strategy:
Every Thursday at 9:30 AM, sell a Bank Nifty at-the-money (ATM) straddle.
Place stop-loss at 25% of premium.
Square off at 3:15 PM if stop-loss is not hit.
Now, you don’t need to sit in front of the screen. The algo will:
Identify ATM strikes.
Place sell orders.
Apply stop-loss automatically.
Exit positions at a fixed time.
This is exactly how many professional option sellers operate today.
9. Future of Algo Automation
The next decade will see AI + Algo Trading take center stage. Future trends include:
Machine Learning Models that learn from data and self-improve.
Natural Language Processing (NLP) based algos that read news headlines and trade instantly.
Cloud-Based Algo Platforms for scalability.
Crypto Algo Trading expanding globally.
Fractional and Retail Adoption – everyday investors will use plug-and-play algos just like using mutual funds.
10. Conclusion
Algo automation is revolutionizing trading. It removes emotions, adds speed, improves efficiency, and allows retail traders to compete with institutions on a smaller scale. However, it also carries risks—overfitting, technical failures, and regulatory challenges.
The smart way forward is to:
Learn basics of coding (Python or TradingView Pine Script).
Start small with paper trading.
Focus on risk management, not just profits.
Use algo automation as a tool, not a shortcut to get-rich-quick.
The future belongs to traders who combine market knowledge + technology + discipline. Algo automation is not just the future—it’s already here.

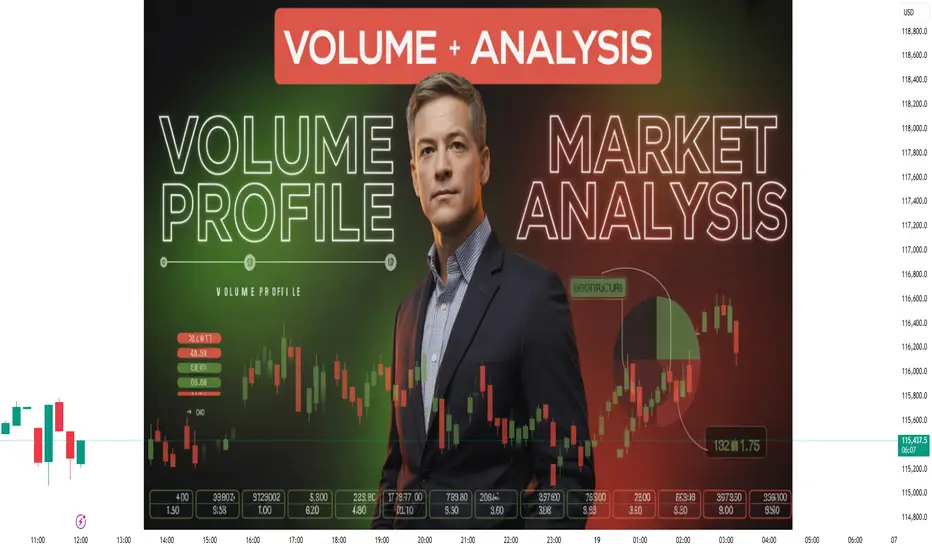
Volume Profile & Market Structure AnalysisIntroduction
Trading in modern markets is not just about spotting random price movements or relying on news flow. Successful traders go deeper — they analyze where market participants are most active, how price is being accepted or rejected, and what the structure of the market is saying about upcoming trends. Two powerful concepts that help traders uncover this hidden order in price action are Volume Profile and Market Structure Analysis.
Volume Profile reveals the where of trading activity — showing price zones where the heaviest buying and selling occurred. Market Structure reveals the how — the way prices move in waves of higher highs and lows or lower highs and lows, mapping the behavior of bulls and bears.
When combined, these tools allow a trader to “read the market’s mind” with more clarity. This is not a guarantee of success but provides a high-probability framework for decision-making.
In this deep dive, we’ll explore:
Basics of volume and its role in markets.
What is Volume Profile, and why is it so effective?
Key components of a Volume Profile chart.
Market Structure — the framework of trends, ranges, and reversals.
How to merge Volume Profile with Market Structure.
Practical strategies for day trading, swing trading, and positional trading.
Examples from global and Indian markets.
Pitfalls, misconceptions, and best practices.
By the end, you’ll see how these concepts can transform your trading into a more structured and probability-driven approach.
1. The Role of Volume in Trading
Before jumping into profiles and structures, let’s understand volume itself.
Volume is the number of shares/contracts traded during a specific period.
It tells us about participation — how many market players are active at a given price or time.
High volume indicates strong interest; low volume shows disinterest.
For example:
A breakout above resistance with high volume = confirmation of strength.
A breakout with low volume = risk of false breakout.
Volume is like the “fuel” behind price. Price may move temporarily without volume, but sustained trends always require strong participation.
2. What is Volume Profile?
While most traders look at volume along the time axis (volume bars at the bottom of a chart), Volume Profile shifts focus to the price axis.
Instead of asking “How much volume happened at 10:15 AM?”, it asks, “How much volume happened at ₹200, ₹201, ₹202, etc.?”
The result is a histogram plotted on the vertical axis, showing which prices attracted the most trading activity.
This gives traders critical insights into:
Fair Value Areas – where buyers and sellers agreed most.
Support & Resistance Zones – where heavy participation occurred.
Liquidity Pools – where big institutions might be hiding orders.
Think of Volume Profile as an X-ray of the market’s backbone. While price candles show the surface moves, the profile shows the depth of interest at each level.
3. Key Components of Volume Profile
When reading a Volume Profile chart, three major zones stand out:
a) Point of Control (POC)
The single price level where maximum volume was traded.
Acts like a “magnet” — price often revisits this level.
Example: If Reliance trades heavily around ₹2,400, that becomes the POC.
b) Value Area (VA)
The zone where about 70% of total volume took place.
Represents the range where most buyers and sellers agreed on “fair value.”
Price staying inside VA = balance; moving outside = imbalance.
c) High/Low Volume Nodes (HVN & LVN)
High Volume Node (HVN): Area with heavy activity, showing strong interest. Often acts as support/resistance.
Low Volume Node (LVN): Area with very little activity, meaning price moved quickly. These act like “gaps” and are often retested.
Together, these elements give traders a precise map of where the market has been and where it might react again.
4. Market Structure: The Skeleton of Price Action
If Volume Profile is the depth chart, Market Structure is the roadmap. It describes how prices move in waves.
The market moves in three basic structures:
a) Uptrend (Higher Highs & Higher Lows)
Buyers dominate.
Each rally breaks previous highs, and each pullback holds above the last low.
b) Downtrend (Lower Highs & Lower Lows)
Sellers dominate.
Each decline breaks previous lows, and each bounce fails below the last high.
c) Range (Sideways Market)
Neither buyers nor sellers dominate.
Price oscillates between support and resistance.
Within these, traders look for:
Break of Structure (BOS): Trend continuation signal.
Change of Character (CHOCH): Trend reversal signal.
Liquidity Zones: Levels where stop-losses and orders cluster.
Market structure helps answer: “Where are we in the cycle — trending up, trending down, or consolidating?”
5. Merging Volume Profile with Market Structure
This is where magic happens. On their own, both tools are powerful. But together, they create a context + confirmation framework.
Examples:
In an uptrend, if price pulls back to a POC or HVN, it’s a high-probability bounce zone.
In a downtrend, price rejecting from a Value Area High (VAH) confirms seller dominance.
During a range, LVNs show breakout points where price may move sharply once imbalance occurs.
Think of it like this:
Market Structure = Direction (Trend/Range)
Volume Profile = Levels (Support/Resistance zones)
Together, they give traders both the where and the when to act.
6. Practical Trading Strategies
a) Intraday Trading with Volume Profile
Identify the previous day’s POC, VAH, and VAL.
Watch how price reacts around these levels.
Example: If Nifty opens above VAH and holds, intraday longs may work.
b) Swing Trading with Market Structure
Use daily/weekly structure to determine trend.
Align entries at profile levels (HVN support in an uptrend).
Example: Buy Infosys on pullback to VA near ₹1,500 if market structure shows higher highs.
c) Positional Trading with Combined Approach
Look for macro structure (monthly trend).
Use Volume Profile to refine entry/exit points.
Example: Banking index in long-term uptrend — add positions on dips to POC levels.
7. Real-World Examples (Indian Markets)
Nifty 50: In major uptrends, Nifty often consolidates near HVNs before the next breakout. Volume Profile shows exact “accumulation zones.”
Reliance Industries: Stock frequently rejects LVNs after gaps, offering trade setups for intraday scalpers.
Bank Nifty: Heavily influenced by institutional volume, making profile levels extremely reliable for support/resistance.
8. Pitfalls and Misconceptions
Overcomplication: Beginners clutter charts with too many profiles. Stick to daily/weekly levels.
Blind Trust: POC is not magic; always confirm with market structure.
Ignoring Context: Profile levels in isolation mean little. Combine with trend, news, and market sentiment.
9. Best Practices
Always analyze higher timeframe structure first.
Use Volume Profile to fine-tune entry/exit zones.
Avoid trading against strong structure unless evidence of reversal.
Keep charts clean — focus on 2–3 levels max.
Combine with risk management (stop-loss at LVNs, targets near HVNs).
10. Conclusion
Volume Profile and Market Structure are like two lenses that bring market behavior into focus. One shows the depth of participation at each price, and the other shows the framework of trends and ranges.
When you master these tools:
You stop guessing support/resistance.
You understand why price reacts at certain levels.
You trade with the institutions, not against them.
Whether you’re an intraday trader looking for precise scalp entries or a long-term investor identifying accumulation zones, this combination offers an edge.
The market is not random. Behind every move lies a structure — and behind every structure lies volume. Volume Profile & Market Structure Analysis together help you decode this hidden order, making you a smarter and more confident trader.
Crypto & Tokenized Assets1. Introduction
India is at a very interesting stage when it comes to crypto and tokenized assets. On one side, millions of Indians are already trading Bitcoin, Ethereum, and other cryptocurrencies on exchanges. On the other side, the government and regulators are still trying to figure out how to deal with this new digital asset class.
But crypto is not just about Bitcoin or meme coins. A bigger revolution is quietly taking place – tokenization of assets. Tokenization means converting real-world things like gold, real estate, art, company shares, or even music royalties into digital tokens that can be traded or transferred easily.
This creates a new world of investment opportunities, transparency, and liquidity. For a country like India, where financial inclusion and access to assets are still limited, tokenization could be a game-changer.
In this article, we will explore crypto and tokenized assets in India in simple human language, covering history, growth, regulation, opportunities, risks, and the future.
2. Understanding Crypto & Tokenization
What is Cryptocurrency?
A cryptocurrency is a digital form of money that runs on blockchain technology.
It is decentralized, meaning no single authority like RBI or a bank controls it.
Examples: Bitcoin (BTC), Ethereum (ETH), Solana (SOL).
People use it for trading, investing, payments, and sometimes as a hedge against inflation.
What is Tokenization?
Tokenization is the process of creating digital tokens that represent ownership of an asset.
These tokens live on a blockchain, just like cryptocurrencies.
Example: Instead of buying a whole flat worth ₹1 crore, a developer could tokenize it into 1 lakh tokens of ₹100 each. Now, small investors can also own a fraction of that flat.
Types of Tokens
Cryptocurrency Tokens – like Bitcoin, used for payments or as a store of value.
Utility Tokens – give access to a product/service (e.g., exchange tokens).
Security Tokens – represent ownership in assets like stocks, bonds, or real estate.
NFTs (Non-Fungible Tokens) – unique tokens for art, collectibles, music, digital property.
3. Journey of Crypto in India
Early Days (2013–2017)
Bitcoin entered India around 2013–14.
Few exchanges like ZebPay, Unocoin, and CoinSecure started offering trading.
At this time, crypto was not well understood and seen as risky.
Regulatory Roadblocks (2018–2019)
In 2018, RBI banned banks from providing services to crypto exchanges.
This created panic and many exchanges shut down.
However, traders still found ways to trade via peer-to-peer (P2P).
Supreme Court Relief (2020)
In March 2020, Supreme Court of India lifted the RBI ban.
This triggered a boom in crypto adoption.
Exchanges like WazirX, CoinDCX, and ZebPay grew rapidly.
Bull Run & Retail Adoption (2020–2021)
Bitcoin touched $60,000 in 2021, and Indian retail investors rushed in.
Millions of Indians opened accounts on exchanges.
Meme coins like Dogecoin and Shiba Inu became popular among youth.
Taxation Era (2022–Present)
In 2022, India introduced a 30% tax on crypto profits and 1% TDS on transactions.
This reduced trading activity but did not kill interest.
Today, India has one of the largest crypto user bases in the world (estimated 15–20 million users).
4. Tokenized Assets in India
Tokenization is newer than cryptocurrency trading, but it is slowly gaining momentum.
Examples of Tokenized Assets in India
Gold Tokens – Some Indian platforms offer gold-backed tokens, where each token equals a certain weight of physical gold.
Real Estate Tokenization – Companies are experimenting with tokenizing commercial property so multiple investors can own fractions.
Art & Collectibles – NFTs allow digital ownership of Indian artwork, Bollywood posters, cricket moments, etc.
Equity & Bonds (Future Possibility) – Tokenized versions of company shares and government bonds could be traded 24/7 globally.
Why Tokenization is Important for India?
Democratization of assets – A middle-class person can own a fraction of high-value assets.
Liquidity – Real estate is usually illiquid, but tokenized property can be traded like stocks.
Transparency – Blockchain ensures no manipulation in ownership records.
Global Investment Access – Indian assets can be traded by global investors and vice versa.
5. Regulation of Crypto & Tokenized Assets in India
This is the most debated topic.
Crypto is not banned in India.
However, it is not regulated like stocks or mutual funds.
The government is cautious because of risks like money laundering, fraud, and capital flight.
Current Legal Stand
Taxation – 30% flat tax on profits + 1% TDS on transactions.
No Legal Tender – Crypto is not recognized as official currency (only Rupee is).
Exchanges under Watch – They must follow KYC/AML rules.
Tokenized Assets
Tokenization projects are in early stages.
RBI has already launched Digital Rupee (CBDC), which is not crypto but blockchain-based.
Regulators may allow tokenization of bonds, real estate, and gold under strict guidelines in the future.
Global Coordination
India is working with G20 and FATF (Financial Action Task Force) to build a common global framework for crypto regulation.
6. Opportunities for India
Crypto and tokenized assets could open many doors for India:
Financial Inclusion – Millions of unbanked Indians could access financial services through blockchain wallets.
New Investment Options – Middle-class Indians can invest in tokenized global assets.
Startup Ecosystem – India is already producing Web3 unicorns like Polygon.
Job Creation – Blockchain development, security, compliance, NFT platforms.
Global Leadership – If India creates smart regulations, it can become a hub for tokenized assets.
7. Risks & Challenges
Volatility – Crypto prices can rise and crash overnight.
Regulatory Uncertainty – Lack of clarity scares big institutions.
Frauds & Scams – Ponzi schemes, rug pulls, fake tokens.
Tax Burden – 30% tax + 1% TDS makes trading difficult for retail.
Technology Risks – Hacking, private key loss, and smart contract bugs.
8. The Role of CBDC (Digital Rupee)
India has launched pilot projects for Digital Rupee (e₹).
It is issued by RBI, unlike crypto.
Runs on blockchain but fully controlled by government.
Could be used for payments, remittances, and settlements.
This may act as a bridge between traditional finance and tokenized assets in India.
9. Future of Crypto & Tokenized Assets in India
Looking ahead, several trends are likely:
Clear Regulations (2025–2026) – India will likely introduce a legal framework for crypto exchanges, tokenized securities, and NFTs.
Tokenized Real Estate & Gold – Indians love real estate and gold; tokenization will make them more liquid.
Integration with Stock Market – Tokenized shares and bonds could be traded 24/7 like crypto.
Cross-Border Investments – Indians could buy fractional ownership of US real estate or global startups via tokens.
Institutional Adoption – Banks, mutual funds, and NBFCs may enter crypto/tokenization once regulation is clear.
10. Human Angle – Why Indians Are Attracted to Crypto
Aspiration: Young Indians see crypto as a way to grow wealth faster than fixed deposits.
Global Connection: Crypto is borderless, making Indians feel part of a global financial revolution.
Hedge Against Inflation: With rupee depreciation, some see Bitcoin as a safe asset.
Low Entry Barrier: One can start with just ₹100, unlike real estate or gold.
Community & Culture: Crypto Twitter, Telegram groups, and NFT communities create excitement.
Conclusion
Crypto and tokenized assets in India represent the future of finance. While regulation is still unclear, the direction is obvious – digital assets will play a massive role in India’s economy.
From Bitcoin trading to tokenized real estate, from NFTs of Bollywood posters to CBDC Digital Rupee, India is moving towards a hybrid financial system where traditional and digital assets co-exist.
Yes, there are risks – volatility, scams, unclear laws – but the opportunities are too big to ignore. For a young, tech-savvy, and ambitious country like India, crypto and tokenization are not just investments; they are a gateway to global financial participation.
The next decade could see India emerge as a leader in blockchain adoption, balancing innovation with regulation. For investors, this means a once-in-a-generation chance to be part of a transformation that is reshaping money, ownership, and markets forever.
Paer 4 Learn Institutional Trading Options Trading Strategies
Basic Strategies
Long Call → Buy call, bullish.
Long Put → Buy put, bearish.
Covered Call → Own stock + sell call for income.
Protective Put → Own stock + buy put for protection.
Intermediate Strategies
Straddle: Buy Call + Put at same strike (bet on volatility).
Strangle: Buy Call (higher strike) + Put (lower strike).
Bull Call Spread: Buy low strike call + sell higher strike call.
Bear Put Spread: Buy put + sell lower strike put.
Advanced Strategies
Iron Condor: Range-bound strategy selling OTM call + put spreads.
Butterfly Spread: Profit from low volatility near strike.
Ratio Spreads: Adjust risk/reward with multiple options.
Margin Requirements & Leverage
Option buyers: Pay only premium (small capital).
Option sellers (writers): Need large margin (higher risk).
NSE SPAN + Exposure margin system determines requirements.
For example, selling 1 lot of Bank Nifty option may require ₹1.5–2 lakh margin depending on volatility.

Paer 3 Learn Institutional Trading Options Trading Strategies
Basic Strategies
Long Call → Buy call, bullish.
Long Put → Buy put, bearish.
Covered Call → Own stock + sell call for income.
Protective Put → Own stock + buy put for protection.
Intermediate Strategies
Straddle: Buy Call + Put at same strike (bet on volatility).
Strangle: Buy Call (higher strike) + Put (lower strike).
Bull Call Spread: Buy low strike call + sell higher strike call.
Bear Put Spread: Buy put + sell lower strike put.
Advanced Strategies
Iron Condor: Range-bound strategy selling OTM call + put spreads.
Butterfly Spread: Profit from low volatility near strike.
Ratio Spreads: Adjust risk/reward with multiple options.
Margin Requirements & Leverage
Option buyers: Pay only premium (small capital).
Option sellers (writers): Need large margin (higher risk).
NSE SPAN + Exposure margin system determines requirements.
For example, selling 1 lot of Bank Nifty option may require ₹1.5–2 lakh margin depending on volatility.

Part 1 Ride The Big MovesWhy Trade Options?
Leverage: Trade larger positions with smaller capital.
Hedging: Protect your portfolio against market falls.
Speculation: Bet on market direction with limited risk.
Income Generation: Write (sell) options to earn premium.
Options Market in India
Introduced in 2001 by NSE with index options.
Stock options followed in 2002.
India now has weekly expiries for Nifty, Bank Nifty, and FinNifty.
SEBI & Exchanges regulate margin rules, position limits, and trading practices.
The retail participation in options has exploded post-2020 with apps like Zerodha, Upstox, Angel One, Groww, making it extremely easy to trade.

Part 1 Master Candle PatternIntroduction to Options Trading
Options trading has become one of the fastest-growing segments of the Indian financial market. Once considered a playground only for institutions and advanced traders, options are now widely accessible to retail investors thanks to online trading platforms, mobile apps, and reduced brokerage costs.
In India, the NSE (National Stock Exchange) is the world’s largest derivatives exchange in terms of contracts traded, with Bank Nifty and Nifty 50 options leading the charge. For retail traders, options present opportunities for hedging, speculation, and income generation, making them versatile instruments.
But options are also complex. Unlike stocks, where you directly own a piece of a company, options are derivative contracts—their value depends on the price of an underlying asset. This makes them both powerful and risky if not understood properly.
What are Options?
An option is a financial contract that gives the buyer the right, but not the obligation, to buy or sell an underlying asset at a predetermined price (strike price) before or on a specific date (expiry).
Call Option → Right to buy an asset at a strike price.
Put Option → Right to sell an asset at a strike price.
Unlike futures contracts, option buyers are not obligated to execute the trade. They can choose to let the option expire worthless if the trade doesn’t go their way.

Retail vs Institutional Trading in IndiaIntroduction
The Indian stock market has grown into one of the world’s most dynamic financial ecosystems. With over 15 crore registered investors (retail and institutional combined), India today stands as one of the most vibrant equity markets in Asia. At the heart of this market lie two distinct yet interconnected forces: retail traders and institutional traders.
While both groups participate in buying and selling of securities, their strategies, resources, decision-making processes, and impact on the market differ significantly. Retail traders represent individual investors trading for personal gains, often with smaller capital. Institutional traders, on the other hand, include mutual funds, foreign institutional investors (FIIs), hedge funds, insurance companies, and pension funds—entities that manage huge pools of money and operate with a professional, systematic approach.
In this detailed discussion, we will explore the differences, strengths, weaknesses, and impact of retail versus institutional trading in India, with examples, statistics, and case studies.
1. Who Are Retail Traders?
Retail traders are individual investors who buy and sell securities (stocks, derivatives, bonds, mutual funds, ETFs) through brokers and trading platforms.
Characteristics of Retail Traders in India:
Capital Size – Usually small to medium; average portfolio sizes range between ₹50,000 to ₹5,00,000 for most retail participants.
Decision-making – Based on personal research, stock tips, technical analysis, social media influence, or financial news.
Time Horizon – Many retail traders are short-term focused (intraday, swing trading), but some are long-term investors.
Risk Appetite – Highly varied; some are conservative, while others aggressively speculate in derivatives like options.
Access to Information – Limited compared to institutions; often rely on publicly available news, broker reports, and YouTube/Telegram groups.
Psychology – Retail traders are more prone to emotions—fear and greed drive their buying and selling decisions.
In India, retail participation has skyrocketed post-2020, especially during and after the COVID-19 pandemic. Cheap mobile internet, discount brokerage platforms like Zerodha, Upstox, Groww, and widespread financial literacy have brought crores of new investors into the system.
2. Who Are Institutional Traders?
Institutional traders represent large organizations that invest and trade on behalf of clients, corporations, or large funds.
Types of Institutional Traders in India:
Foreign Institutional Investors (FIIs) / Foreign Portfolio Investors (FPIs) – Global funds investing in Indian equities (e.g., BlackRock, Vanguard).
Domestic Institutional Investors (DIIs) – Mutual funds, insurance companies, and pension funds (e.g., SBI Mutual Fund, LIC).
Hedge Funds & Private Equity Firms – Professional asset managers with high-risk strategies.
Banks & Proprietary Trading Firms – Large-scale algorithmic and arbitrage traders.
Characteristics of Institutional Traders:
Capital Size – Huge. FIIs and DIIs invest billions of dollars; even a single trade can move markets.
Decision-making – Data-driven, research-backed, and systematic. Institutions have access to top analysts, advanced AI-driven algorithms, and insider networks.
Time Horizon – Mixed: some trade short-term (quant funds, HFT firms), while others focus on long-term portfolio building.
Risk Appetite – Managed through diversification, hedging, and sophisticated risk management frameworks.
Market Impact – A large buy or sell order from an institution can cause significant price movement in a stock.
Information Advantage – Access to privileged research, company management meetings, industry reports, and global insights.
In India, FIIs have historically been the dominant force. However, in recent years, DIIs (especially mutual funds and LIC) have grown massively, acting as a counterbalance to foreign flows.
3. Key Differences Between Retail and Institutional Traders
Aspect Retail Traders Institutional Traders
Capital Base Small to medium (₹10,000 – ₹5,00,000 typical) Very large (crores to thousands of crores)
Research & Information Public news, social media, brokers’ reports In-house analysts, global data, direct management access
Execution Speed Slower, manual trading Algorithmic, high-frequency, automated
Risk Management Limited diversification, emotional trading Strong hedging, diversification, quantitative models
Market Impact Minimal Huge (buy/sell orders can move entire markets)
Regulation Standard SEBI rules More stringent compliance and reporting
Objective Personal profit, sometimes speculative Long-term wealth creation, client mandates
Psychology Emotional, herd mentality common Rational, systematic, less emotional
4. Market Share and Participation in India
Retail Participation:
NSE data (2025): Retail investors account for 35–40% of daily trading turnover in cash markets.
Massive growth post-2020: During the pandemic, 1.2 crore new demat accounts were opened in a single year.
Dominant in derivatives (options trading)—retail accounts for more than 70% of index option volume, though many lose money.
Institutional Participation:
FIIs and DIIs together control 60–65% of market capitalization.
FIIs bring in foreign capital; their inflows/outflows dictate Nifty and Sensex trends.
DIIs act as stabilizers—when FIIs sell, DIIs often buy, cushioning volatility.
Example: In 2022, FIIs sold Indian equities worth over ₹2 lakh crore, but DIIs (mutual funds, LIC) absorbed much of it, preventing a market crash.
5. Trading Strategies
Retail Trading Strategies:
Intraday Trading – Buying and selling within a day to capture small price moves.
Swing Trading – Holding for days/weeks to capture medium trends.
Long-term Investing – Building portfolios of quality companies.
Options Trading – Speculation using low-cost options, often risky.
Stock Tips/Speculation – Influenced by social media or friends, often without deep research.
Institutional Trading Strategies:
Quantitative & Algorithmic Trading – Using AI, algorithms, and HFT.
Block Deals & Bulk Deals – Large trades negotiated outside normal market orders.
Sectoral Rotation – Moving funds between sectors based on macroeconomic cycles.
Long-term Value Investing – FIIs and DIIs invest in blue-chip companies with 5–10 year outlook.
Arbitrage & Hedging – Exploiting price differences across markets, hedging with futures/options.
6. Strengths and Weaknesses
Retail Strengths:
Flexibility—no institutional mandates, can enter/exit freely.
Ability to spot small-cap/mid-cap opportunities ignored by big funds.
Growing access to technology and financial education.
Retail Weaknesses:
Emotional trading—panic selling or over-exuberant buying.
Limited capital—cannot withstand large drawdowns.
Lack of professional research and risk management.
Institutional Strengths:
Huge capital and resources.
Professional teams, data, and systems.
Ability to shape and stabilize markets.
Institutional Weaknesses:
Bureaucratic and slow in decision-making sometimes.
Cannot easily enter/exit small-cap stocks without moving the price.
Over-regulated compared to retail.
7. Case Studies from Indian Markets
Case Study 1: Retail Mania in Options (2020–2023)
Retail investors flocked to Bank Nifty and Nifty weekly options. Volumes exploded, but SEBI reports revealed 9 out of 10 retail traders lost money due to lack of risk management.
Case Study 2: Institutional Impact (HDFC Twins Merger, 2023)
When HDFC Bank merged with HDFC Ltd, FIIs and DIIs rebalanced portfolios, causing huge inflows/outflows. Retail alone could not handle the volatility—institutions drove price action.
Case Study 3: Small-Cap Rally (2021–2024)
Retail investors poured money into small-cap stocks like Adani Group shares during their bull run. Institutions were cautious, but retail euphoria drove valuations to extremes before corrections set in.
8. Regulatory Framework
SEBI (Securities and Exchange Board of India) regulates both retail and institutional participants.
Retail faces fewer compliance requirements—just KYC and broker onboarding.
Institutions must follow strict disclosure norms, insider trading laws, and quarterly reporting.
Regulations like margin requirements, algo-trading rules, and position limits impact retail and institutional traders differently.
9. The Future of Retail vs Institutional Trading in India
Retail Growth – With financial literacy campaigns, digital platforms, and Gen-Z participation, retail’s role will continue to expand.
Institutional Expansion – Domestic mutual funds are gaining strength, challenging FII dominance.
Technology – AI-driven advisory apps and algo-trading will blur the gap between retail and institutional capabilities.
Market Depth – Retail in small-caps + Institutions in blue-chips = balanced ecosystem.
Long-term Outlook – A healthy mix of retail enthusiasm and institutional discipline will drive India’s journey towards becoming a $10 trillion economy by 2035.
10. Conclusion
The battle between retail vs institutional traders in India is not about who is superior—it’s about how they complement each other. Institutions bring stability, research, and long-term capital. Retail brings enthusiasm, liquidity, and breadth to the markets.
Retail investors often move in herds, creating short-term price swings, while institutions act as anchors, aligning markets with fundamentals. Together, they form the yin and yang of India’s stock market ecosystem.
The future will likely see more collaboration and convergence: retail gaining sophistication through technology and education, while institutions become more inclusive, catering to the growing aspirations of India’s retail class.
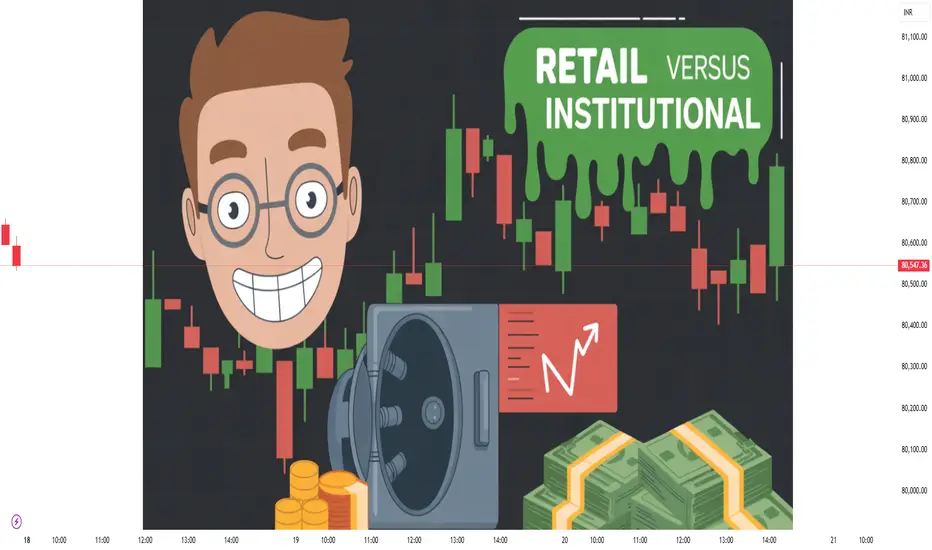
Swing Trading in Indian MarketsIntroduction
Trading in the stock market is like playing a game of probabilities where timing is everything. Some traders like to buy and sell within minutes (intraday scalpers), while others prefer to hold stocks for years (long-term investors). In between these two extremes lies a popular style of trading called Swing Trading.
Swing trading is about catching the "swings" or short-to-medium-term price moves in stocks, indices, or even commodities. Instead of sitting glued to the screen all day like an intraday trader, or waiting for 5–10 years like a long-term investor, swing traders typically hold positions for a few days to a few weeks.
In India, where the stock market has seen explosive growth in participation from retail investors, swing trading is gaining popularity. This strategy gives traders the flexibility to take advantage of short-term volatility while not requiring them to constantly monitor the screen.
In this guide, let’s dive deep into what swing trading is, why it’s important, how to do it, the tools required, strategies, risks, and examples from the Indian market.
1. What is Swing Trading?
Swing trading is a trading style that aims to capture short-to-medium-term gains in a stock (or any financial instrument).
Holding Period: From 2–3 days to a few weeks.
Objective: To profit from price “swings” (upward or downward movements).
Approach: Mix of technical analysis (charts, patterns, indicators) and fundamental awareness (news, events, earnings).
In simple words: Imagine a stock is moving in a zig-zag pattern. Swing traders don’t try to catch the entire long-term trend. Instead, they try to capture one piece of the move—either when the stock is bouncing up after a fall or dropping after a rise.
For example:
If Reliance Industries stock moves from ₹2,500 to ₹2,650 in a week, a swing trader could ride that move for quick profit.
If Infosys stock looks weak after earnings and is falling from ₹1,600 to ₹1,500, a swing trader could short-sell and benefit.
2. Why is Swing Trading Popular in India?
Swing trading is especially attractive for Indian retail traders because:
Flexibility – Unlike intraday trading, you don’t need to sit in front of the screen all day. You can plan trades in the evening and just monitor during market hours.
Leverage & Margins – In India, SEBI has restricted heavy intraday leverage, but swing trading allows delivery-based positions. Brokers also offer margin trading facilities (MTF), making it easier to hold stocks for days.
Volatile Market – Indian markets move fast due to earnings, government policies, RBI decisions, and global news. This volatility creates opportunities for swing traders.
Retail-Friendly – With the rise of platforms like Zerodha, Upstox, Angel One, and Groww, swing trading has become accessible with advanced charting tools.
Balanced Risk-Reward – It’s less stressful than intraday and faster than long-term investing. Many working professionals choose swing trading as a side strategy.
3. Swing Trading vs Intraday vs Investing
Aspect Swing Trading Intraday Trading Investing
Holding Period Few days to few weeks Same day Years
Risk Level Moderate High (due to leverage) Low (if diversified)
Time Required Medium High (screen watching) Low
Profit Expectation Moderate but frequent Quick, high (if successful) Large, long-term
Tools Used Technical analysis + news Charts, indicators, order flow Fundamental analysis
So swing trading is a middle ground – less stress than intraday, but faster than long-term investing.
4. Tools Required for Swing Trading
To be successful in swing trading in Indian markets, you need the right tools:
Trading Account & Demat Account – A broker like Zerodha, Upstox, ICICI Direct, HDFC Securities, etc.
Charting Platform – TradingView, Zerodha Kite, ChartIQ for price analysis.
News Source – Moneycontrol, Economic Times, Bloomberg Quint, NSE India for updates.
Technical Indicators – Moving Averages, RSI, MACD, Bollinger Bands.
Screeners – Tools to filter stocks (e.g., Trendlyne, Chartink, Screener.in).
Risk Management Tool – Stop-loss orders and position sizing calculators.
5. Core Strategies in Swing Trading
There are several approaches swing traders use. Let’s break them down:
5.1 Trend Following Strategy
Buy when the stock is in an uptrend (higher highs, higher lows).
Example: A stock crossing above its 50-day moving average.
5.2 Breakout Trading
Buy when stock price breaks above resistance with volume.
Example: If Tata Motors consolidates at ₹950 and breaks above ₹1,000, it may rally further.
5.3 Pullback Trading
Enter during a temporary correction in a larger trend.
Example: Nifty is in an uptrend, but falls for 2–3 days. A swing trader buys the dip.
5.4 Reversal Trading
Trade when trend changes direction.
Example: If ITC falls from ₹500 to ₹475 but forms a bullish reversal candle, traders may go long.
5.5 Range-Bound Trading
Buy near support, sell near resistance in sideways stocks.
Example: HDFC Bank oscillating between ₹1,450–1,500.
6. Technical Indicators Used in Swing Trading
Swing traders rely heavily on technical analysis. Some common tools:
Moving Averages (20, 50, 200 DMA)
Trend direction.
Buy when price > 50 DMA.
Relative Strength Index (RSI)
Measures overbought/oversold.
Buy if RSI < 30 (oversold), sell if RSI > 70 (overbought).
MACD (Moving Average Convergence Divergence)
Trend + momentum.
Bullish crossover = buy signal.
Bollinger Bands
Shows volatility.
Price touching lower band = possible buy.
Candlestick Patterns
Doji, Hammer, Engulfing for reversals.
7. Risk Management in Swing Trading
Risk management is the backbone of swing trading. Without it, one bad trade can wipe out multiple good ones.
Stop-Loss – Always fix an exit point. Example: Buy stock at ₹500 with SL at ₹480.
Position Sizing – Don’t put all money in one stock. Max 2–5% of capital per trade.
Risk-Reward Ratio – Ideally 1:2 (risk ₹10 to gain ₹20).
Diversification – Trade different sectors (Banking, IT, Pharma).
Avoid Overnight News Risk – Be aware of corporate announcements, global events.
8. Advantages of Swing Trading in India
Less Stressful than Intraday – No need to monitor every second.
Fewer Trades, Bigger Gains – Catch larger moves instead of small ticks.
Flexibility for Working Professionals – Can plan trades after market hours.
High Probability Setups – Uses both technical and fundamental insights.
Suitable for Growing Market like India – Indian stocks often give big short-term moves.
9. Disadvantages & Challenges
Overnight Risk – Sudden news (like RBI policy, global crash) can hit positions.
False Breakouts – Indian markets often trap traders with fake moves.
Requires Patience – Not all trades work instantly.
Brokerage & Taxes – STT, GST, and charges reduce profits if over-trading.
Discipline Needed – Many traders exit early or average losing trades.
10. Examples of Swing Trading in Indian Markets
Let’s see real-world style examples:
Example 1: Breakout Trade in Tata Motors
Stock consolidates at ₹950 for weeks.
Breaks ₹1,000 with high volume.
Swing trader enters at ₹1,005 with SL at ₹980.
Target ₹1,080 achieved in 5 days.
Example 2: Pullback Trade in Infosys
Infosys rallies from ₹1,500 to ₹1,650.
Pulls back to ₹1,600.
Trader buys at ₹1,610 with SL at ₹1,580.
Stock bounces back to ₹1,680 in a week.
Example 3: Reversal Trade in HDFC Bank
Stock falls from ₹1,500 to ₹1,420.
Bullish hammer candlestick forms at support.
Trader buys at ₹1,430 with SL at ₹1,400.
Price climbs to ₹1,490 in 6 sessions.
Conclusion
Swing trading in Indian markets offers a balanced way to participate in the stock market. It doesn’t demand the speed of an intraday trader nor the patience of a long-term investor. With the right mix of technical analysis, risk management, discipline, and market awareness, traders can consistently generate profits.
However, like any trading style, swing trading is not a guaranteed money machine. Success depends on practice, learning from mistakes, and developing a trading edge. The Indian markets—with their high volatility, strong retail participation, and sectoral opportunities—make an excellent playground for swing traders.
In short: If you’re someone who wants to ride the short-term waves of the Indian stock market without being glued to the screen all day, swing trading may be your perfect strategy.

Quarterly Results Trading (Earnings Season)1. Introduction to Quarterly Results Trading
Every listed company in the stock market is required to disclose its financial performance periodically. In most markets, this happens every quarter—that’s four times a year. These reports are known as quarterly results or earnings reports.
For traders and investors, the release of earnings is one of the most volatile and opportunity-rich periods in the market. Stock prices can jump or crash within minutes of the announcement, depending on whether the company met, beat, or missed expectations.
This period, when a large number of companies announce results within a few weeks, is called Earnings Season. Traders specializing in this period use strategies designed to capture sharp price moves, volatility spikes, and changes in market sentiment.
Quarterly results trading is a mix of:
Fundamental analysis (studying the company’s earnings, revenue, guidance, and business health),
Technical analysis (charts, levels, and patterns),
Sentiment analysis (expectations, media coverage, and market psychology).
2. Understanding Earnings Season
Earnings Season happens four times a year, usually after the quarter ends. For example:
Q1: April – June (Results in July–August)
Q2: July – September (Results in October–November)
Q3: October – December (Results in January–February)
Q4: January – March (Results in April–May)
In India, companies follow an April–March financial year, so Q4 results are particularly important because they also include full-year earnings.
During earnings season, news channels, analysts, and brokerage houses are flooded with earnings previews, result updates, and management commentary. This makes it a period of heightened market activity.
3. Why Quarterly Results Matter for Traders & Investors
Quarterly results are a scorecard of a company’s performance. They reveal whether the business is growing, struggling, or facing new opportunities/challenges.
For investors, quarterly earnings help judge if a company is on track with long-term goals.
For traders, these results create short-term trading opportunities due to volatility.
Key reasons quarterly results matter:
Price Sensitivity – A single earnings report can change a company’s valuation.
Expectations vs Reality – Markets react not to absolute numbers, but to whether expectations were beaten or missed.
Sector Impact – One company’s results (like Infosys or HDFC Bank) often set the tone for its entire sector.
Market Sentiment – Strong or weak earnings can influence the broader indices (Nifty, Sensex, Nasdaq, S&P 500).
4. Key Components of an Earnings Report
When a company announces results, traders look at multiple data points:
Revenue (Top Line) – Total income earned. Growth shows market demand.
Net Profit (Bottom Line) – Profit after expenses, taxes, and interest.
EPS (Earnings Per Share) – Net profit divided by number of shares. A key valuation measure.
EBITDA / Operating Margin – Operational efficiency.
Guidance (Future Outlook) – Management’s forecast for coming quarters.
Special Announcements – Dividends, share buybacks, bonus issues, restructuring.
5. Market Expectations vs Actual Results
Stock price reactions to earnings depend less on actual numbers, and more on how those numbers compare to market expectations.
If a company beats expectations → stock usually rises.
If it misses expectations → stock usually falls.
If results are in-line → limited reaction, unless guidance surprises.
Example: If analysts expected Infosys to report ₹7,000 crore profit, but the company posts ₹7,500 crore, the stock may rally. But if expectations were ₹8,000 crore, the same ₹7,500 crore may disappoint.
This is why earnings trading is not just about numbers—it’s about expectations and surprises.
6. Earnings Surprises and Stock Price Reactions
Earnings surprises are powerful. A positive earnings surprise (beat) can trigger rallies, while a negative surprise (miss) can cause crashes.
Typical reactions:
Positive Surprise → Gap up opening, strong momentum, short covering.
Negative Surprise → Gap down opening, selling pressure, stop-loss triggers.
But sometimes, even strong results cause a stock to fall. This happens if:
The stock was already overbought (priced-in).
Future guidance is weak.
Market expected even better performance.
7. Pre-Earnings Trading Strategies
Traders often take positions before results are announced, based on expectations.
Common strategies:
Momentum Play – If sector peers have posted strong results, traders expect similar performance.
Options Straddle/Strangle – Betting on volatility rather than direction.
Analyst Preview Play – Following brokerage estimates.
Chart-Based Levels – Using support/resistance zones for pre-result positioning.
Risk: If results differ from expectations, positions can go against traders instantly.
8. Post-Earnings Trading Strategies
Many traders prefer to wait until results are out, and then ride the move.
Strategies:
Gap Trading – Playing the gap up or gap down opening.
Trend Continuation – Entering if strong momentum follows positive/negative results.
Fade the Move – If reaction is exaggerated, traders bet on reversal.
Sector Sympathy Play – Trading other stocks in the same sector (if Infosys beats, TCS/Wipro may rise too).
9. Options Trading During Earnings Season
Earnings season is heaven for options traders, because volatility spikes.
Implied Volatility (IV) rises before results, making options expensive.
After results, IV crush happens, reducing option premiums.
Strategies used:
Straddles/Strangles – To capture big moves in either direction.
Iron Condors – If expecting limited movement.
Directional Calls/Puts – If confident about result outcome.
Smart traders manage risk by sizing positions carefully and understanding IV dynamics.
10. Sector & Macro-Level Effects of Earnings Season
Quarterly results don’t just affect individual stocks—they influence entire sectors and indices.
Banking & Finance – HDFC Bank, ICICI Bank results affect Nifty Bank.
IT Sector – Infosys, TCS, Wipro results set the tone for tech stocks.
FMCG – HUL, Nestle results impact consumption sector.
Global Impact – US earnings (Apple, Microsoft, Tesla) influence Nasdaq & Indian IT stocks.
Thus, earnings season often drives short-term market direction.
11. Risks in Quarterly Results Trading
While opportunities are high, so are risks:
Gap Risk – Overnight positions can open with large gaps.
High Volatility – Rapid price swings can trigger stop losses.
Option Premium Decay – IV crush can cause losses even if direction is correct.
Overreaction – Stocks sometimes move irrationally post results.
Risk management is crucial—small position sizing, defined stop-loss, and not overtrading.
Conclusion
Quarterly results trading, or earnings season trading, is one of the most exciting and challenging periods in the market. It offers massive opportunities due to sharp price moves, but also carries high risks.
A successful earnings season trader:
Balances expectations vs reality,
Uses a mix of fundamental + technical + sentiment analysis,
Trades with discipline and proper risk management,
Learns from past case studies and market psychology.
In short, quarterly results trading is a battlefield of expectations, numbers, and emotions. Those who prepare, analyze, and execute carefully can capture some of the best moves of the year.

Options Trading in India1. Introduction to Options Trading
Options trading has become one of the fastest-growing segments of the Indian financial market. Once considered a playground only for institutions and advanced traders, options are now widely accessible to retail investors thanks to online trading platforms, mobile apps, and reduced brokerage costs.
In India, the NSE (National Stock Exchange) is the world’s largest derivatives exchange in terms of contracts traded, with Bank Nifty and Nifty 50 options leading the charge. For retail traders, options present opportunities for hedging, speculation, and income generation, making them versatile instruments.
But options are also complex. Unlike stocks, where you directly own a piece of a company, options are derivative contracts—their value depends on the price of an underlying asset. This makes them both powerful and risky if not understood properly.
2. What are Options?
An option is a financial contract that gives the buyer the right, but not the obligation, to buy or sell an underlying asset at a predetermined price (strike price) before or on a specific date (expiry).
Call Option → Right to buy an asset at a strike price.
Put Option → Right to sell an asset at a strike price.
Unlike futures contracts, option buyers are not obligated to execute the trade. They can choose to let the option expire worthless if the trade doesn’t go their way.
3. Key Terms in Options Trading
Strike Price: The price at which you can buy/sell the underlying.
Premium: The cost paid to buy the option.
Expiry Date: Last day the option is valid (weekly/monthly in India).
Lot Size: Minimum tradable quantity (e.g., Nifty options = 25 units per lot).
ITM (In the Money): Option has intrinsic value.
ATM (At the Money): Strike price = underlying price.
OTM (Out of the Money): Option has no intrinsic value.
4. How Options Work (Indian Example)
Let’s take an example with Nifty 50 trading at ₹22,000:
Suppose you buy a Nifty 22,200 Call Option for a premium of ₹100 (lot size = 25).
Total cost = 100 × 25 = ₹2,500.
Case 1: Nifty goes up to 22,400
Intrinsic value = 22,400 – 22,200 = ₹200
Profit per lot = (200 – 100) × 25 = ₹2,500
Case 2: Nifty stays at 22,000 or falls
Option expires worthless.
Loss = Premium paid = ₹2,500
This asymmetry—limited risk, unlimited reward—is what attracts many retail traders to options.
5. Why Trade Options?
Leverage: Trade larger positions with smaller capital.
Hedging: Protect your portfolio against market falls.
Speculation: Bet on market direction with limited risk.
Income Generation: Write (sell) options to earn premium.
6. Options Market in India
Introduced in 2001 by NSE with index options.
Stock options followed in 2002.
India now has weekly expiries for Nifty, Bank Nifty, and FinNifty.
SEBI & Exchanges regulate margin rules, position limits, and trading practices.
The retail participation in options has exploded post-2020 with apps like Zerodha, Upstox, Angel One, Groww, making it extremely easy to trade.
7. Option Premium & Pricing (The Greeks Simplified)
Premium depends on:
Intrinsic Value = difference between spot & strike.
Time Value = extra value based on time to expiry & volatility.
The Greeks explain sensitivity of option price:
Delta: Sensitivity to underlying price.
Theta: Time decay (options lose value as expiry nears).
Vega: Sensitivity to volatility.
Gamma: Rate of change of Delta.
For example, Indian traders often notice how Bank Nifty weekly options lose value rapidly on expiry day (Theta decay)—which is why option sellers make money on “expiry day trading.”
8. Types of Options in India
Index Options – Nifty 50, Bank Nifty, FinNifty (most liquid).
Stock Options – Individual companies like Reliance, TCS, HDFC Bank.
Currency Options – USD/INR, EUR/INR (for forex hedging).
9. Options Trading Strategies
Basic Strategies
Long Call → Buy call, bullish.
Long Put → Buy put, bearish.
Covered Call → Own stock + sell call for income.
Protective Put → Own stock + buy put for protection.
Intermediate Strategies
Straddle: Buy Call + Put at same strike (bet on volatility).
Strangle: Buy Call (higher strike) + Put (lower strike).
Bull Call Spread: Buy low strike call + sell higher strike call.
Bear Put Spread: Buy put + sell lower strike put.
Advanced Strategies
Iron Condor: Range-bound strategy selling OTM call + put spreads.
Butterfly Spread: Profit from low volatility near strike.
Ratio Spreads: Adjust risk/reward with multiple options.
10. Margin Requirements & Leverage
Option buyers: Pay only premium (small capital).
Option sellers (writers): Need large margin (higher risk).
NSE SPAN + Exposure margin system determines requirements.
For example, selling 1 lot of Bank Nifty option may require ₹1.5–2 lakh margin depending on volatility.
11. Taxation of Options in India
Treated as business income under Income Tax Act.
Classified as non-speculative business income (since traded on exchange).
Profits taxed as per slab rate; audit required if turnover exceeds limits.
12. Risks in Options Trading
Time decay eats premium if direction isn’t quick.
Volatility crush reduces premium post-events (like RBI policy).
Unlimited risk for sellers if market moves sharply.
Liquidity issues in some stock options.
13. Options Trading Psychology
Requires discipline & patience—most beginners lose by overtrading.
Emotions like fear of missing out (FOMO) or greed destroy capital.
Successful option traders often specialize in 1–2 instruments (e.g., Bank Nifty weekly options).
14. Conclusion
Options trading in India has transformed from a niche product for institutions into a mainstream retail trading instrument. The flexibility of calls and puts allows traders to profit in any market—rising, falling, or sideways. However, the high leverage and complexity mean traders must respect risk management, taxation rules, and psychology.
For beginners, the right path is to:
Start with small option buying.
Learn option chain, Greeks, and price behavior.
Slowly graduate to spreads and hedged strategies.
Avoid naked selling until well-capitalized.
With discipline, knowledge, and the right strategies, options can become a powerful tool for wealth creation, hedging, and trading opportunities in India’s growing markets.
Market Structure AnalysisIntroduction
In financial markets, price never moves randomly, even though it may appear chaotic at first glance. Beneath the constant fluctuations lies an organized framework that reflects the collective psychology of traders, investors, and institutions. This underlying framework is what we call Market Structure.
Market structure analysis is the study of how price moves, consolidates, trends, and reverses, and how participants’ decisions are reflected in these patterns. For a trader, understanding market structure is like learning the grammar of a new language—once mastered, it allows you to read the market’s story in real time.
This guide will explore the concept of market structure in detail, covering its building blocks, types, applications in trading, and advanced institutional perspectives.
Chapter 1: What is Market Structure?
At its core, market structure refers to the framework that price follows on a chart. It represents the sequence of higher highs (HH), higher lows (HL), lower highs (LH), and lower lows (LL). These swings reveal whether the market is trending upward, trending downward, or consolidating.
Uptrend: Higher highs + higher lows.
Downtrend: Lower lows + lower highs.
Range-bound: Horizontal highs and lows.
In essence, market structure maps who is in control:
Buyers (bulls) dominate in uptrends.
Sellers (bears) dominate in downtrends.
Neither dominates in consolidations.
This structural perspective is timeless—it applies whether you are looking at a 1-minute chart of Nifty futures or a monthly chart of Reliance Industries.
Chapter 2: The Building Blocks of Market Structure
To truly master market structure, one must recognize its core components:
1. Swing Highs & Swing Lows
A swing high is a peak surrounded by lower highs.
A swing low is a trough surrounded by higher lows.
These form the foundation of trend identification.
2. Break of Structure (BOS)
When price breaks a previous swing high/low, it signals potential trend continuation. Example: if Nifty breaks above its previous high, structure confirms bullish control.
3. Change of Character (ChoCh)
A ChoCh occurs when price shifts from making higher highs to lower lows (or vice versa). It’s the earliest sign of a trend reversal.
4. Liquidity Zones
Market structure is closely tied to liquidity. Stop-loss orders often rest below swing lows or above swing highs. Smart traders and institutions target these zones before resuming the main trend.
5. Order Blocks & Supply/Demand Zones
Order block: A consolidation before a strong move, showing where institutions placed large orders.
Demand zone: Area where buyers step in aggressively.
Supply zone: Area where sellers dominate.
Chapter 3: Phases of Market Structure
Market structure doesn’t remain constant—it evolves through phases:
Accumulation Phase
Price moves sideways after a downtrend.
Smart money quietly accumulates positions.
Seen before major rallies.
Markup Phase
Clear uptrend begins with higher highs and higher lows.
Retail traders join the move late.
Distribution Phase
After a prolonged rally, price consolidates at the top.
Institutions offload positions to late buyers.
Markdown Phase
Downtrend begins with lower highs and lower lows.
Panic selling occurs.
This cycle repeats endlessly across timeframes, forming the backbone of market psychology.
Chapter 4: Trend Analysis with Market Structure
Uptrend Structure
Formation: HH → HL → HH → HL.
Confirmation: Break of previous HH.
Invalidated when: A LL forms.
Downtrend Structure
Formation: LL → LH → LL → LH.
Confirmation: Break of previous LL.
Invalidated when: A HH forms.
Ranging Market
Price oscillates between support & resistance.
Market accumulates liquidity before breakout.
A trader who can correctly identify which phase the market is in gains a strategic edge.
Chapter 5: Institutional Perspective of Market Structure
Retail traders often chase price, while institutions engineer liquidity. To understand real market structure, we must adopt the institutional lens.
Liquidity Hunts: Price spikes above resistance or below support are often “stop hunts” to collect liquidity before reversing.
False Breakouts: Institutions create fake moves to mislead retail traders.
Order Flow: Real structure forms around institutional buying/selling, not random retail trades.
Smart Money Concepts (SMC) emphasize that market structure is not just about patterns—it’s about where liquidity is pooled and how it’s manipulated.
Chapter 6: Tools to Analyze Market Structure
Multi-Timeframe Analysis (MTFA)
Higher timeframes show dominant structure.
Lower timeframes provide entries.
Example: Daily trend is up, but 5-min chart offers entry pullbacks.
Volume Profile
Market structure becomes more powerful when combined with volume.
High volume at support/resistance confirms institutional activity.
Moving Averages
Help visualize structural direction.
200 EMA for long-term trend, 20 EMA for short-term pullbacks.
Fibonacci Levels
Retracement levels align with swing lows/highs.
Confluence strengthens structural setups.
Chapter 7: Practical Applications of Market Structure
Entry Points
Enter on retest of broken structure (BOS).
Enter near demand zones in uptrend, supply zones in downtrend.
Stop Loss Placement
Below last swing low in uptrend.
Above last swing high in downtrend.
Take Profit Levels
Next structural swing.
Previous high/low as targets.
Scalping, Swing, Position Trading
Scalpers use intraday structure.
Swing traders follow daily/weekly swings.
Investors watch monthly structure.
Chapter 8: Case Study – Market Structure in Nifty & Bank Nifty
Example 1: Nifty forms HH-HL pattern for weeks. When it breaks structure (ChoCh), a reversal begins.
Example 2: Bank Nifty hunts liquidity below a key support, only to rally back up, showing institutional manipulation.
Market structure analysis consistently reveals the hidden story behind price movements.
Chapter 9: Common Mistakes in Market Structure Analysis
Ignoring higher timeframe structure.
Confusing minor pullbacks with full reversals.
Over-trading every swing instead of waiting for confirmation.
Blindly trusting indicators without structure context.
Chapter 10: Advanced Market Structure Concepts
Fractals
Structure repeats across timeframes.
A daily uptrend may contain intraday downtrends.
Wyckoff Theory Integration
Accumulation and distribution patterns align perfectly with structural shifts.
Liquidity Maps
Mapping swing highs/lows helps predict stop hunts.
Conclusion
Market Structure Analysis is not just a trading tool—it is the foundation of price action trading. By learning to read swing highs, swing lows, breaks of structure, and liquidity grabs, traders gain the ability to anticipate market moves with precision.
Unlike lagging indicators, structure reveals real-time intent of market participants. Whether you are an intraday scalper, swing trader, or long-term investor, market structure is your compass in the ever-changing landscape of financial markets.
Mastering it requires practice, patience, and discipline, but once understood, it transforms how you see the market—no longer as random noise, but as an organized story driven by psychology and institutional activity.
Banking & Financial Sector TradingIntroduction
The banking and financial sector is often called the “backbone of the economy.” It provides credit, liquidity, and financial services that allow businesses, governments, and households to function smoothly. In the stock market, the Bank Nifty Index (for banking) and the Nifty Financial Services Index (for financials) are widely tracked because they reflect the health of India’s financial system. Traders and investors keep a very close eye on these sectors because movements here often lead the overall market direction.
Trading in the banking and financial sector is not just about price speculation—it’s about understanding monetary policy, liquidity, credit cycles, interest rates, and even global market cues. In India, the sector is home to giant players like HDFC Bank, ICICI Bank, SBI, Axis Bank, Kotak Mahindra Bank, Bajaj Finance, HDFC Ltd., and insurance companies like SBI Life, ICICI Prudential, etc. These stocks often have high weightage in Nifty 50 and Bank Nifty, making them critical for traders.
In this guide, we’ll explore the dynamics of banking and financial sector trading in detail—covering fundamentals, technical aspects, strategies, and risks.
1. Importance of Banking & Financial Sector in Markets
1.1. Market Leadership
Banking and financial stocks carry a huge weightage in indices like Nifty 50 (about 35–40%) and Bank Nifty (100% financials).
Their movement can pull up or drag down the entire market.
1.2. Economic Indicator
A strong banking sector signals credit growth, consumer demand, and corporate expansion.
Weak banking stocks often warn of bad loans (NPAs), liquidity crunches, or slowing growth.
1.3. Liquidity Provider
Banks are intermediaries that channel savings into investments.
NBFCs (Non-Banking Financial Companies) provide credit in segments where banks are limited (retail loans, small businesses, etc.).
1.4. Regulatory Influence
RBI policy decisions (repo rate, CRR, SLR) directly impact profitability of banks and NBFCs.
Insurance and AMC regulations also affect financial services companies.
2. Key Drivers of Banking & Financial Stocks
2.1. Interest Rates & Monetary Policy
Banks earn profit through Net Interest Margin (NIM) = Interest earned – Interest paid.
When RBI hikes rates, borrowing costs rise, loan demand may slow, and NIMs can shrink.
NBFCs, which depend on borrowing from banks/markets, suffer more in a rising rate cycle.
2.2. Credit Growth
Rising loan disbursements (retail, housing, corporate) show healthy demand and economic expansion.
Slowing credit growth indicates weak business activity.
2.3. Asset Quality & NPAs
Non-performing assets (bad loans) directly impact profitability.
Market reacts sharply to NPA trends in quarterly results.
2.4. Global Cues
US Fed interest rates, global liquidity, and FII flows strongly influence Indian financials.
Banking and financial stocks are FII favorites due to their scale and liquidity.
2.5. Regulations & Reforms
RBI norms on lending, provisioning, and digital banking.
Reforms like PSU bank recapitalization or mergers often trigger big moves.
3. Major Segments in Banking & Financial Sector
3.1. Public Sector Banks (PSBs)
Examples: SBI, PNB, Bank of Baroda.
Sensitive to government policies and recapitalization news.
Often trade at lower valuations compared to private banks.
3.2. Private Sector Banks
Examples: HDFC Bank, ICICI Bank, Axis Bank, Kotak Bank.
Preferred by investors for efficiency, growth, and better asset quality.
3.3. NBFCs & Housing Finance Companies (HFCs)
Examples: Bajaj Finance, HDFC Ltd., LIC Housing Finance.
More volatile due to dependence on borrowing.
Sensitive to liquidity conditions (IL&FS crisis in 2018 showed the risks).
3.4. Insurance Companies
Examples: SBI Life, HDFC Life, ICICI Prudential.
Long-term business models; growth tied to financialization of savings.
Sensitive to regulations, persistency ratios, and premium growth.
3.5. Asset Management Companies (AMCs)
Examples: HDFC AMC, Nippon Life AMC.
Earnings linked to equity market performance and SIP inflows.
4. Trading Approaches for Banking & Financial Sector
4.1. Fundamental Trading
Focus on quarterly results (NIMs, NPAs, loan growth, provisions).
Trade based on monetary policy expectations.
Position around events like RBI policy, Fed meetings, budget announcements.
4.2. Technical Trading
Use Bank Nifty and FinNifty charts for market direction.
Patterns like breakouts, volume surges, and moving averages are reliable due to high liquidity.
4.3. Options Trading in Bank Nifty
Bank Nifty options are among the most liquid in India.
Strategies: Straddle, Strangle, Iron Condor, Bull Call Spread—especially effective around RBI policy days.
4.4. Event-Based Trading
Quarterly earnings: Banks often move 5–10% after results.
RBI policy announcements: Big intraday volatility.
Budget & government announcements: Impact PSBs and NBFCs.
5. Key Trading Strategies
5.1. Bank Nifty Trend Following
Use 20-day & 50-day EMA crossover.
Trade long when 20 > 50 EMA, short when 20 < 50 EMA.
5.2. Volume Profile & Support-Resistance
Identify high-volume zones on Bank Nifty to trade breakouts.
Example: A breakout above 50,000 level with high volume often leads to strong momentum.
5.3. Options Straddle for RBI Days
Place both Call and Put options near ATM (at-the-money).
RBI policy usually triggers sharp moves, giving profit on one side.
5.4. Pair Trading
Go long on strong private bank (e.g., ICICI Bank) and short on weaker PSU bank (e.g., PNB).
Profits from relative performance rather than market direction.
5.5. Momentum Trading in NBFCs
Stocks like Bajaj Finance, HDFC Ltd. show sharp moves.
Trade based on breakout with tight stop-loss.
6. Risk Management in Banking & Financial Trading
6.1. Volatility Risk
Bank Nifty is more volatile than Nifty.
Use proper stop-loss and position sizing.
6.2. Event Risk
RBI meetings, global Fed decisions can cause whipsaws.
Hedge positions with options.
6.3. Credit Cycle Risk
Sudden rise in NPAs (like during COVID) can crash banking stocks.
Always track asset quality updates.
6.4. Liquidity Risk in NBFCs
NBFCs may face liquidity crunches (e.g., IL&FS crisis).
Traders must stay alert to bond market signals.
7. Case Studies
7.1. Yes Bank Crisis (2018–2020)
Once a market darling, collapsed due to hidden NPAs.
Stock crashed from ₹400+ to below ₹10.
Lesson: Always track asset quality, not just growth numbers.
7.2. HDFC Bank Consistency
Delivered consistent growth in NIMs and low NPAs for years.
Became a favorite for traders and investors alike.
7.3. Bajaj Finance Volatility
Known for strong growth but sharp corrections.
A stock loved by momentum traders.
8. Future Trends in Banking & Financial Sector
8.1. Digital Banking
UPI, fintech partnerships, and digital lending will reshape the sector.
Stocks tied to fintech may see explosive growth.
8.2. Consolidation of PSBs
Mergers will strengthen balance sheets and efficiency.
Trading opportunities in re-rating of PSU banks.
8.3. Global Integration
Indian financial stocks will be increasingly influenced by global capital flows.
8.4. Rise of Retail Participation
Growing SIPs and insurance penetration will boost financial stocks.
9. Practical Trading Checklist
📌 Track RBI policy and global central banks.
📌 Watch NIMs, NPAs, and credit growth in results.
📌 Use Bank Nifty chart for market direction.
📌 Trade with stop-loss and manage risk carefully.
📌 Use options strategies during high-volatility events.
Conclusion
The banking and financial sector is the heartbeat of the stock market. Traders must understand interest rate cycles, credit growth, and regulatory changes to succeed. With indices like Bank Nifty and FinNifty, this sector offers huge liquidity, volatility, and opportunities for both short-term and long-term traders.
Whether you are trading a PSU bank breakout, riding a private bank trend, playing NBFC volatility, or hedging with Bank Nifty options, success depends on combining fundamental awareness with technical precision and disciplined risk management.
In India’s growth journey, the financial sector will continue to lead—making it one of the most exciting and rewarding sectors for trading.

IPO & SME Boom in IndiaIntroduction: The Buzz Around IPOs & SMEs
If you’ve been tracking Indian markets over the past few years, one thing stands out — the IPO wave and the SME listing boom. Almost every week, there’s news about a company raising money from the public, debuting on stock exchanges, and often giving blockbuster returns on listing day.
From giants like Zomato, Nykaa, Paytm, LIC, and Mamaearth to smaller, lesser-known firms in the SME (Small & Medium Enterprises) segment, India has seen an unprecedented surge in public fundraising.
What’s fueling this boom? Why are companies rushing to the markets? Why are investors — big and small — so excited? And most importantly, how does this change the future of Indian capital markets?
That’s exactly what we’ll explore in this detailed guide.
1. What is an IPO? (Back to Basics)
IPO stands for Initial Public Offering.
In simple words, it’s when a private company decides to “go public” by listing its shares on the stock exchange and raising money from retail and institutional investors.
Before IPO → Company is owned by founders, early investors, and maybe venture capitalists.
After IPO → Anyone can buy its shares in the stock market, and ownership spreads among lakhs of investors.
The company uses IPO money for:
Expansion
Debt repayment
New product launches
Strengthening balance sheet
For investors, IPOs are exciting because they offer a chance to “get in early” before a company grows bigger on the stock market.
2. The Indian IPO Story – From Dormant to Booming
India wasn’t always this IPO-crazy.
1990s–2000s → Many IPOs, but regulation was weak. Investors often got trapped in poor-quality listings.
2010–2015 → IPO market slowed down. Companies hesitated, investors were cautious.
2016 onwards → Strong regulations by SEBI, better transparency, growing Indian economy, and rising retail participation changed the game.
The real boom began post-2020. Despite Covid, companies started tapping markets aggressively:
Digital firms like Zomato, PolicyBazaar, Paytm, Nykaa became household IPO names.
Record amounts of money were raised (₹1.2 lakh crore in 2021 alone).
SME listings exploded as smaller companies found easier routes to capital.
India’s IPO market is now one of the most vibrant in the world.
3. Why IPOs are Booming in India?
There are several reasons:
a) Strong Economy
India is one of the fastest-growing economies globally, with a rising middle class and consumption-driven growth. Companies see expansion opportunities and need capital.
b) Deep Investor Pool
Retail investors (ordinary individuals) are participating like never before.
Over 15 crore Demat accounts exist in India today (up from ~4 crore in 2019).
Mutual funds, FIIs (Foreign Institutional Investors), and DIIs (Domestic Institutional Investors) provide strong demand.
c) Startup Ecosystem
India is home to 100+ unicorns (startups valued at $1 billion+). Many of these are backed by global venture capital and private equity funds that want exits through IPOs.
d) Strong Regulations & Technology
SEBI tightened rules, making IPOs more transparent.
Online platforms like Zerodha, Groww, Upstox made IPO participation easy for retail investors.
e) Success Stories & FOMO
Some IPOs gave massive listing gains. For example:
Paras Defence IPO (2021) was subscribed 304 times.
Many SME IPOs gave 100%+ returns within weeks.
This created a fear of missing out (FOMO), attracting even more retail investors.
4. SME IPO Boom – The Real Game Changer
While large IPOs make headlines, the real silent revolution is happening in the SME IPO space.
What are SME IPOs?
Designed for Small & Medium Enterprises (with limited turnover & size).
Listed on special SME platforms of NSE & BSE (like NSE Emerge, BSE SME).
Lower entry barriers, simpler compliance.
Why SMEs are Booming?
India has 63 million+ SMEs — many are profitable but need growth capital.
Earlier, banks hesitated to lend due to risk. IPO route gave them direct access to funds.
Investor appetite is huge because SME IPOs often give extraordinary returns.
Examples:
Many SME IPOs between 2021–2024 gave 200–500% returns within months.
Subscription levels often cross 100x, showing retail frenzy.
In fact, SME IPOs have outperformed mainboard IPOs in recent years.
5. How Investors Approach IPOs
a) Listing Gains
Most retail investors apply for IPOs hoping for quick profits on listing day. For instance, if IPO price is ₹100 and stock lists at ₹150, that’s a 50% gain.
b) Long-Term Wealth Creation
Some IPOs, like Infosys, TCS, Avenue Supermarts (DMart), created huge long-term wealth for investors.
c) Risk Appetite
Large IPOs = More stable, but lower returns.
SME IPOs = Riskier, but potential for high returns.
6. Risks in the IPO & SME Boom
It’s not all rosy. There are challenges too.
Overvaluation: Some startups list at very high valuations (Paytm IPO flopped due to this).
Speculation: Retail frenzy sometimes ignores fundamentals.
Liquidity Risk in SMEs: Once hype fades, some SME stocks see very low trading volumes.
Regulatory Challenges: SEBI keeps tightening rules to protect investors.
7. Impact on Indian Capital Markets
The IPO & SME boom has changed India’s stock market in big ways:
Increased Depth → More companies, more sectors represented.
Broader Participation → From large FIIs to small-town retail investors, everyone is in.
Wealth Creation → IPOs distribute wealth beyond promoters to the general public.
Global Recognition → India’s IPO market is now compared to the US & China in size and activity.
8. The Future of IPOs & SMEs in India
Looking ahead:
Digital-first companies (AI, fintech, SaaS, EVs, renewable energy) will dominate IPO space.
SME IPOs will keep growing, driven by India’s entrepreneurial energy.
Retail participation will rise further as financial literacy spreads.
Regulations will become stricter to avoid bubble-like situations.
Global investors will continue pouring money as India is seen as the “next big growth story”.
9. Real-Life Investor Perspective
Imagine a small-town investor in Gujarat applying for SME IPOs through his phone. Just 5 years ago, he might have put savings in gold or FD. Today, he applies for an IPO, gets an allotment, and doubles his money in a week.
This shift is massive. It’s not just about finance — it’s about trust in markets and wealth democratization.
10. Key Lessons for Investors
Don’t chase IPOs blindly — study fundamentals.
Don’t get carried away by hype or grey market premium.
Remember: Not all IPOs succeed (example: Paytm listed 27% below issue price).
Diversify — treat IPOs as part of overall portfolio, not the only investment.
Conclusion: A Defining Era
India is witnessing a historic boom in IPOs and SME listings. It’s driven by strong economy, investor enthusiasm, and entrepreneurial energy.
Yes, there are risks, but the broader story is one of wealth creation, financial inclusion, and global recognition.
If the 1990s were about India opening up its economy, the 2020s may well be remembered as the decade when Indian businesses opened up to public markets at an unprecedented scale.
For investors, this is both an opportunity and a challenge:
The opportunity to ride India’s growth story.
The challenge of separating hype from true value.
Either way, the IPO & SME boom is here to stay — and it’s shaping the future of Indian markets.

Part 3 Trading Master Class With Experts Non-Directional Strategies
Used when you expect low or high volatility but no clear trend.
Straddle
When to Use: Expecting big move either way.
Setup: Buy call + Buy put (same strike, same expiry).
Risk: High premium cost.
Reward: Large if price moves sharply.
Strangle
When to Use: Expect big move but want lower cost.
Setup: Buy OTM call + Buy OTM put.
Risk: Lower premium but needs bigger move to profit.
Iron Condor
When to Use: Expect sideways movement.
Setup: Sell OTM call + Buy higher OTM call, Sell OTM put + Buy lower OTM put.
Risk: Limited.
Reward: Premium income.
Butterfly Spread
When to Use: Expect price to stay near a target.
Setup: Combination of long and short calls/puts to profit from low volatility.
