Managing Risk in Trading1. Understanding Risk in Trading
Before managing risk, it’s crucial to define what “risk” means in trading.
Risk is the possibility of losing money when market moves go against your position.
Every trade has two outcomes: profit or loss. Risk is essentially the probability and magnitude of that loss.
Types of Risks in Trading
Market Risk – Prices moving unfavorably due to volatility, economic events, or news.
Liquidity Risk – Not being able to exit a trade quickly at a fair price.
Leverage Risk – Excessive use of borrowed funds magnifying both gains and losses.
Emotional Risk – Poor decision-making under stress, fear, or greed.
Systematic Risk – Broader economic or geopolitical factors affecting all markets.
Idiosyncratic Risk – Specific risks tied to one stock, sector, or currency pair.
The goal of risk management is not to eliminate risk but to control exposure, minimize downside, and maximize the probability of long-term profitability.
2. The Core Principles of Risk Management
Principle 1: Capital Preservation Comes First
The golden rule: Protect your trading capital before chasing profits.
If you lose too much capital, recovering becomes mathematically harder. For example:
A 10% loss requires 11% gain to break even.
A 50% loss requires 100% gain to break even.
Principle 2: Never Risk More Than You Can Afford to Lose
Traders must only invest money that won’t impact essential life expenses. This ensures psychological balance and prevents desperate decisions.
Principle 3: Position Sizing Matters
The size of your trade must reflect the amount of risk you are comfortable taking. Over-leveraging is one of the fastest ways traders blow up accounts.
Principle 4: Accept That Losses Are Part of the Game
No strategy wins 100% of the time. Even top hedge funds experience losing streaks. Successful traders don’t avoid losses—they limit them.
Principle 5: Consistency Over Jackpot
Risk management is about steady, compounding growth rather than chasing one big win.
3. Practical Risk Management Tools
3.1 Stop-Loss Orders
A stop-loss order automatically exits your position once the price hits a pre-defined level.
Example: If you buy a stock at ₹100, you might place a stop-loss at ₹95, limiting potential loss to 5%.
Benefits:
Removes emotional decision-making.
Limits catastrophic losses.
Provides a clear risk-to-reward framework.
3.2 Take-Profit Levels
Just like limiting losses, pre-deciding where to book profits is essential. Greed often prevents traders from closing positions, only to see profits vanish.
3.3 Risk-Reward Ratio
The ratio compares potential profit versus potential loss.
Example: Risking ₹100 to make ₹300 means a 1:3 risk-reward ratio.
Professional traders often only take trades with at least 1:2 or higher ratios.
3.4 Diversification
Avoid putting all money in one trade, sector, or asset class.
Example: If you’re trading equities, also balance with forex, commodities, or bonds.
3.5 Hedging
Using instruments like options or futures to reduce risk.
Example: If you own a stock, buying a put option can protect against downside risk.
3.6 Leverage Control
Leverage magnifies returns but also magnifies losses.
Conservative traders limit leverage to manageable levels (like 2x or 5x), while reckless use (50x or 100x leverage in forex/crypto) can wipe out accounts quickly.
3.7 Volatility Adjustment
Adjusting position size based on market volatility.
Higher volatility → smaller position sizes to avoid large swings.
4. Position Sizing Strategies
Position sizing determines how much of your capital you allocate per trade.
4.1 Fixed Percentage Rule
Risk only a small percentage of capital per trade (commonly 1–2%).
Example: With ₹1,00,000 account, risking 1% = ₹1,000 per trade.
4.2 Kelly Criterion
A formula-based approach to maximize long-term growth while avoiding overexposure.
Balances win probability and risk-reward ratio.
4.3 Volatility-Based Position Sizing
Larger positions in stable markets, smaller ones in volatile conditions.
5. Psychological Risk Management
Emotions are often a bigger risk than the market itself.
5.1 Fear and Greed
Fear prevents traders from entering good trades or causes early exits.
Greed leads to overtrading or holding on too long.
5.2 Discipline
Following a trading plan strictly, regardless of emotions, is crucial.
Consistency beats emotional improvisation.
5.3 Avoid Revenge Trading
After losses, many traders try to “win it back” quickly. This often leads to bigger losses.
5.4 Patience
Waiting for high-probability setups rather than forcing trades is key.
5.5 Mindset
Think like a risk manager first, trader second.
Your job is not to predict markets perfectly but to manage outcomes effectively.
6. Building a Risk Management Plan
A written plan brings discipline and removes impulsive decisions.
Components of a Risk Plan:
Capital at Risk – Decide max loss per trade and per day/week.
Stop-Loss Strategy – Where and how you’ll place stops.
Position Sizing – Percentage risk rules.
Diversification Rules – How to spread trades.
Risk-Reward Criteria – Minimum acceptable ratios.
Review & Journal – Record every trade and analyze mistakes.
7. Real-World Examples
Example 1: Stock Trading
Trader has ₹5,00,000 capital.
Risks 1% per trade = ₹5,000.
Buys shares worth ₹1,00,000 with stop-loss at 5%.
Max loss = ₹5,000 (within plan).
Example 2: Forex Trading
Account size = $10,000.
Risk per trade = 2% ($200).
Chooses 50-pip stop-loss.
Lot size adjusted so each pip equals $4 → max loss $200.
Example 3: Options Trading
Owns stock worth ₹2,00,000.
Buys protective put for ₹5,000 premium.
If stock crashes, loss is capped at strike price.
8. Common Mistakes in Risk Management
Overleveraging – Betting too big.
Moving Stop-Loss – Hoping market turns back.
Ignoring Correlation – Owning multiple assets that move together.
Risking Too Much Too Soon – Overconfidence after small wins.
No Trading Journal – Failing to learn from mistakes.
9. Advanced Risk Management Techniques
Value-at-Risk (VaR) – Statistical measure of max loss at a given confidence level.
Monte Carlo Simulations – Stress testing strategies under random conditions.
Drawdown Analysis – Limiting maximum decline from peak capital.
Trailing Stops – Locking in profits while allowing trades to run.
Options Strategies – Spreads, straddles, collars for advanced hedging.
10. Long-Term Survival Mindset
Trading is not a sprint, it’s a marathon. The objective is to stay in the game long enough to let skill and discipline compound profits.
Think like a casino: Casinos don’t know individual outcomes, but they manage probabilities and always win in the long run.
Compounding works slowly: Preserving capital and growing steadily beats chasing overnight riches.
Final Thoughts
In trading, you cannot control the market, but you can control your exposure, your decisions, and your discipline. Risk management transforms trading from a gamble into a professional endeavor. Without it, even the best strategies fail. With it, even modest strategies can compound wealth over time.
Chart Patterns
Part 9 Trading Master Class With ExpertsOption Greeks in Depth
To truly master options, one must understand the Greeks. These mathematical tools describe how options react to different market factors.
Delta (Δ) – Price Sensitivity
Measures how much an option price changes if stock moves ₹1.
Call options: Delta between 0 and +1.
Put options: Delta between 0 and -1.
Example: If a call has delta = 0.5, and stock rises ₹10, option rises ₹5.
Gamma (Γ) – Acceleration of Delta
Delta itself changes as stock moves. Gamma measures this.
High gamma = higher sensitivity, riskier.
Near expiry, gamma becomes extreme.
Theta (Θ) – Time Decay
Options lose value as time passes (all else equal).
Theta tells how much an option loses daily.
Example: If theta = -5, option loses ₹5/day.
Sellers love theta (they earn decay). Buyers fear it.
Vega (ν) – Volatility Sensitivity
Measures how option reacts to 1% change in volatility.
High volatility = high premium.
Example: If Vega = 10, and implied volatility rises 1%, option price rises ₹10.
Rho (ρ) – Interest Rate Sensitivity
Measures impact of interest rate changes.
Less important in short-term trading.
📌 Takeaway: Greeks are like the dashboard of a car. Without them, you’re driving blind.

Part 7 Trading Master Class With ExpertsOptions vs. Futures vs. Stocks
Stocks: Simple ownership.
Futures: Obligation to buy/sell at a future date.
Options: Rights without obligation.
Options are less risky than futures (for buyers) but more complex.
Real-World Examples
Example 1: You buy Nifty 20,000 Call at ₹100 premium. Lot size = 50.
Cost = ₹5,000.
If Nifty rises to 20,200, your profit = ₹10,000 - ₹5,000 = ₹5,000.
If Nifty stays below 20,000, you lose only premium = ₹5,000.
Psychology & Risk Management
Options are not just math, they need psychology:
Don’t over-leverage.
Accept losses early.
Use stop-loss.
Stick to defined strategies.
Manage emotions of greed and fear.

Part 6 Learn Institutional Trading Deep Dive into Option Strategies
One of the biggest advantages of options is the ability to combine them into structured strategies. Let’s expand on some common and advanced ones:
A. Single-Leg Strategies
These involve buying or selling just one option.
Long Call: Buy a call option expecting prices to rise.
Low risk (limited to premium paid).
High reward if stock surges.
Long Put: Buy a put option expecting prices to fall.
Best for bearish outlook.
Acts as portfolio insurance.
Short Call (Naked Call): Sell a call without owning stock.
You receive premium.
Unlimited risk if stock rises sharply.
Short Put (Naked Put): Sell a put option.
You receive premium.
Big risk if stock collapses.
B. Multi-Leg Strategies (Spreads & Hedging)
Bull Call Spread: Buy a lower strike call & sell a higher strike call.
Profits if stock rises moderately.
Lower risk than naked call.
Bear Put Spread: Buy higher strike put & sell lower strike put.
Works in moderately bearish markets.
Covered Call: Own stock + sell call option.
Generates steady income.
Capped upside potential.
Protective Put: Own stock + buy put option.
Insurance against stock falling.

Part 4 Learn Institutional Trading Option Greeks (Risk Measures)
Greeks are mathematical tools that measure how sensitive an option is to different factors:
Delta: Sensitivity to price change. (How much option moves if stock moves ₹1).
Gamma: Rate of change of delta.
Theta: Time decay (how much option loses value as expiry nears).
Vega: Sensitivity to volatility.
Rho: Sensitivity to interest rates.
Traders use Greeks to build precise strategies.
Option Strategies
Options can be combined into powerful strategies:
Single-leg: Buy call, Buy put, Sell call, Sell put.
Spreads: Bull call spread, Bear put spread.
Neutral strategies: Iron condor, Butterfly spread, Straddle, Strangle.
Advanced: Calendar spread, Ratio spread.
Each strategy suits different market conditions (bullish, bearish, sideways, volatile).

Part 1 Ride The Big MovesIntroduction to Options
In the world of financial markets, people look for different ways to make money, reduce risk, or take positions on where they think markets are headed. Apart from buying and selling stocks directly, one of the most powerful tools available is options trading.
Options are a type of derivative contract. This means their value is derived from an underlying asset like a stock, index, currency, or commodity. They give traders and investors flexibility because they can be used for speculation (betting on price movements), hedging (protecting against risks), or even for generating steady income.
Unlike stocks where ownership is straightforward (you buy a share, you own part of the company), options are contracts with special terms, conditions, and expiry dates. This makes them more complex but also more versatile.
For example: If you believe a stock price will rise in the next month, you don’t necessarily need to buy the stock. Instead, you can buy a call option, which gives you the right to buy that stock at a certain price later. Similarly, if you think the stock will fall, you can buy a put option, which gives you the right to sell at a certain price.
This flexibility makes options attractive to professional traders, institutions, and even retail traders who want to manage risk or boost returns.
But with power comes responsibility—options can be risky if not understood properly. That’s why it’s important to study them in depth.
Types of Options (Call & Put)
Call Option (Bullish bet):
If you expect the stock price to go up, you buy a call. Example: Reliance stock is ₹2,500. You buy a call option with strike price ₹2,600. If stock rises above ₹2,600, your option gains value.
Put Option (Bearish bet):
If you expect the stock price to fall, you buy a put. Example: Infosys stock is ₹1,500. You buy a put option with strike price ₹1,400. If stock falls below ₹1,400, your option gains value.
Both call and put can be bought or sold (written). Selling options means you take on obligations, which is riskier but gives you upfront premium income.

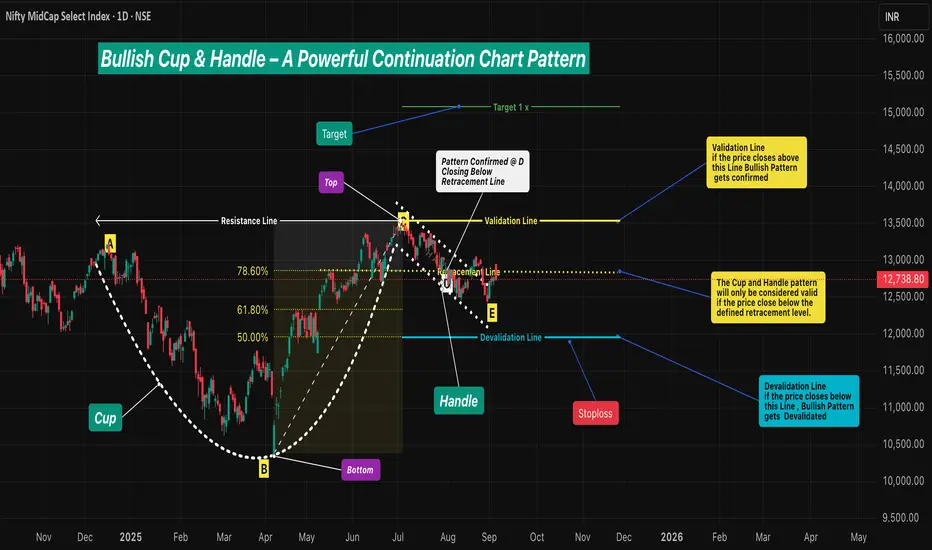
Bullish Cup & Handle – A Powerful Continuation Chart Pattern🔹 Intro / Overview
☕ The Cup and Handle is a 📈 bullish continuation pattern often studied in technical analysis.
⚔️ It forms when there is a fight between bulls 🐂 and bears 🐻 — the Cup develops as both remain strong.
📉 During the Handle, sellers 🛑 temporarily gain strength.
📈 But when price closes above the Validation Line, buyers regain control 💪 and bullish momentum dominates.
____________________________________________________________
📖 How to Identify
✅ Validation → The pattern is valid if price closes above the Validation Line.
❌ Devalidation → The pattern is invalid if price closes below the Devalidation Line(before Validation).
📉 Retracement Rule →The pattern is only confirmed if the price closes below the Retracement Line during the Handle formation.
This ensures a proper pullback forms before breakout .
____________________________________________________________
📖 Key Points of Pattern
✅ A valid Cup requires the retracement condition — confirmation occurs only if price closes below the Retracement Line .
⚖️ Balanced Highs → Point A (left peak) and Point C (right peak) should be relatively close in price, ensuring a proper Cup shape 🍵.
🔒 The Handle must not break the structural integrity of the Cup.(No Close Below Devalidation Lines)
____________________________________________________________
🎯 Trading Plan (Educational Only)
📌 Entry → Considered only after confirmation when price closes above the Validation Line.
🛡️ Stop-Loss (SL) → After validation, the Devalidation Line may act as an SL.
🎯 Target (TP) →
First Target → 1R (equal to the risk defined by Entry–SL distance).
Remaining Lots → Trail using ATR, Fibonacci levels, Box Trailing, or structure-based stops.
____________________________________________________________
📊 Chart Explanation
🍵 The Cup forms with a rounded base Point B and two balanced tops: Point A (left peak) & Point C (right peak) - The marginal price difference should be small to ensure a reliable Cup.
📈 The Retracement Line ( Point D ) confirms the pattern only if price closes below the Fibonacci Level of 78.60% and above the 50.00% .
📉 The Handle develops as price pulls back, with Point E marking the Handle low. and Good Handle of Cup is Formed (this low should not go below 50.00% Level )
📏 The Fibonacci retracement levels are drawn from Point B (Cup base) to Point C (right peak). These levels provide a reference framework to observe Retracement (minimum 78.60%) , Validation (100.00%) , and Devalidation (50.00%) areas for educational study of the structure.
____________________________________________________________
👀 Observations
✨ Works best after a strong uptrend 🚀 or at major support–resistance zones 🧱.
⚖️ A balanced Cup (Top Right ≈ Top Left) improves reliability.
📏 Handle Formation
The Handle should be shorter than the Cup depth — and should also be longer than the required minimum depth for proper structure.
If the Handle is too deep, it weakens the setup — and also if it is too short, the formation loses reliability.
____________________________________________________________
❗ Why It Matters
🔍 Shows the market battle between buyers and sellers.
💪 Highlights how buyers regain dominance after retracement validation.
⚖️ Balanced structure + strict rules = better filtering of weak setups.
📝 Provides clarity on entry, SL, and TP with a structured framework.
____________________________________________________________
🎯 Conclusion
The Cup and Handle pattern, when validated through Fibonacci retracement rules 📉, balanced highs ⚖️, and proper Handle structure 🔒, offers a disciplined framework for studying bullish continuation setups.
🔥 Patterns don’t predict. Rules protect.
____________________________________________________________
⚠️ Disclaimer
📘 For educational purposes only.
🙅 Not SEBI registered.
❌ Not a buy/sell recommendation.
🧠 Purely a learning resource.
📊 Not Financial Advice.
Inflation and Its Impact on Markets1. Understanding Inflation
1.1 Definition
Inflation is the rate at which the general level of prices for goods and services rises, eroding the purchasing power of money. If the inflation rate is 6% annually, an item costing ₹100 this year will cost ₹106 the next year, assuming all else remains equal.
1.2 Causes of Inflation
Economists generally classify inflation into two broad categories:
Demand-Pull Inflation – Occurs when aggregate demand in an economy outpaces aggregate supply. Example: rising consumer spending, government expenditure, or investment that pushes up prices.
Cost-Push Inflation – Triggered when production costs rise (e.g., due to higher wages, raw material costs, or supply chain disruptions), and businesses pass these costs onto consumers.
Other causes include monetary expansion (too much money chasing too few goods), structural bottlenecks, taxation policies, or geopolitical crises that disrupt supply chains.
1.3 Types of Inflation
Creeping Inflation: Mild (1–3% annually), often seen as healthy for growth.
Walking Inflation: Moderate (3–10% annually), may start hurting purchasing power.
Galloping Inflation: Double-digit inflation, destabilizes economies.
Hyperinflation: Prices rise uncontrollably (e.g., Zimbabwe, Venezuela).
Stagflation: Inflation combined with stagnation in economic growth and high unemployment (1970s U.S. example).
Deflation: Persistent fall in prices, often damaging as it discourages spending and investment.
1.4 Measuring Inflation
Common indicators include:
Consumer Price Index (CPI): Tracks retail prices of a basket of goods and services.
Wholesale Price Index (WPI): Measures price changes at the wholesale level.
Producer Price Index (PPI): Monitors prices from the producer’s perspective.
GDP Deflator: Broader measure of inflation in an economy.
2. Inflation and Its Impact on Financial Markets
Inflation has a multi-dimensional impact on different segments of financial markets. Let’s examine them one by one.
2.1 Impact on Stock Markets
Stocks represent ownership in companies, and inflation affects corporate earnings, investor sentiment, and valuation multiples.
Corporate Profits:
Rising inflation increases costs of raw materials, wages, and borrowing. If companies cannot pass these costs to consumers, their profit margins shrink.
Valuation Multiples:
Higher inflation leads to higher interest rates (central banks hike rates to control inflation). As rates rise, the present value of future cash flows declines, leading to lower stock valuations (P/E ratios fall).
Sectoral Impact:
Winners: Commodity producers (oil, metals, agriculture), energy firms, FMCG companies with strong pricing power.
Losers: Consumer discretionary, technology, and financials (due to margin pressure and higher cost of capital).
Investor Sentiment:
Inflation creates uncertainty. Equity markets often turn volatile during inflationary phases as investors reassess growth prospects.
Example: In the 1970s U.S., inflation was extremely high due to oil shocks, and stock markets delivered poor real returns.
2.2 Impact on Bond Markets
Bonds are highly sensitive to inflation because they provide fixed income.
Interest Rates and Yields: When inflation rises, central banks raise policy rates. This pushes bond yields up, causing bond prices to fall.
Real Returns: Inflation erodes the real return of fixed-income instruments. For example, if a bond yields 5% but inflation is 7%, the real return is –2%.
Inflation-Indexed Bonds: Governments issue instruments like TIPS (Treasury Inflation-Protected Securities) in the U.S. or Inflation-Indexed Bonds in India to protect investors.
Conclusion: High inflation is generally negative for bondholders, except for inflation-linked securities.
2.3 Impact on Currency Markets
Inflation has direct implications for currency values in the forex market.
Currency Depreciation: High inflation erodes purchasing power and often leads to depreciation of a country’s currency.
Interest Rate Differential: Central banks raise rates to curb inflation, which can temporarily strengthen a currency due to higher returns on domestic assets.
Trade Balance: Inflation makes exports costlier and imports cheaper, widening trade deficits, further pressuring the currency.
Example: Turkish lira has depreciated sharply in recent years due to persistently high inflation.
2.4 Impact on Commodity Markets
Commodities as Hedge: Commodities like gold, oil, and agricultural goods often perform well during inflationary periods, as they are tangible assets.
Input Cost Pressures: Rising commodity prices themselves fuel inflation, creating a feedback loop.
Energy Prices: Oil price shocks are among the most common triggers of global inflation.
2.5 Impact on Real Estate
Real estate is often seen as a hedge against inflation.
Positive Effects: Property values and rental incomes tend to rise with inflation, protecting investors.
Negative Effects: High interest rates increase mortgage costs, reducing affordability and slowing demand.
Commercial Real Estate: Long-term leases may lag inflation, impacting yields for landlords.
3. Inflation and Central Bank Policies
Central banks, such as the Federal Reserve (U.S.), European Central Bank (ECB), and Reserve Bank of India (RBI), play a pivotal role in managing inflation.
3.1 Tools of Monetary Policy
Interest Rate Hikes: To cool demand.
Open Market Operations: Controlling money supply.
Cash Reserve Ratio / Statutory Liquidity Ratio: Used by RBI to regulate liquidity.
Forward Guidance: Communicating policy stance to manage expectations.
3.2 Inflation Targeting
Many central banks adopt formal inflation targets (e.g., 2% in the U.S. and Eurozone, 4% in India) to maintain price stability.
3.3 Dilemma for Policymakers
Too Aggressive Tightening: Risks slowing growth or causing recession.
Too Soft: Risks runaway inflation.
4. Historical and Global Case Studies
4.1 The U.S. in the 1970s – Stagflation
Oil price shocks triggered high inflation + low growth.
Stock markets stagnated, bonds suffered, commodities soared.
4.2 Zimbabwe (2000s) – Hyperinflation
Prices doubled every few hours.
Currency lost value, people resorted to barter trade.
Financial markets collapsed.
4.3 India (2010–2013) – High Inflation Phase
CPI and WPI inflation soared due to food and fuel prices.
RBI raised rates multiple times, slowing growth.
Equity markets remained volatile, bond yields spiked.
4.4 Pandemic & Post-Pandemic (2020–2023)
Global supply chain disruptions + fiscal stimulus led to inflation surge.
Central banks responded with aggressive rate hikes.
Stock markets turned volatile, real estate demand shifted, commodity prices spiked.
5. Inflation and Investor Strategies
Investors cannot control inflation, but they can adapt strategies to protect their wealth.
5.1 Hedging Against Inflation
Commodities: Gold, silver, oil, agricultural products.
Real Assets: Real estate, infrastructure.
Equities: Companies with strong pricing power, dividend-paying stocks.
Inflation-Protected Bonds: TIPS, index-linked government securities.
5.2 Portfolio Diversification
Balancing equities, bonds, commodities, and alternative assets reduces the risk of inflation eroding overall portfolio value.
5.3 Sector Rotation
Moving investments into inflation-friendly sectors (energy, utilities, consumer staples) during high inflationary phases.
6. Broader Economic and Social Implications
Purchasing Power: Consumers struggle as essential goods (food, fuel) become costlier.
Wage-Price Spiral: Workers demand higher wages → businesses increase prices → further inflation.
Inequality: Inflation hurts low-income households more, as they spend a larger share of income on essentials.
Political Instability: Persistent inflation can lead to social unrest, protests, and government changes.
7. Conclusion
Inflation is a double-edged sword. Controlled inflation is a sign of a healthy, growing economy, ensuring that demand is strong and businesses are profitable. But when inflation becomes excessive or unpredictable, it erodes purchasing power, distorts investment decisions, destabilizes financial markets, and undermines trust in economic management.
Its impact on markets is wide-ranging:
Stocks face pressure due to higher costs and lower valuations.
Bonds lose value as yields rise.
Currencies depreciate if inflation is uncontrolled.
Commodities and real estate often benefit, acting as hedges.
For policymakers, investors, and ordinary citizens, understanding inflation is essential. It is not merely an economic indicator but a force that shapes market dynamics, business strategies, and household decisions. In an interconnected global economy, inflation in one part of the world can ripple across continents, influencing global capital flows and market stability.

Options vs Buying & Selling in TradingPart 1: Basics of Buying & Selling in Trading
1.1 How It Works
Buying (going long): The trader purchases an asset, expecting its price to rise. Profit comes from selling it later at a higher price.
Selling (going short): The trader sells an asset they don’t own (borrowing it from a broker), expecting its price to fall. Profit comes from buying it back later at a lower price.
Example:
If you buy 100 shares of Tata Steel at ₹120 and sell at ₹150, your profit = ₹30 × 100 = ₹3,000.
If you short 100 shares of Infosys at ₹1,500 and later buy them back at ₹1,400, your profit = ₹100 × 100 = ₹10,000.
1.2 Characteristics of Traditional Trading
Ownership: When you buy, you actually own the asset.
Unlimited upside, unlimited downside (in shorting): Long trades can theoretically go up infinitely, but short trades carry unlimited loss potential.
Capital intensive: You must pay the full value of the asset (unless using margin).
Time horizon: No expiry date; you can hold as long as you want.
1.3 Advantages
Simple and easy to understand.
Ownership benefits like dividends, voting rights in stocks.
No expiry pressure.
1.4 Risks
Large capital required.
Losses can be significant if the market goes against you.
Limited flexibility in terms of strategy.
Part 2: Basics of Options Trading
2.1 What Are Options?
Options are derivative contracts that derive value from an underlying asset (like stocks, indices, commodities, or currencies).
Call Option: Right to buy the asset at a fixed price (strike price).
Put Option: Right to sell the asset at a fixed price.
Options are rights, not obligations. The buyer of an option can choose whether to exercise it, while the seller (writer) is obligated to honor it.
2.2 Example of Options
Suppose Nifty is at 20,000.
You buy a Nifty 20,000 Call Option for a premium of ₹200.
If Nifty rises to 20,500 at expiry, the option’s value = 500. Profit = (500 – 200) = ₹300 per unit.
If Nifty falls to 19,500, you lose only the premium = ₹200.
2.3 Key Features
Leverage: Small premium controls a large value of the asset.
Limited risk for buyers: Maximum loss = premium paid.
Variety of strategies: Options allow profit from up, down, or sideways markets.
Time-bound: Every option has an expiry date.
2.4 Advantages
Cost-efficient way to take positions.
Hedging tool for managing risk.
Flexibility in designing strategies.
Defined risk when buying options.
2.5 Risks
For buyers: Premium decay (time value erosion).
For sellers: Potential unlimited losses.
Complexity compared to direct buying and selling.
Part 3: Options vs Buying/Selling – A Direct Comparison
Feature Traditional Buying/Selling Options Trading
Ownership Yes (when buying) No, it’s a contract
Capital Requirement High Low (premium only)
Leverage Limited (margin needed) Built-in leverage
Risk Unlimited (in shorting) Limited for buyers, unlimited for sellers
Profit Potential Unlimited upside (long) Defined, depending on strategy
Expiry None Always has expiry
Complexity Simple Complex
Uses Investing, long-term holding Hedging, speculation, income strategies
Part 4: Practical Use Cases
4.1 When to Use Traditional Buying & Selling
Long-term investing in stocks.
When you want ownership (e.g., dividends).
When you want simple exposure to price movements.
4.2 When to Use Options
Hedging: An investor holding a stock portfolio buys put options to protect against a fall.
Speculation: A trader buys calls when expecting a sharp rally.
Income generation: Selling options (like covered calls) to earn premiums.
Event trading: Using straddles/strangles during earnings announcements.
Part 5: Risk Management
5.1 In Buying/Selling
Use stop-loss orders.
Diversify portfolio.
Avoid over-leverage.
5.2 In Options
Stick to defined-risk strategies (like spreads).
Understand implied volatility.
Avoid naked option selling without capital cushion.
Part 6: Psychological Differences
Buying & Selling: Feels straightforward, intuitive. Less cognitive load.
Options: Requires strong understanding of Greeks (Delta, Gamma, Theta, Vega). Traders must accept probability-based outcomes.
Part 7: Real-Life Example Comparison
Imagine you expect Reliance to rise from ₹2,500 to ₹2,700.
Method 1 – Buying Shares:
Buy 100 shares @ ₹2,500 = ₹2,50,000 invested.
If price hits ₹2,700 → Profit = ₹20,000.
Risk: If it falls to ₹2,300 → Loss = ₹20,000.
Method 2 – Buying Call Option:
Buy Reliance 2,500 Call @ ₹50 premium = ₹5,000 invested.
If Reliance rises to ₹2,700, intrinsic value = ₹200. Profit = (200 – 50) × 100 = ₹15,000.
If Reliance falls to ₹2,300, loss = only premium ₹5,000.
Here, options gave higher percentage return with limited risk.
Part 8: Long-Term Perspective
Investors prefer buying & holding stocks, as they represent ownership in a growing business.
Traders often use options for short-term moves, hedging, and leverage.
Smart portfolios often combine both: owning core assets while using options for risk management.
Conclusion
Traditional buying and selling is like owning the road—it’s direct, long-term, and stable. Options are like renting a sports car for a specific race—cheaper, faster, but requiring skill and timing.
Neither is inherently better. It depends on:
Risk appetite
Capital available
Market view
Time horizon
Experience level
For beginners, direct buying and selling is a solid foundation. For advanced traders, options open new horizons of creativity and control.
Intraday vs Swing Trading1. Understanding Intraday Trading
Definition
Intraday trading means entering and exiting positions within the same trading day. A trader does not hold any position overnight to avoid overnight risks such as news announcements, earnings reports, or global market volatility.
Characteristics of Intraday Trading
Short Holding Period: Minutes to hours, always squared-off before market close.
High Frequency: Multiple trades per day depending on opportunities.
Focus on Liquidity: Traders choose highly liquid stocks or instruments.
Leverage Usage: Intraday traders often use margin to amplify profits.
Technical Analysis Driven: Relies heavily on charts, price action, and indicators.
Goals of Intraday Traders
Capture small price movements (scalping 0.5–2% moves).
Consistent daily profits rather than waiting for big gains.
Quick decision-making, discipline, and risk management.
2. Understanding Swing Trading
Definition
Swing trading refers to holding positions for a few days to weeks, aiming to capture medium-term price swings. Traders ride upward or downward trends without reacting to every tick.
Characteristics of Swing Trading
Longer Holding Period: From 2–3 days up to several weeks.
Lower Frequency: Fewer trades, but larger profit targets.
Combination of Technical & Fundamental Analysis: Uses chart patterns, moving averages, and sometimes earnings or macroeconomic events.
Tolerance for Overnight Risk: Accepts gaps due to news or global events.
Less Screen Time: Traders analyze at the end of the day and monitor broadly.
Goals of Swing Traders
Catch larger moves (5–20% swings).
Trade with the trend, not intraday noise.
Balance between active trading and long-term investing.
3. Key Differences Between Intraday and Swing Trading
Aspect Intraday Trading Swing Trading
Holding Period Minutes to hours, closed same day Days to weeks
Frequency Many trades daily Few trades monthly
Capital Requirement Lower due to leverage Higher, requires holding without leverage
Risk Level Very high (market noise, leverage) Moderate (overnight risk, but less noise)
Profit Target Small per trade (0.5–2%) Larger per trade (5–20%)
Tools Intraday charts (1-min, 5-min, 15-min) Daily/weekly charts
Time Commitment Full-time, glued to screen Part-time, end-of-day monitoring
Stress Level High, fast decisions needed Lower, patience-based
Best for Aggressive, disciplined traders Patient, trend-following traders
4. Tools & Techniques
Tools for Intraday Trading
Short-term Charts – 1-min, 5-min, 15-min candles.
Indicators – VWAP, RSI, MACD, Bollinger Bands.
Order Types – Market orders, stop-loss, bracket orders.
News Feeds – Corporate announcements, economic data.
Scanners – For identifying stocks with volume and volatility.
Tools for Swing Trading
Daily/Weekly Charts – Identify broader trends.
Indicators – Moving averages (50, 200), RSI, Fibonacci retracement.
Patterns – Head & shoulders, flags, double tops/bottoms.
Fundamentals – Earnings reports, sector trends.
Portfolio Management – Diversification across sectors.
5. Risk & Reward
Intraday Trading Risks
Sudden intraday volatility.
High leverage leading to amplified losses.
Emotional stress leading to overtrading.
Market manipulation in low-volume stocks.
Swing Trading Risks
Overnight gaps due to news or events.
Holding during earnings or geopolitical announcements.
Misjudging long-term trend direction.
Reward Potential
Intraday: Small but frequent gains.
Swing: Fewer but larger gains.
6. Psychology Behind Each Style
Intraday Trader Psychology
Must be quick, disciplined, unemotional.
Can’t afford hesitation; seconds matter.
Needs mental stamina for long hours.
Swing Trader Psychology
Requires patience and conviction in the analysis.
Should handle overnight anxiety calmly.
Avoids micromanaging every tick.
7. Which Style Suits You?
Intraday Trading Suits If:
You can dedicate 6–7 hours daily.
You thrive in fast decision-making.
You handle stress well.
You prefer quick profits.
Swing Trading Suits If:
You have a job or business, can’t sit full-time.
You are patient and prefer analyzing trends.
You’re comfortable holding overnight risk.
You seek balanced trading with less stress.
8. Real-World Example
Imagine Stock XYZ at ₹1000:
Intraday Trader: Buys at ₹1000, sells at ₹1010 same day, booking 1% profit. May repeat 5–10 trades.
Swing Trader: Buys at ₹1000, holds for a week till ₹1150, booking 15% profit. Only 1 trade, but larger reward.
9. Pros & Cons
Pros of Intraday Trading
Quick returns.
Leverage available.
Daily learning experience.
No overnight risk.
Cons of Intraday Trading
Extremely stressful.
High brokerage costs.
Demands full-time attention.
High failure rate for beginners.
Pros of Swing Trading
Less screen time.
Larger profits per trade.
Flexibility to combine with job.
Trend-friendly.
Cons of Swing Trading
Overnight risk.
Requires patience.
Slow capital turnover.
Emotional swings if market gaps down.
10. Conclusion
Intraday and swing trading are two distinct paths to profit from markets. Neither is inherently better — it depends on one’s personality, risk appetite, and lifestyle.
If you thrive in fast-paced environments, can manage stress, and want quick daily profits, intraday trading is suitable.
If you prefer patience, less stress, and bigger swings, and don’t want to monitor markets constantly, swing trading is more fitting.
Ultimately, the best traders often experiment with both, learn their strengths, and settle into the style that complements their psychology. Success depends not just on the strategy, but on discipline, money management, and continuous learning.
Retail vs Institutional Trading1. Defining Retail and Institutional Trading
1.1 Retail Trading
Retail traders are individual investors who buy and sell financial instruments with their personal money. They typically trade via online brokerage accounts or traditional brokers, using platforms like Zerodha, Robinhood, Charles Schwab, Fidelity, or Interactive Brokers.
Characteristics of retail traders:
Small capital size (from a few hundred dollars to a few lakh/ thousands).
Shorter time horizons, often focusing on short-term gains or personal investment goals.
Use of simplified platforms and basic tools.
Limited access to insider research or advanced market data.
Highly influenced by news, social media, or trends.
1.2 Institutional Trading
Institutional traders are large organizations that trade on behalf of clients, funds, or corporations. Examples include mutual funds, hedge funds, pension funds, insurance companies, sovereign wealth funds, and investment banks.
Characteristics of institutional traders:
Massive capital base, often billions of dollars.
Longer time horizons, though hedge funds may also engage in short-term or high-frequency trading.
Access to advanced research, analytics, and algorithmic trading systems.
Ability to negotiate better fees, spreads, and execution rates.
Often influence market prices due to the sheer size of their trades.
2. Scale of Operations
The most obvious difference between retail and institutional trading is scale.
A retail trader may buy 50 shares of Apple or a few lots of Nifty futures.
An institutional trader might purchase millions of shares or manage portfolios worth tens of billions.
This scale difference creates unique dynamics:
Institutions cannot move in and out of positions easily without affecting prices.
Retail traders, due to their small size, enjoy agility and can enter/exit positions quickly.
3. Tools and Technology
3.1 Retail Traders
Retail traders typically rely on:
Trading apps (e.g., Zerodha Kite, Robinhood, TD Ameritrade).
Technical indicators like moving averages, RSI, MACD.
Basic charting platforms (TradingView, MetaTrader).
Limited access to real-time institutional data.
3.2 Institutional Traders
Institutional traders operate on another level with:
Algorithmic and High-Frequency Trading (HFT) systems.
Proprietary trading models, AI, and machine learning.
Direct market access (DMA) with ultra-low latency.
Bloomberg terminals and advanced risk management dashboards.
Teams of analysts and quants for research.
Thus, while retail trading is often manual and discretionary, institutional trading is increasingly automated and systematic.
4. Market Impact
4.1 Institutional Impact
When an institution places a trade worth hundreds of millions, it can move the market price significantly. For example, if BlackRock decides to buy a large stake in a company, the stock may rise due to sudden demand.
4.2 Retail Impact
Retail traders usually have minimal market-moving power individually. However, when retail traders act collectively—such as the GameStop short squeeze of 2021—they can move markets in dramatic ways.
5. Trading Strategies
5.1 Retail Trading Strategies
Swing trading: Holding for days/weeks.
Day trading: Multiple intraday trades.
Options trading: Buying calls/puts with limited risk.
Trend following: Using technical indicators.
News-based trading: Reacting to announcements.
Retail traders often focus on simplicity and quick gains.
5.2 Institutional Trading Strategies
Quantitative trading: Using complex mathematical models.
High-frequency trading (HFT): Thousands of trades in milliseconds.
Arbitrage: Exploiting price differences across markets.
Long-term value investing: Buying undervalued assets for decades.
Hedging: Managing risk for clients.
Institutions play a more diverse and sophisticated game, balancing risk with return.
6. Advantages and Disadvantages
6.1 Retail Traders – Advantages
Agility: Small size means quick exits.
Independence: Can take risks institutions cannot.
Accessibility: Online trading platforms allow low entry barriers.
Potential for outsized gains: A single bet can multiply wealth.
6.2 Retail Traders – Disadvantages
Lack of information edge.
Higher fees/spreads compared to institutions.
Emotional decision-making (fear & greed).
Susceptible to scams, herd mentality, or misinformation.
6.3 Institutional Traders – Advantages
Access to best research, tools, and liquidity.
Negotiated low transaction costs.
Economies of scale.
Ability to influence companies (activist investing).
6.4 Institutional Traders – Disadvantages
Too large to be nimble—cannot exit quickly.
Market scrutiny from regulators.
Pressure to perform consistently for clients.
Vulnerable to systemic risks (2008 crisis showed big funds collapsing).
7. Psychology of Trading
Retail traders often suffer from emotional biases: fear of missing out (FOMO), panic selling, or chasing hype stocks.
Institutional traders follow more disciplined, rule-based systems with committees and checks to reduce emotional influence.
However, even institutions are not immune to herding behavior—when many funds chase the same trend (dot-com bubble, crypto mania).
8. Regulatory Environment
Retail trading is regulated to protect small investors from fraud and unfair practices.
Institutional trading is regulated to prevent market manipulation, insider trading, and systemic risks.
Regulators such as SEBI (India), SEC (U.S.), FCA (UK) ensure fair play across both sides.
9. Retail vs Institutional in Emerging Markets
In markets like India, Brazil, and Southeast Asia, retail participation has exploded due to:
Mobile apps and digital brokers.
Increased financial literacy.
Rising disposable incomes.
At the same time, institutions (domestic mutual funds, FIIs) dominate long-term flows. The push-pull between retail excitement and institutional discipline often drives volatility.
10. Case Studies
10.1 GameStop Mania (2021)
Retail traders on Reddit’s WallStreetBets drove a short squeeze against hedge funds, showing retail’s collective power.
10.2 2008 Global Financial Crisis
Institutional excesses in mortgage-backed securities triggered a meltdown, proving that large-scale institutional risks can destabilize the entire global economy.
10.3 Indian Markets (2020–2022)
Post-COVID, Indian retail investors surged through platforms like Zerodha and Groww, increasing direct retail ownership of equities. However, FIIs (Foreign Institutional Investors) still dominate net flows.
Conclusion
Retail and institutional traders may seem to be playing the same game, but they operate with very different tools, capital, psychology, and strategies.
Retail trading is marked by agility, independence, and passion, but limited by scale and access.
Institutional trading is marked by power, research, and influence, but limited by bureaucracy and systemic exposure.
Both are crucial pillars of the financial markets. Retail provides liquidity, diversity, and vibrancy, while institutions provide stability, scale, and depth.
Ultimately, the relationship between retail and institutional traders is not adversarial but symbiotic—together, they make markets more efficient, liquid, and reflective of global economic realities.
Inflation Nightmare1. Introduction: Understanding Inflation
Inflation is one of the most powerful forces shaping economies, markets, and daily life. It refers to the general increase in prices of goods and services over time, reducing the purchasing power of money. While moderate inflation is normal in growing economies, an inflation nightmare occurs when prices spiral out of control, destabilizing societies and threatening livelihoods.
To visualize:
If a loaf of bread cost ₹50 last year but now costs ₹100, people feel the direct pinch.
If wages don’t rise as fast as prices, living standards fall.
If inflation expectations rise, people rush to buy today rather than tomorrow, fueling more inflation.
An inflation nightmare is not just about economics; it is also about psychology, politics, and survival.
2. Normal Inflation vs. Inflation Nightmare
Mild/healthy inflation (2–4% per year): Supports growth, encourages spending and investment.
High inflation (6–10% per year): Hurts savings, reduces confidence, and strains households.
Hyperinflation (50%+ per month): Total collapse of currency value, leading to social unrest and chaos.
An inflation nightmare lies in the last two categories—when price rises become unbearable and unpredictable.
3. Causes of Inflation Nightmare
(a) Demand-Pull Inflation
“Too much money chasing too few goods.” When demand surges faster than supply, prices rise. Example: booming economies after wars.
(b) Cost-Push Inflation
When production costs (wages, raw materials, oil, transport) rise, businesses pass costs to consumers. Example: Oil price shocks in the 1970s.
(c) Monetary Expansion
Excessive printing of money by central banks dilutes value. Example: Zimbabwe (2008), Venezuela (2010s).
(d) Supply Chain Disruptions
Pandemic lockdowns, trade wars, and shipping crises push prices higher. Example: Global supply crunch during COVID-19.
(e) Geopolitical Conflicts
Wars and sanctions disrupt trade flows, raising energy and food costs. Example: Russia-Ukraine war impacting wheat, oil, and gas prices globally.
(f) Inflation Expectations
If people believe inflation will rise, they demand higher wages, buy goods early, and businesses raise prices preemptively—creating a self-fulfilling spiral.
4. The Anatomy of an Inflation Nightmare
An inflation nightmare often unfolds in three stages:
Warning Signs – Rising food, rent, and fuel prices, currency weakening, fiscal deficits.
Acceleration Phase – Prices rise monthly, people lose trust in currency, hoarding begins.
Crisis & Collapse – Hyperinflation, barter trade, dollarization, social unrest, political change.
5. Global Case Studies of Inflation Nightmares
(a) Weimar Germany (1920s)
Reparations after WWI and money printing caused hyperinflation.
At peak, prices doubled every 3 days.
Workers were paid twice daily, rushing to buy bread before prices rose.
(b) Zimbabwe (2008)
Government printed excessive money.
Inflation reached 79.6 billion % in one month.
100 trillion Zimbabwean dollar notes became worthless.
(c) Venezuela (2013–2019)
Oil crash + political instability.
Inflation crossed 1,000,000%.
Shortages of medicine, food, and essentials.
(d) Turkey (2021–2023)
Currency crisis and unorthodox monetary policy.
Inflation surged above 80%.
People shifted savings to dollars and gold.
(e) Argentina (Recurring crises)
Chronic fiscal deficits and weak currency.
Inflation near 100% in 2022–2023.
Savings eroded, economy dollarized unofficially.
These examples show how inflation nightmares devastate middle-class savings, destroy business confidence, and topple governments.
6. Impact of Inflation Nightmare
(a) On Households
Shrinking purchasing power.
Rising food, rent, and utility costs.
Erosion of savings and pensions.
Decline in living standards.
(b) On Businesses
Rising input costs.
Uncertainty in planning and investment.
Pressure to increase prices, risking demand collapse.
(c) On Investors
Bonds and fixed deposits lose value.
Stock markets volatile.
Safe havens like gold and real estate gain.
(d) On Governments
Pressure to increase subsidies and social spending.
Difficulty in borrowing as bond yields rise.
Risk of political instability and protests.
(e) On Global Trade
Exchange rate volatility.
Higher import bills for energy and food.
Capital flight to stable economies.
7. Why Inflation Nightmares are Dangerous
Uncertainty: People don’t know future prices, making planning impossible.
Wealth Destruction: Savings, pensions, and salaries evaporate in real terms.
Inequality: Rich hedge via assets, poor suffer most.
Loss of Trust: Citizens lose faith in government and currency.
Social Chaos: Strikes, protests, and riots often follow.
8. Inflation Nightmare in the 2020s Context
COVID-19 pandemic: Stimulus packages + supply bottlenecks fueled inflation.
Russia-Ukraine War: Spikes in oil, gas, and food prices globally.
Climate Change: Crop failures push food inflation higher.
De-dollarization debates: Weakening confidence in traditional reserve currencies.
Countries like Sri Lanka (2022) faced an inflation nightmare with shortages of fuel, medicine, and food—leading to political collapse.
9. Coping Mechanisms during an Inflation Nightmare
(a) Individual Level
Shift savings to inflation-protected assets (gold, real estate, equities).
Cut discretionary spending.
Focus on skills that secure wage growth.
(b) Business Level
Hedge raw material costs.
Diversify suppliers.
Innovate with technology to reduce costs.
(c) Government Level
Tight monetary policy (raise interest rates).
Fiscal discipline (reduce deficit spending).
Strengthen currency reserves.
Subsidies for essentials to protect poor households.
10. Lessons from History
Prevention is better than cure: Once hyperinflation starts, it is hard to stop.
Trust is key: Currency depends on people’s confidence.
Independent central banks are vital for credibility.
Diversification of economy prevents over-dependence (like Venezuela on oil).
Conclusion
An inflation nightmare is more than rising prices—it is the collapse of trust in money itself. History shows how devastating it can be, destroying middle-class security, collapsing businesses, and reshaping politics.
While moderate inflation is a sign of growth, uncontrolled inflation can become a nightmare—haunting economies for decades. The key lies in responsible policies, diversified economies, and resilient households.
Just like nightmares disturb our sleep, inflation nightmares disturb the dream of economic stability.
Divergence SecretsIntroduction to Options Trading (Educational Foundation)
Options are one of the most important financial instruments available in modern markets. For a beginner, understanding them may feel overwhelming at first, but with the right approach, they can become a powerful tool for investment, speculation, and risk management.
An option is a financial contract that gives its holder the right (but not the obligation) to buy or sell an asset, such as a stock, at a predetermined price, within a fixed time frame.
There are two major types of options:
Call Option – Provides the right to buy the underlying asset at a fixed price (called the strike price).
Put Option – Provides the right to sell the underlying asset at a fixed price.
For example:
Imagine you believe Infosys stock, currently at ₹1600, will rise soon. Instead of buying the stock directly, you can buy a call option with strike ₹1650. If Infosys rises to ₹1700, your option increases in value, and you earn profit without investing the full cost of shares.
This flexibility is what makes options attractive—but also dangerous if used without proper strategies.
Why Beginners Need Strategies Instead of Random Trades
Options can generate huge profits, but they can also cause significant losses. Many beginners are tempted to “buy cheap options” hoping for quick riches. Unfortunately, statistics show that most lose money in the long run.
The reasons are:
Options lose value with time decay (Theta).
Market moves are unpredictable; random bets rarely succeed.
Beginners underestimate risk exposure.
That’s why structured strategies are necessary. A strategy gives:
Clarity – A defined plan for entry and exit.
Risk management – Limited losses instead of unlimited risk.
Flexibility – Ability to profit in different market conditions (bullish, bearish, sideways, or volatile).
In education terms: A strategy is like a map. Just as students need a study plan to pass exams, traders need strategies to succeed in markets.

Part 2 Support and ResistenceRisk Management in Options for Beginners
Options are risky if not handled well. Here’s how beginners can manage risks:
Never trade with all capital – Use only 10-20% of portfolio in options.
Set stop-loss – Don’t let losses grow.
Choose liquid contracts – Always trade in Nifty, Bank Nifty, or large-cap stocks with high liquidity.
Understand time decay (Theta) – Options lose value as expiry approaches.
Avoid shorting naked options – Unlimited risk for beginners.
Common Mistakes Beginners Make
Buying out-of-the-money options hoping for jackpot.
Ignoring Greeks (Delta, Theta, Vega).
Overtrading with small capital.
Trading without a strategy.
Not exiting on time.
Tips for Beginners to Succeed
Start with paper trading before real money.
Focus on 1-2 simple strategies (covered call, spreads).
Learn technical + fundamental analysis.
Be disciplined—don’t chase quick money.
Track and review trades weekly.

Part 1 Support and ResistenceLong Straddle (High Volatility Bet)
Best for: Beginners who expect big move but don’t know direction.
Market Outlook: High volatility (e.g., before results, elections).
How it works:
Buy a call and a put at same strike price.
Example:
Nifty at 22,000.
Buy 22,000 call at ₹150.
Buy 22,000 put at ₹160.
Total cost = ₹310.
If Nifty moves strongly (up or down), one option gives profit. If Nifty stays flat, you lose premium.
✅ Pros: Profit in any direction.
❌ Cons: Expensive, loses money in sideways market.
Long Strangle (Cheaper Volatility Bet)
Similar to straddle but uses different strike prices.
Example: Buy 21,800 put + 22,200 call.
Cheaper than straddle but requires bigger move for profit.
Iron Condor (Sideways Market Strategy)
Best for: Beginners who think market will stay in range.
Market Outlook: Neutral.
How it works:
Sell an out-of-the-money call.
Buy a further out-of-the-money call.
Sell an out-of-the-money put.
Buy a further out-of-the-money put.
This creates a “range” where you earn profit.
✅ Pros: Works best in stable market.
❌ Cons: Complicated, limited profit.

Part 2 Master Candlestick PatternIntroduction to Options Trading (Basics)
Options trading is one of the most exciting areas in the stock market. Unlike buying and selling shares directly, options allow traders to control a stock without owning it fully. This gives leverage (more exposure with less money), but it also carries risks.
An option is a contract that gives you the right (but not the obligation) to buy or sell a stock at a certain price before a certain date.
Call Option: Right to buy at a fixed price (strike price).
Put Option: Right to sell at a fixed price.
For example:
Suppose Reliance stock is ₹2500. You buy a call option with strike price ₹2600 (expiry in one month). If Reliance goes up to ₹2800, your option value rises, and you make profit without investing huge capital.
Options can be used in different ways:
To speculate (bet on direction)
To hedge (protect investments)
To earn income (through writing options)
But for beginners, blindly speculating with options is risky. That’s why strategies are important—they give a structured approach to trading instead of gambling.
Why Beginners Need Strategies Instead of Random Trades
Most new traders jump into options because they see “quick profits.” However, around 80-90% of beginners lose money in options. The main reason is lack of planning.
Here’s why strategies matter:
Risk Control: Options have unlimited loss potential if traded recklessly. Strategies limit risk.
Consistent Approach: Instead of random bets, strategies follow defined rules.
Flexibility: Strategies allow traders to profit in different market conditions (up, down, sideways).
Capital Efficiency: Beginners usually have limited funds; strategies help them maximize capital use.
Example:
Instead of buying a random call option (which can expire worthless), a beginner can use a bull call spread, reducing risk while still having profit potential.

Technical Analysis and Fundamental AnalysisIntroduction
In the world of financial markets—whether equities, commodities, currencies, or bonds—two primary schools of thought dominate the decision-making process of traders and investors: technical analysis (TA) and fundamental analysis (FA). Both are distinct in methodology and philosophy, yet they share a common goal: to forecast future price movements and identify profitable opportunities.
Technical analysis focuses on price action, charts, patterns, and market psychology, whereas fundamental analysis centers on intrinsic value, economic indicators, company performance, and long-term outlooks. Traders and investors often debate which approach is superior, but in practice, many combine elements of both to create a more holistic strategy.
This essay provides an in-depth exploration of technical and fundamental analysis, covering their history, principles, tools, strengths, weaknesses, and practical applications.
Part 1: Technical Analysis
1.1 What is Technical Analysis?
Technical analysis is the study of historical price data and volume to forecast future market movements. Unlike fundamental analysis, it does not concern itself with “why” the price moves, but rather “how” it moves. The basic premise is that market action discounts everything, meaning all known information—economic, political, psychological—is already reflected in the price.
Traders using technical analysis believe that patterns repeat over time due to human behavior and market psychology. By analyzing charts, they aim to identify trends and capitalize on them.
1.2 History of Technical Analysis
The roots of TA trace back to Charles Dow, co-founder of the Wall Street Journal and the Dow Jones Industrial Average. His writings in the late 19th century evolved into what we now know as Dow Theory.
Japanese rice traders developed candlestick charting in the 1700s, which still plays a major role in modern trading.
Over time, charting techniques evolved into a sophisticated discipline supported by algorithms and computers.
1.3 Core Principles of Technical Analysis
Market Discounts Everything
All available information is already reflected in the price.
Price Moves in Trends
Markets follow trends—uptrend, downtrend, or sideways—and these trends are more likely to continue than reverse.
History Repeats Itself
Patterns of market behavior tend to repeat because human psychology does not change.
1.4 Tools of Technical Analysis
(a) Charts
Line Charts – simple, connect closing prices.
Bar Charts – show open, high, low, close (OHLC).
Candlestick Charts – visually appealing, show the same OHLC but easier to interpret.
(b) Price Patterns
Continuation Patterns: Flags, Pennants, Triangles.
Reversal Patterns: Head and Shoulders, Double Top/Bottom, Cup and Handle.
(c) Indicators and Oscillators
Trend Indicators: Moving Averages (SMA, EMA), MACD.
Momentum Oscillators: RSI, Stochastic Oscillator.
Volatility Indicators: Bollinger Bands, ATR.
Volume Indicators: On-Balance Volume (OBV), Volume Profile.
(d) Support and Resistance
Support: a level where demand outweighs supply, preventing further decline.
Resistance: a level where supply outweighs demand, preventing further rise.
(e) Advanced Tools
Fibonacci Retracement and Extensions.
Elliott Wave Theory.
Ichimoku Cloud.
Volume Profile Analysis.
1.5 Advantages of Technical Analysis
Provides clear entry and exit signals.
Works well for short-term and medium-term trading.
Easy to visualize with charts.
Reflects collective psychology and herd behavior.
1.6 Limitations of Technical Analysis
Subjective interpretation: two analysts may read the same chart differently.
Works best in trending markets, less effective in choppy markets.
False signals can lead to losses.
Relies on past data, which may not always predict future movements.
Part 2: Fundamental Analysis
2.1 What is Fundamental Analysis?
Fundamental analysis evaluates a security’s intrinsic value by examining economic, financial, and qualitative factors. It seeks to answer: Is this stock (or asset) undervalued or overvalued compared to its true worth?
Investors use FA to make long-term decisions, focusing on earnings, growth potential, competitive advantages, management quality, and macroeconomic conditions.
2.2 Core Principles of Fundamental Analysis
Intrinsic Value vs. Market Price
If the intrinsic value is greater than market price → Buy (undervalued).
If the intrinsic value is less than market price → Sell (overvalued).
Economic and Business Cycles Matter
Markets are influenced by GDP growth, inflation, interest rates, and other macroeconomic variables.
Long-Term Focus
Fundamental analysis is best suited for long-term investors, not short-term traders.
2.3 Types of Fundamental Analysis
(a) Top-Down Approach
Starts with the global economy, then narrows to sectors, and finally selects individual companies.
(b) Bottom-Up Approach
Focuses on company-specific factors first, regardless of broader economy or sector.
2.4 Tools of Fundamental Analysis
(a) Economic Indicators
GDP growth, unemployment rates, inflation, interest rates, currency fluctuations.
(b) Industry and Sector Analysis
Porter’s Five Forces model.
Sector growth potential.
(c) Company Analysis
Quantitative Factors (Financial Statements)
Income Statement (revenue, profit, margins).
Balance Sheet (assets, liabilities, equity).
Cash Flow Statement.
Financial Ratios: P/E, P/B, ROE, ROA, Debt-to-Equity, etc.
Qualitative Factors
Management quality.
Competitive advantage (moat).
Brand value, innovation, customer loyalty.
(d) Valuation Models
Discounted Cash Flow (DCF).
Dividend Discount Model.
Price-to-Earnings and other multiples.
2.5 Advantages of Fundamental Analysis
Provides deep insights into intrinsic value.
Helps long-term investors make informed decisions.
Identifies undervalued and overvalued opportunities.
Considers broader economic and company-specific realities.
2.6 Limitations of Fundamental Analysis
Time-consuming and requires access to reliable data.
Assumptions in valuation models can be subjective.
Does not provide short-term entry/exit signals.
Markets can remain irrational longer than expected.
Part 3: Technical vs. Fundamental Analysis
Feature Technical Analysis Fundamental Analysis
Focus Price action, charts, patterns Intrinsic value, financial health
Time Horizon Short-term to medium-term Long-term
Tools Used Indicators, oscillators, chart patterns Financial statements, ratios, DCF
Philosophy “Price discounts everything” “Price may diverge from true value”
Strengths Timing trades, market psychology Identifying strong companies/assets
Weaknesses Subjective, false signals Time-consuming, subjective assumptions
Part 4: Practical Applications
4.1 Traders Using Technical Analysis
Day traders, scalpers, and swing traders rely heavily on technicals.
Example: A trader identifies bullish divergence in RSI and enters a long position.
4.2 Investors Using Fundamental Analysis
Long-term investors like Warren Buffett use FA to buy undervalued companies.
Example: Buying a company with consistent free cash flow, strong moat, and low debt.
4.3 Combining Both Approaches (Techno-Fundamental)
Many professionals combine both methods:
Use fundamental analysis to select strong companies.
Use technical analysis to time entry and exit points.
Part 5: Case Studies
Case Study 1: Reliance Industries (India)
FA View: Strong business diversification, consistent earnings growth, high market share in telecom and retail.
TA View: Technical breakout from a consolidation zone often triggers big moves.
Outcome: FA supports long-term investment, TA helps with timing.
Case Study 2: Tesla (US)
FA View: High valuation multiples, but strong growth prospects in EV industry.
TA View: Volatile price patterns with frequent trend reversals.
Outcome: Investors may hold long-term based on fundamentals but traders rely on charts to manage risk.
Part 6: Criticism and Debate
Critics of TA argue that past price cannot reliably predict future performance.
Critics of FA argue that intrinsic value is subjective, and markets often misprice assets for extended periods.
In reality, both methods reflect different perspectives: TA focuses on “when” to trade, FA focuses on “what” to trade.
Conclusion
Technical analysis and fundamental analysis are two complementary pillars of market research. While TA is driven by patterns, psychology, and momentum, FA is grounded in data, earnings, and long-term value.
For traders, technical analysis is often the weapon of choice due to its short-term applicability. For investors, fundamental analysis provides the framework for wealth creation over time. However, the most successful market participants often blend the two—using fundamentals to identify what to buy and technicals to determine when to buy or sell.
In the ever-evolving financial markets, neither approach guarantees success. Markets are influenced by countless variables—economic, geopolitical, and psychological. But by understanding both technical and fundamental analysis deeply, one can develop a balanced perspective and navigate uncertainty with greater confidence.
Quantitative Trading1. Introduction to Quantitative Trading
Quantitative trading, often called “quant trading”, refers to the use of mathematical models, statistical techniques, and computer algorithms to identify and execute trading opportunities in financial markets. Unlike traditional trading, where decisions may rely heavily on human intuition or fundamental analysis (such as studying company balance sheets or industry trends), quant trading uses data-driven models to make objective, systematic, and automated decisions.
At its core, quantitative trading answers a simple question:
Can we use numbers, patterns, and algorithms to predict price movements and make profitable trades?
Over the past few decades, quant trading has transformed financial markets. Large hedge funds, investment banks, and proprietary trading firms heavily rely on it to generate profits. In fact, some of the world’s most successful funds—such as Renaissance Technologies’ Medallion Fund—are almost entirely quant-driven.
2. The Evolution of Quantitative Trading
2.1 Early Beginnings
Quant trading is not entirely new. Even in the 1970s and 1980s, traders began using computers to run backtests and automate parts of their strategies. The Black-Scholes model (1973), which priced options mathematically, is often considered the birth of modern quant finance.
2.2 Rise of Computers and Data
In the 1990s, as computing power grew and financial markets digitized, quant trading became more widespread. Firms started processing huge amounts of tick-by-tick data to uncover hidden patterns.
2.3 High-Frequency Trading (HFT)
By the 2000s, high-frequency trading exploded. These strategies used ultra-fast algorithms to execute thousands of trades per second, capitalizing on micro-price movements.
2.4 Today’s Era
Now, quant trading has matured into multiple branches—statistical arbitrage, algorithmic execution, machine learning-driven strategies, and hybrid approaches. Artificial Intelligence (AI) and Big Data have added new layers, allowing traders to incorporate alternative data (like social media sentiment, satellite images, or shipping data) into their models.
3. Core Principles of Quantitative Trading
To understand quant trading, we need to break down its building blocks:
3.1 Data
The lifeblood of quant trading is data. Types of data include:
Market Data: Prices, volumes, bid-ask spreads, order books.
Fundamental Data: Earnings reports, balance sheets, macroeconomic indicators.
Alternative Data: Social media sentiment, credit card spending, satellite images, Google search trends.
3.2 Hypothesis and Strategy
Every quant strategy starts with a hypothesis. For example:
Stocks that fall sharply in one day tend to bounce back the next day (mean reversion).
Momentum stocks (those rising consistently) may keep rising for some time.
Statistical relationships exist between two correlated assets, like crude oil and airline stocks.
3.3 Mathematical Models
These hypotheses are turned into models using:
Statistics: Regression analysis, correlation, co-integration.
Probability: Predicting the likelihood of price changes.
Optimization: Determining the best allocation of capital across trades.
Machine Learning: Using algorithms like random forests, neural networks, or reinforcement learning to identify patterns.
3.4 Backtesting
Before risking real money, strategies are tested on historical data. The process checks:
Did the strategy work in the past?
Was it profitable after accounting for transaction costs?
How risky was it? (volatility, drawdowns, maximum loss)
3.5 Execution
Execution is the process of turning a signal into an actual trade. Execution itself can be algorithmic—using smart order routing, VWAP (Volume-Weighted Average Price) algorithms, or iceberg orders (which hide large trades).
3.6 Risk Management
Risk control is central to quant trading. Strategies are designed with limits:
Position Sizing: How much capital to allocate per trade.
Stop-Loss: Automatically cutting losses when prices move against you.
Diversification: Spreading across multiple assets, sectors, or markets.
4. Types of Quantitative Trading Strategies
Quant trading covers a wide spectrum of strategies:
4.1 Statistical Arbitrage
Exploiting price inefficiencies between related securities. Example:
If two historically correlated stocks diverge in price, a quant may short the overperformer and buy the underperformer, expecting reversion.
4.2 Trend Following
Strategies that bet on continuation of price momentum. Example:
Buy when the 50-day moving average crosses above the 200-day moving average.
4.3 Mean Reversion
Based on the belief that prices revert to their average. Example:
If a stock deviates 2 standard deviations from its mean, short it (if above) or buy it (if below).
4.4 High-Frequency Trading (HFT)
Ultra-fast algorithms that trade in microseconds. Types include:
Market Making: Posting continuous buy and sell quotes to profit from bid-ask spreads.
Latency Arbitrage: Exploiting delays in data transmission.
Event-Driven Trading: Reacting instantly to news releases or earnings announcements.
4.5 Machine Learning & AI-Driven
Using algorithms like neural networks or reinforcement learning to detect complex, non-linear relationships in data. Example:
Predicting intraday stock price direction using Twitter sentiment and order book dynamics.
4.6 Quant Macro
Models that trade currencies, bonds, and commodities based on global economic indicators like interest rates, inflation, or GDP growth.
4.7 Options & Derivatives Trading
Quant strategies often involve options due to their complexity. For instance:
Volatility Arbitrage: Exploiting differences between implied and realized volatility.
5. Tools and Technologies in Quant Trading
Quantitative trading is powered by technology. Some common tools include:
Programming Languages: Python, R, C++, Java, MATLAB.
Data Platforms: Bloomberg, Refinitiv, Quandl, Tick Data providers.
Trading Platforms: Interactive Brokers, MetaTrader, FIX protocol systems.
Libraries & Frameworks:
Python: Pandas, NumPy, Scikit-learn, PyTorch, TensorFlow.
R: Quantmod, xts, caret.
Databases: SQL, MongoDB, time-series databases.
Execution Infrastructure: Low-latency connections, co-located servers near exchanges.
6. Advantages of Quantitative Trading
Objectivity: Decisions are based on models, not emotions.
Speed: Algorithms execute trades far faster than humans.
Scalability: One model can trade across hundreds of securities simultaneously.
Backtesting: Strategies can be validated before deployment.
Diversification: Easier to spread across multiple asset classes.
7. Challenges and Risks of Quantitative Trading
Overfitting: A model may look great on past data but fail in real markets.
Market Changes: Patterns may stop working as markets evolve.
Data Quality Issues: Inaccurate or incomplete data leads to wrong signals.
High Competition: Many firms run similar models, reducing profitability.
Execution Costs: Transaction costs, slippage, and latency can eat profits.
Black-Box Risk: Complex models (especially AI) may make trades that are hard to interpret.
8. Risk Management in Quantitative Trading
Risk management is non-negotiable. Techniques include:
Value at Risk (VaR): Measuring the maximum expected loss at a given confidence level.
Stress Testing: Simulating extreme market conditions.
Stop-Losses and Circuit Breakers: Automatic exit rules to prevent catastrophic losses.
Capital Allocation Rules: Ensuring no single trade wipes out the portfolio.
9. Real-World Examples
9.1 Renaissance Technologies
Perhaps the most famous quant firm. Its Medallion Fund reportedly generates over 30–40% annual returns, net of fees, by using secretive statistical models.
9.2 Two Sigma
Another large quant fund that integrates AI, big data, and distributed computing to identify global trading opportunities.
9.3 Citadel Securities
A market-making giant using advanced quantitative models for execution and liquidity provision.
10. Ethical and Regulatory Aspects
Quant trading has sparked debates:
Fairness: Is HFT giving large firms an unfair edge?
Market Stability: Algorithms may trigger flash crashes (e.g., May 2010 Flash Crash).
Transparency: Regulators worry about opaque AI-driven “black-box” strategies.
Regulations: Different countries regulate algorithmic trading differently (e.g., SEBI in India, SEC in the U.S.).
Conclusion
Quantitative trading represents the intersection of finance, mathematics, statistics, and computer science. It replaces gut-feeling decisions with systematic, data-driven approaches, creating a more efficient and liquid marketplace.
However, quant trading is not risk-free. Over-reliance on models, data biases, or sudden market regime shifts can lead to large losses. Successful quant traders balance mathematical rigor with risk management, adaptability, and technological innovation.
As markets evolve, quantitative trading will continue to expand—shaped by AI, machine learning, alternative data, and possibly even quantum computing. The future belongs to those who can combine creativity with computation, turning raw numbers into actionable strategies.
FII and DII: The Backbone of Indian Capital Markets1. Introduction
The Indian stock market is one of the most dynamic and closely watched financial markets in the world. Every day, billions of rupees are traded, with share prices moving up and down in response to domestic and international events. Behind these movements lie the activities of two important groups of investors: Foreign Institutional Investors (FII) and Domestic Institutional Investors (DII).
While retail investors, high-net-worth individuals (HNIs), and proprietary traders also play an important role, FIIs and DIIs often act as the market movers. Their investment decisions not only influence short-term market trends but also shape the long-term growth of the financial ecosystem.
In this write-up, we will cover the concepts of FII and DII, their differences, importance, regulatory framework, market impact, historical trends, pros and cons, and their role in shaping India’s economic future.
2. Understanding FII (Foreign Institutional Investors)
2.1 Definition
Foreign Institutional Investors (FIIs) are investment institutions or entities registered outside India that invest in Indian financial markets. These include:
Pension funds
Hedge funds
Sovereign wealth funds
Insurance companies
Mutual funds
Investment banks
FIIs enter Indian markets with the objective of generating returns, benefiting from India’s growth story, and diversifying their global portfolio.
2.2 Role in the Market
They bring foreign capital into the country.
Improve liquidity by trading in large volumes.
Provide global perspective in terms of valuation and growth potential.
Help Indian markets integrate with the global financial system.
2.3 Types of FIIs
Foreign Portfolio Investors (FPIs): Invest mainly in stocks, bonds, and derivatives without having controlling stakes.
Foreign Direct Investors (FDI entities): Unlike FPIs, they invest for ownership and long-term control (factories, joint ventures, etc.).
Sovereign Wealth Funds (SWFs): Government-owned investment vehicles.
Hedge Funds & Private Equity Funds: High-risk, high-return players.
3. Understanding DII (Domestic Institutional Investors)
3.1 Definition
Domestic Institutional Investors (DIIs) are investment institutions incorporated within India that invest in Indian markets. Examples include:
Indian mutual funds
Insurance companies (LIC, ICICI Prudential, HDFC Life, etc.)
Banks
Pension funds (EPFO, NPS)
Indian financial institutions
3.2 Role in the Market
Provide stability to the market during volatile phases.
Act as a counterbalance to FIIs.
Channelize domestic savings into productive assets.
Support government disinvestment programs (for example, DIIs buying stakes in PSUs).
3.3 Sources of Funds for DIIs
Household savings through SIPs and insurance premiums.
Contributions to provident funds and pension schemes.
Long-term institutional reserves.
4. Difference Between FII and DII
Aspect FII (Foreign Institutional Investors) DII (Domestic Institutional Investors)
Origin Outside India Within India
Nature of Capital Foreign inflows Domestic savings
Impact Short-term market movers, high volatility Provide long-term stability
Currency Risk Subject to forex fluctuations No currency risk
Motivation Purely profit-driven Mix of profit motive & national economic interest
Regulation SEBI + RBI + FEMA regulations SEBI + Indian financial regulators
Market Behavior Highly sensitive to global cues (US Fed policy, crude oil prices, dollar index, etc.) More sensitive to domestic economy (inflation, fiscal policies, RBI policy, etc.)
5. Regulatory Framework
5.1 Regulation of FIIs
Securities and Exchange Board of India (SEBI): Registration and compliance.
Reserve Bank of India (RBI): Foreign exchange rules under FEMA.
Limits on investment: Sectoral caps (e.g., banks, defense, telecom).
5.2 Regulation of DIIs
SEBI: Oversees mutual funds, insurance companies, and pension funds.
IRDAI: Regulates insurance companies.
PFRDA: Governs pension funds.
RBI: Regulates banking institutions.
6. Importance of FIIs in India
Liquidity Provider: FIIs inject huge volumes of foreign capital.
Valuation Benchmarking: Their global comparison of valuation metrics helps align Indian markets with international standards.
Rupee Strength: FII inflows support India’s forex reserves and currency.
Economic Growth: Funds raised by companies through markets are fueled by FIIs.
However, FIIs can also exit quickly, causing sharp falls.
7. Importance of DIIs in India
Counterbalance to FIIs: When FIIs sell, DIIs often buy, preventing market crashes.
Utilization of Household Savings: Converts Indian savings into stock market capital.
Long-term Focus: Unlike FIIs, DIIs are not quick to exit.
Support in Government Policies: DIIs participate in PSU disinvestment.
8. Historical Trends: FII vs DII in Indian Markets
2003–2008: FIIs were dominant, driving the bull run before the global financial crisis.
2008–09 Crisis: FIIs pulled out massively, leading to a crash. DIIs helped stabilize.
2013: "Taper tantrum" – FIIs exited due to US Fed tightening.
2016 Demonetization & GST era: FIIs cautious, DIIs (via mutual fund SIP boom) became strong.
2020 COVID Crash: FIIs sold aggressively, but DIIs bought the dip.
2021–22 Bull Run: Both FIIs and DIIs invested heavily.
2022 Russia-Ukraine War & US Fed hikes: FIIs sold; DIIs supported the market.
9. Market Impact of FIIs and DIIs
Short-term trends: Often dictated by FII activity.
Long-term growth: Driven by DII investments.
Volatility: Sharp swings occur when FII flows are large.
Index levels: FIIs have a heavy influence on NIFTY, Sensex due to large-cap focus.
10. Pros and Cons of FII and DII
Pros of FIIs
Bring foreign capital.
Enhance market efficiency.
Create global visibility for Indian companies.
Cons of FIIs
Can cause volatility.
Sensitive to global events.
Currency depreciation risks.
Pros of DIIs
Provide stability.
Channelize domestic wealth.
Long-term focus.
Cons of DIIs
Limited fund pool compared to FIIs.
Sometimes influenced by government policies.
Conclusion
The interplay between Foreign Institutional Investors (FIIs) and Domestic Institutional Investors (DIIs) is the heartbeat of India’s capital markets. While FIIs provide the oxygen of foreign capital and liquidity, DIIs act as the backbone of resilience and stability. Together, they create a balanced ecosystem where volatility is managed, growth is fueled, and investor confidence is nurtured.
For retail investors, closely tracking FII and DII activity can provide deep insights into market direction. For policymakers, balancing both sources of funds ensures that India’s financial markets remain globally competitive yet domestically stable.
In the future, as India’s economy grows and becomes more integrated with the global financial system, the partnership of FIIs and DIIs will play a decisive role in shaping India’s financial destiny.

Part 10 Trading Masterclass With ExpertsTypes of Options
There are two fundamental types of options:
(a) Call Option
A call option gives the buyer the right to buy the underlying asset at a fixed strike price before or on expiration.
Buyers of calls expect the price to rise.
Sellers of calls expect the price to stay flat or fall.
Example:
Suppose you buy a call option on TCS with a strike price of ₹3,500, expiring in one month. If TCS rises to ₹3,800, you can exercise the option and buy at ₹3,500, making a profit. If TCS stays below ₹3,500, you lose only the premium.
(b) Put Option
A put option gives the buyer the right to sell the underlying asset at the strike price before or on expiration.
Buyers of puts expect the price to fall.
Sellers of puts expect the price to rise or stay stable.
Example:
You buy a put option on Infosys with a strike of ₹1,500. If Infosys drops to ₹1,200, you can sell at ₹1,500 and earn profit. If Infosys stays above ₹1,500, you lose only the premium.
The Four Basic Positions
Every option trade can be boiled down to four core positions:
Long Call – Buying a call (bullish).
Short Call – Selling a call (bearish/neutral).
Long Put – Buying a put (bearish).
Short Put – Selling a put (bullish/neutral).
All advanced strategies are combinations of these four.

Part 7 Trading Masterclass With ExpertsOptions Greeks and Their Role
Every strategy depends heavily on the Greeks:
Delta: Sensitivity to price changes.
Gamma: Rate of change of delta.
Theta: Time decay of option value.
Vega: Sensitivity to volatility.
Rho: Sensitivity to interest rate changes.
Traders use Greeks to fine-tune strategies and manage risk exposure.
Risk Management in Options
Risk control is crucial. Key principles:
Never risk more than you can afford to lose.
Use spreads instead of naked options.
Monitor Greeks daily.
Diversify across strikes and expiries.
Set stop-loss and exit plans.

Part 6 Institutional Trading Advanced & Professional Strategies
(a) Butterfly Spread
Combination of 3 strike prices (buy 1 low strike call, sell 2 middle strike calls, buy 1 high strike call).
Profits from minimal price movement.
(b) Calendar Spread
Sell near-term option and buy long-term option at the same strike.
Profits from time decay difference.
(c) Ratio Spread
Buy 1 option, sell 2 options at different strikes.
Increases reward potential but adds risk.
(d) Box Spread
Arbitrage-like strategy combining bull and bear spreads.
Used by professionals for risk-free returns (if pricing inefficiency exists).

Part 3 Institutional Trading Popular Basic Strategies
(a) Covered Call
Buy the underlying stock and sell a call option.
Used to earn extra income if you already own shares.
Risk: Stock price falls.
Reward: Premium + limited upside.
(b) Protective Put
Buy stock and simultaneously buy a put option.
Acts like insurance — protects against downside risk.
Example: If you own TCS stock at ₹3500, buy a 3400 put.
Risk: Premium paid.
Reward: Unlimited upside with limited downside.
(c) Long Call
Buy a call option expecting the price to rise.
Limited risk (premium paid), unlimited reward.
Example: Buy Nifty 20,000 CE at 100 premium.
(d) Long Put
Buy a put option expecting a fall in price.
Limited risk (premium), large profit potential in downturns.
