Introduction to Option Greeks and Hedging1. Understanding the Concept of Option Greeks
Option Greeks are mathematical measures derived from the Black-Scholes model and other pricing models. Each Greek represents a different dimension of risk associated with holding an option position. Collectively, they help traders understand how their portfolio will behave when market variables change. The main Greeks are Delta, Gamma, Theta, Vega, and Rho.
These metrics provide traders with a structured approach to assess risk exposure. By interpreting these values, traders can anticipate potential losses or gains when market conditions shift, allowing them to make timely adjustments through hedging.
2. Delta (Δ): Sensitivity to Price Movement
Delta measures how much the price of an option changes in response to a ₹1 (or $1) change in the price of the underlying asset.
For call options, Delta ranges between 0 and +1.
For put options, Delta ranges between 0 and –1.
For example, if a call option has a Delta of 0.6, it means that for every ₹1 increase in the stock price, the option’s price will increase by ₹0.60.
Interpretation:
A Delta close to 1 (or –1) indicates the option behaves almost like the underlying asset.
A Delta near 0 means the option is far out-of-the-money and less responsive to price changes.
Use in Hedging:
Traders use Delta to create Delta-neutral portfolios. This means the portfolio’s overall Delta equals zero, making it immune to small price movements in the underlying asset. For instance, if a trader holds call options with a total Delta of +100, they can short 100 shares of the underlying asset to neutralize price risk.
3. Gamma (Γ): Rate of Change of Delta
While Delta measures how much an option’s price changes with the underlying, Gamma measures how much Delta itself changes with a ₹1 move in the underlying.
Gamma is highest for at-the-money options and lowest for deep in-the-money or out-of-the-money options.
Interpretation:
A high Gamma means the Delta changes rapidly, leading to higher price sensitivity.
A low Gamma means Delta changes slowly, making the position more stable.
Use in Hedging:
Gamma helps traders understand how stable their Delta hedge is. For instance, if you are Delta-neutral but have high Gamma exposure, even a small move in the stock price can make your portfolio Delta-positive or Delta-negative quickly. Active traders monitor Gamma to rebalance their hedges dynamically.
4. Theta (Θ): Time Decay
Theta represents the rate at which the value of an option declines as time passes, assuming other factors remain constant.
Options are wasting assets, meaning their value decreases as expiration approaches. Theta is usually negative for option buyers and positive for option sellers.
For example, if an option has a Theta of –0.05, it will lose ₹0.05 per day due to time decay.
Interpretation:
Short-term, out-of-the-money options have faster time decay.
Long-term options lose value slowly.
Use in Hedging:
Option sellers (like covered call writers) use Theta to their advantage, as they profit from the natural erosion of time value. On the other hand, buyers may hedge against Theta decay by selecting longer-dated options or adjusting their positions as expiration nears.
5. Vega (ν): Sensitivity to Volatility
Vega measures how much an option’s price changes for a 1% change in implied volatility (IV).
Volatility reflects the market’s expectation of how much the underlying asset will fluctuate. An increase in volatility generally raises option premiums, benefiting buyers and hurting sellers.
Example:
If an option has a Vega of 0.10, a 1% rise in implied volatility will increase the option’s price by ₹0.10.
Interpretation:
Options with more time to expiration have higher Vega.
At-the-money options are more sensitive to volatility changes than deep in/out-of-the-money options.
Use in Hedging:
Traders hedge volatility exposure by taking opposite positions in options with similar Vega but different expirations or strike prices. For example, calendar spreads and straddles are often used to manage Vega risk.
6. Rho (ρ): Sensitivity to Interest Rates
Rho measures how much an option’s price changes for a 1% change in interest rates.
For call options, Rho is positive — higher rates increase their value.
For put options, Rho is negative — higher rates reduce their value.
While Rho is less impactful in short-term trading, it can influence long-term options significantly, especially when central banks alter monetary policy.
7. Combining Greeks for Effective Hedging
A successful options trader doesn’t look at any single Greek in isolation. Each Greek interacts with others, influencing risk and reward simultaneously. For example:
A position may be Delta-neutral but still exposed to Gamma and Vega risks.
Theta decay may offset Vega gains in some situations.
Therefore, professional traders use multi-Greek hedging — balancing Delta, Gamma, and Vega together to minimize exposure to market fluctuations, volatility changes, and time decay.
8. Practical Hedging Strategies Using Option Greeks
Here are some common hedging approaches that rely on understanding and adjusting Greeks:
a. Delta Hedging
The most common form of hedging. Traders adjust their stock or futures positions to offset the Delta of their options portfolio. This ensures that small price moves in the underlying have minimal impact on total portfolio value.
b. Gamma Hedging
Used by professional traders to reduce the rate at which Delta changes. This typically involves adding options positions that balance out the portfolio’s Gamma exposure, keeping Delta more stable as prices move.
c. Vega Hedging
To manage volatility exposure, traders use spreads such as calendar or diagonal spreads. These involve buying and selling options with different expiration dates or strikes to neutralize Vega.
d. Theta Management
For option buyers, Theta is a cost that must be managed by timing trades or using longer expirations. For sellers, it is a profit mechanism — hence, they may hedge Delta exposure but keep Theta positive to benefit from time decay.
9. Real-World Example
Imagine a trader buys a NIFTY call option with a Delta of 0.5, Gamma of 0.03, Vega of 0.08, and Theta of –0.04.
If the NIFTY index rises by 100 points, the option’s price should increase by approximately 50 points due to Delta. However, because of Gamma, Delta itself will rise slightly, amplifying the next move.
If market volatility increases by 1%, the option gains another 8 points from Vega. But as time passes, the option loses 4 points per day due to Theta.
By analyzing these Greeks together, the trader can anticipate how the position will behave and decide whether to hedge using futures or additional options.
10. Importance of Greeks and Hedging in Risk Management
In modern trading, understanding Option Greeks is essential not only for speculation but for risk management. They transform options from gambling instruments into sophisticated financial tools.
Delta helps manage directional exposure.
Gamma ensures stability of hedging.
Theta highlights the cost of holding positions.
Vega monitors volatility risk.
Rho prepares for interest rate shifts.
Through hedging, traders can create positions that align with their risk appetite and market outlook. The goal is not to eliminate risk entirely, but to control and balance it.
Conclusion
Option Greeks are the heartbeat of options pricing and risk management. They allow traders to quantify and predict how market variables—price, time, volatility, and interest rates—affect their positions. Mastering these Greeks is the first step toward becoming a disciplined, professional trader.
By integrating Greeks into hedging strategies, traders can protect their portfolios from adverse movements, stabilize returns, and operate with confidence in volatile markets. In essence, Greeks transform options trading from speculation into a science of probability and precision — where managing risk is as important as chasing profits.
Chart Patterns

Top Big Tech Stocks Leading the Rebound1. Understanding the Big Tech Rebound
The Big Tech rebound can be attributed to a mix of macroeconomic stability, improving corporate earnings, and renewed investor appetite for growth-oriented stocks. Over the past year, inflation has started cooling, and the U.S. Federal Reserve has signaled a pause or potential cuts in interest rates, which directly benefits technology stocks. Lower interest rates make future earnings more attractive in discounted cash flow models, leading investors to reallocate funds toward growth sectors like technology.
Moreover, strong quarterly earnings and improved forward guidance from top tech firms have reinforced faith in their long-term profitability. The adoption of Artificial Intelligence (AI), cloud computing, and digital transformation across industries has provided these companies with new growth engines that extend beyond their traditional business models.
2. Key Factors Fueling the Rally
Several fundamental and structural factors are driving the Big Tech rebound:
Artificial Intelligence Boom:
AI remains the central growth story. Companies integrating AI tools into their ecosystems — from data analytics to automation — are seeing exponential growth in demand. Nvidia’s dominance in AI chips and Microsoft’s integration of AI into its software suite are prime examples.
Easing Interest Rate Pressure:
With inflation moderating, investors expect the U.S. Federal Reserve to adopt a less aggressive stance on rate hikes. This environment favors high-growth tech firms, as it lowers borrowing costs and supports capital investments.
Resilient Earnings Performance:
Despite macro challenges, Big Tech firms have maintained strong profit margins through cost optimization, efficient operations, and diversification of revenue streams.
Massive Cash Reserves and Buybacks:
Big Tech companies hold enormous cash reserves, allowing them to fund innovation, make acquisitions, and repurchase shares — all of which support stock prices.
Digital Transformation Trends:
Enterprises worldwide continue to migrate to cloud-based systems and AI-enhanced tools, reinforcing demand for services offered by Big Tech leaders.
3. Top Big Tech Stocks Leading the Rebound
Let’s explore the key players spearheading this resurgence:
a. Apple Inc. (AAPL)
Apple remains a cornerstone of the global technology market. Despite slower iPhone sales in certain regions, the company’s growing ecosystem of services — including Apple Music, iCloud, and Apple TV+ — has provided stable recurring revenue. The tech giant is also expanding into wearable devices and exploring opportunities in AI and mixed reality through its Vision Pro headset.
Apple’s share repurchase programs and strong brand loyalty continue to attract investors seeking stability and consistent returns. As supply chains normalize and product innovation continues, Apple’s long-term growth outlook remains robust.
b. Microsoft Corporation (MSFT)
Microsoft is arguably the biggest beneficiary of the AI revolution. Through its partnership with OpenAI, Microsoft has embedded AI capabilities into its Office 365 and Azure Cloud platforms, transforming productivity tools and enterprise software. Azure continues to be a major growth driver, accounting for a significant portion of revenue expansion.
The company’s diversification — spanning gaming (Xbox and Activision Blizzard acquisition), enterprise software, and AI-driven applications — provides resilience against economic cycles. Microsoft’s consistent earnings growth and forward-looking AI strategy have made it a market leader in the current rebound.
c. Alphabet Inc. (GOOGL)
Alphabet, Google’s parent company, has also staged a strong comeback. Its core advertising business, powered by YouTube and Search, remains highly profitable, while its Google Cloud segment continues to grow rapidly. The company is leveraging AI to enhance ad efficiency, content moderation, and user personalization.
Alphabet’s AI model, Gemini, positions it as a key player in the race for generative AI dominance. Additionally, Alphabet’s investments in autonomous driving (Waymo) and quantum computing illustrate its long-term innovation strategy.
d. Amazon.com Inc. (AMZN)
Amazon has rebounded strongly on the back of its cloud computing arm, Amazon Web Services (AWS), which remains a market leader. The company’s focus on cost optimization and automation has improved profit margins across its e-commerce operations. Amazon’s AI integration — from logistics and inventory management to Alexa’s generative capabilities — underscores its adaptability.
Additionally, Amazon’s ventures into advertising and streaming (Prime Video) provide new avenues for revenue growth. With the company returning to strong earnings growth, investors see Amazon as a key pillar of the Big Tech rally.
e. Nvidia Corporation (NVDA)
No discussion of the Big Tech rebound is complete without Nvidia. As the world’s leading designer of AI chips and GPUs, Nvidia is the driving force behind the current AI revolution. Its chips power data centers, machine learning models, and autonomous systems globally.
Nvidia’s market capitalization has skyrocketed as demand for AI accelerators from companies like Microsoft, Meta, and Amazon continues to soar. With expanding product lines and leadership in semiconductor innovation, Nvidia is arguably the biggest winner of the current tech boom.
f. Meta Platforms Inc. (META)
Meta has undergone a remarkable transformation. After facing challenges related to advertising slowdown and regulatory scrutiny, the company refocused its strategy under the “Year of Efficiency” initiative. Cost reductions, AI-driven advertising tools, and enhanced engagement on platforms like Instagram and Threads have reignited investor confidence.
While Meta continues to invest heavily in the metaverse and augmented reality, its near-term growth is largely driven by AI-powered ad targeting and short-form video content. The company’s improved margins and strategic execution have made it one of the best-performing Big Tech stocks this year.
g. Tesla Inc. (TSLA)
Tesla’s inclusion in the Big Tech narrative reflects its position at the intersection of technology and mobility. The company’s leadership in electric vehicles (EVs) and advancements in autonomous driving and AI-based energy solutions have made it a market disruptor.
Despite facing margin pressures due to global EV competition, Tesla’s focus on innovation, cost reduction, and energy storage diversification keeps it a critical component of the tech-driven growth story. With new product lines and expansion into energy grids, Tesla remains a vital part of the rebound theme.
4. Broader Market Impact
The Big Tech rally has far-reaching implications. These companies collectively represent over 25% of the S&P 500’s market capitalization, meaning their performance significantly influences the overall index movement. The rebound has restored investor confidence, leading to capital inflows not only into tech ETFs but also into sectors that benefit indirectly — such as semiconductors, software, and digital infrastructure.
Furthermore, global markets are mirroring the U.S. trend, with Asian and European tech firms also witnessing renewed demand as investors bet on the global AI and digitalization wave.
5. Risks and Considerations
While the Big Tech rebound is promising, investors should remain mindful of potential risks:
Regulatory Challenges: Governments worldwide are tightening scrutiny on data privacy, competition, and AI ethics.
Valuation Concerns: Elevated valuations may lead to volatility if earnings growth slows.
Global Supply Chain Risks: Semiconductor supply constraints and geopolitical tensions can impact operations.
Economic Slowdowns: Any resurgence in inflation or aggressive rate hikes could dampen tech valuations.
6. Conclusion
The rebound of Big Tech stocks marks a renewed era of innovation-driven growth. Companies like Microsoft, Nvidia, Apple, Amazon, and Alphabet are not just bouncing back — they are leading the world into the next phase of technological evolution powered by AI, cloud computing, and digital ecosystems.
For investors and learners alike, this rebound offers an important lesson: long-term technological innovation tends to prevail over short-term market fluctuations. As Big Tech continues to shape industries, drive productivity, and redefine the global economy, their leadership in this market rebound underscores their enduring influence in the financial and technological landscape.

Introduction to the US Federal Reserve and Its Monetary Policy1. Introduction
The United States Federal Reserve, commonly referred to as the Fed, is the central bank of the United States. Established in 1913 through the Federal Reserve Act, its creation marked a turning point in American financial history. The primary purpose of the Federal Reserve is to ensure economic stability, financial soundness, and monetary discipline. It manages the nation’s money supply and interest rates to promote sustainable economic growth, control inflation, and reduce unemployment.
Over time, the Fed has evolved into one of the most powerful financial institutions in the world, influencing not only the U.S. economy but also global markets through its monetary policy decisions.
2. Structure of the Federal Reserve System
The Federal Reserve operates through a unique decentralized structure that balances private and public interests. It comprises three key components:
a. The Board of Governors
Located in Washington, D.C., the Board of Governors consists of seven members appointed by the President and confirmed by the Senate. Each governor serves a 14-year term. The Board supervises and regulates the operations of the Reserve Banks, formulates monetary policy, and oversees the U.S. financial system.
b. Federal Reserve Banks
There are 12 regional Federal Reserve Banks, each serving a specific district. These banks act as operational arms of the central bank, implementing policies, supervising member banks, and conducting economic research. Examples include the New York Fed, Chicago Fed, and San Francisco Fed.
The Federal Reserve Bank of New York is particularly significant because it conducts open market operations and manages U.S. Treasury securities.
c. Federal Open Market Committee (FOMC)
The FOMC is the Fed’s main monetary policy-making body. It includes the seven members of the Board of Governors and five of the twelve regional bank presidents (on a rotating basis). The FOMC meets regularly to decide on interest rates and other policy actions aimed at achieving the Fed’s macroeconomic goals.
3. The Federal Reserve’s Primary Goals
The Federal Reserve’s actions are guided by a dual mandate, though many experts refer to it as a triple mandate due to its broader scope:
Maximum Employment – ensuring that as many people as possible have jobs without sparking excessive inflation.
Stable Prices – maintaining inflation around a target of 2%, which supports purchasing power and economic stability.
Moderate Long-term Interest Rates – promoting sustainable economic growth by ensuring borrowing costs remain balanced over time.
These goals aim to create a stable financial environment where businesses can invest, consumers can spend confidently, and the economy can grow steadily.
4. Tools of Monetary Policy
The Federal Reserve uses several instruments to implement its monetary policy. These tools influence liquidity, credit availability, and overall economic activity.
a. Open Market Operations (OMOs)
This is the most frequently used tool. The Fed buys or sells U.S. Treasury securities in the open market to regulate the supply of money.
When the Fed buys securities, it injects money into the economy, lowering interest rates (an expansionary move).
When it sells securities, it pulls money out, increasing rates (a contractionary move).
Through OMOs, the Fed maintains its federal funds rate target — the interest rate at which banks lend reserves to each other overnight.
b. Discount Rate
The discount rate is the interest rate the Fed charges commercial banks for borrowing funds directly from the Federal Reserve.
A lower discount rate encourages banks to borrow more, increasing the money supply.
A higher discount rate discourages borrowing, tightening liquidity.
This tool signals the Fed’s stance — whether it wants to stimulate or cool down the economy.
c. Reserve Requirements
Banks must hold a portion of deposits as reserves with the Fed. Adjusting these requirements directly affects how much banks can lend.
Lower reserve requirements increase lending capacity and money supply.
Higher reserve requirements restrict lending and reduce liquidity.
Although rarely changed today, this tool remains a powerful instrument in theory.
d. Interest on Reserves
Since 2008, the Fed has paid interest on excess reserves (IOER) held by banks. This gives the Fed another way to control short-term interest rates. By changing the IOER, the Fed can influence how attractive it is for banks to lend versus keeping reserves parked with the Fed.
5. Types of Monetary Policy
The Federal Reserve adopts different policy stances based on economic conditions.
a. Expansionary Monetary Policy
When the economy is slowing or unemployment is rising, the Fed lowers interest rates and increases money supply. The goal is to stimulate borrowing, spending, and investment.
Example: During the 2008 Global Financial Crisis and the 2020 COVID-19 pandemic, the Fed used aggressive expansionary measures, including near-zero interest rates and large-scale asset purchases (quantitative easing).
b. Contractionary Monetary Policy
When inflation is high or the economy is overheating, the Fed raises interest rates and tightens the money supply. This discourages borrowing and reduces spending, helping stabilize prices.
Example: In 2022–2023, the Fed increased rates rapidly to control inflation that had spiked due to pandemic-related disruptions and geopolitical tensions.
6. Quantitative Easing and Unconventional Policies
In extraordinary times when traditional tools lose effectiveness (like when rates are near zero), the Fed uses unconventional measures, mainly:
Quantitative Easing (QE): Large-scale purchases of long-term securities to inject liquidity and lower long-term interest rates.
Forward Guidance: Communicating future policy intentions to influence market expectations.
Operation Twist: Buying long-term bonds and selling short-term ones to flatten the yield curve.
These tools help maintain market confidence and encourage investment when the economy faces deep recessions.
7. Impact of Federal Reserve Policies
The Fed’s actions ripple through every corner of the economy and global markets.
On Consumers: Lower interest rates make mortgages, auto loans, and credit cheaper, encouraging spending.
On Businesses: Easier access to credit supports investment and expansion.
On Financial Markets: Fed rate cuts usually boost stock markets, while hikes can cause corrections.
On Currency: Higher interest rates attract foreign capital, strengthening the U.S. dollar; lower rates can weaken it.
On Global Economy: Since the dollar is a global reserve currency, Fed decisions affect capital flows, inflation, and growth worldwide.
For instance, when the Fed tightens policy, emerging markets often experience capital outflows, weaker currencies, and inflationary pressure.
8. Challenges Faced by the Federal Reserve
Despite its influence, the Fed faces significant challenges:
Balancing Inflation and Growth: Raising rates to control inflation may slow growth and increase unemployment.
Global Interdependence: Global shocks (like oil prices or wars) can limit the Fed’s control over domestic inflation.
Market Expectations: Investors often react sharply to Fed communications, making it vital for the Fed to manage expectations carefully.
Fiscal Policy Coordination: The Fed’s monetary actions must often align with government fiscal policy to achieve stable outcomes.
9. The Federal Reserve and Transparency
Modern central banking emphasizes communication and transparency. The Fed now releases meeting minutes, forecasts, and press conferences to explain its decisions. This approach enhances public trust and helps financial markets anticipate future moves.
The “dot plot”, for example, shows policymakers’ interest rate projections, guiding investors and economists about the Fed’s outlook.
10. Conclusion
The U.S. Federal Reserve stands at the heart of the American and global financial systems. Its decisions shape the flow of credit, influence inflation, guide employment levels, and impact global capital markets. Through its monetary policy tools, the Fed seeks to balance growth with stability — a complex task that requires constant adaptation to changing economic realities.
In essence, the Federal Reserve is not merely a financial regulator; it is the guardian of monetary confidence. By carefully calibrating interest rates and liquidity, it strives to maintain a stable economy where growth, employment, and price stability coexist — not just for the United States but for the interconnected global economy as a whole.
Fundamental Analysis and Technical Analysis for Traders1. Introduction to Market Analysis
Market analysis helps traders evaluate the future price movements of assets like stocks, commodities, or currencies. The goal is to determine whether to buy, sell, or hold a security.
Fundamental Analysis focuses on intrinsic value — the “true worth” of a company or asset based on its financial and economic data.
Technical Analysis focuses on market behavior — analyzing charts, price movements, and patterns to predict future trends.
Both methods are valuable, and many professional traders use a blend of the two to confirm their strategies.
2. Understanding Fundamental Analysis
Fundamental Analysis is based on the belief that every asset has an intrinsic value determined by underlying financial and economic factors. If the market price is below this value, the asset is considered undervalued (a buy signal). If it’s above, it’s overvalued (a sell signal).
a. Purpose of Fundamental Analysis
The main goal is to determine whether a security is trading at a fair price. It answers the question: “Is this asset worth investing in for the long term?”
b. Key Components of Fundamental Analysis
Economic Analysis
Traders study macroeconomic indicators such as GDP growth, inflation, interest rates, employment levels, and fiscal policies. For example, lower interest rates often encourage borrowing and investment, boosting corporate earnings and stock prices.
Industry Analysis
Each company operates within an industry that affects its performance. Analysts evaluate industry trends, competition, growth potential, and regulatory environment. For example, the renewable energy sector may have strong prospects due to global sustainability trends.
Company Analysis
This involves studying a company’s financial health, management efficiency, and competitive position. Key financial statements used include:
Income Statement – reveals profitability.
Balance Sheet – shows assets, liabilities, and equity.
Cash Flow Statement – measures cash generation and spending.
c. Key Ratios Used in Fundamental Analysis
Price-to-Earnings (P/E) Ratio: Compares a company’s current price to its earnings per share.
Earnings Per Share (EPS): Measures profit allocated to each share.
Price-to-Book (P/B) Ratio: Compares market value to book value.
Debt-to-Equity Ratio: Indicates financial leverage and risk.
Return on Equity (ROE): Measures profitability relative to shareholder equity.
By combining these indicators, traders estimate whether the stock’s current price reflects its actual performance and growth potential.
3. Understanding Technical Analysis
Technical Analysis focuses on studying price action and market psychology through charts and indicators. The key belief is that “price discounts everything” — meaning all fundamental factors are already reflected in the market price.
a. Purpose of Technical Analysis
TA helps traders identify trends, entry and exit points, and potential reversals. It answers the question: “When should I buy or sell?”
b. Core Principles of Technical Analysis
Price Discounts Everything:
All news, earnings, and expectations are already factored into the price.
Prices Move in Trends:
Markets tend to move in identifiable trends — upward (bullish), downward (bearish), or sideways (consolidation).
History Repeats Itself:
Market behavior is influenced by human psychology, and price patterns often repeat over time.
c. Tools and Techniques in Technical Analysis
Charts and Patterns
Line Charts: Simplest form, showing closing prices.
Bar Charts: Show open, high, low, and close (OHLC).
Candlestick Charts: Visual representation of price action using candles.
Common patterns include:
Head and Shoulders: Indicates a reversal trend.
Triangles: Signal continuation or breakout.
Double Top/Bottom: Suggest trend reversal.
Indicators and Oscillators
Moving Averages (MA): Smooth out price data to identify trends.
Relative Strength Index (RSI): Measures overbought or oversold conditions.
MACD (Moving Average Convergence Divergence): Detects momentum and trend reversals.
Bollinger Bands: Measure market volatility.
Volume Profile: Shows traded volumes at different price levels, identifying strong support and resistance zones.
Support and Resistance Levels
Support is where the price tends to stop falling; resistance is where it tends to stop rising. These levels guide traders in planning entries and exits.
4. Comparison Between Fundamental and Technical Analysis
Aspect Fundamental Analysis Technical Analysis
Objective Determines intrinsic value Identifies price trends
Approach Based on financial & economic data Based on charts & indicators
Time Horizon Long-term Short-term to medium-term
Data Used Earnings, assets, economic growth Price, volume, patterns
Focus “Why” the price moves “When” the price moves
Best for Investors Traders
Drawback Slow to react to market moves Can ignore fundamentals
Both methods complement each other. For example, a trader might use fundamental analysis to choose a strong stock and technical analysis to time the entry and exit.
5. How Traders Combine Both Approaches
Many professional traders use a hybrid approach, combining the best of both worlds:
Step 1: Use Fundamental Analysis to select fundamentally strong stocks or currencies with good long-term prospects.
Step 2: Apply Technical Analysis to find the right time to enter or exit trades.
For example, if a company reports rising profits and strong guidance (fundamental strength), but the stock price is currently in a consolidation phase, a trader may wait for a breakout above resistance (technical signal) before buying.
6. Advantages and Limitations
a. Fundamental Analysis
Advantages:
Ideal for long-term investors.
Helps identify undervalued or overvalued assets.
Focuses on financial strength and future potential.
Limitations:
Not effective for short-term trading.
Market prices can remain irrational despite strong fundamentals.
Time-consuming data collection.
b. Technical Analysis
Advantages:
Useful for short-term trading decisions.
Provides clear entry and exit signals.
Reflects real-time market sentiment.
Limitations:
Can give false signals in volatile markets.
Ignores fundamental value.
Requires discipline and experience to interpret correctly.
7. Practical Example
Imagine two traders analyzing Infosys Ltd.
Trader A (Fundamental Analyst): Examines the company’s quarterly earnings, strong IT sector growth, and healthy balance sheet. He believes the stock is undervalued and buys it for the long term.
Trader B (Technical Analyst): Studies price charts, notes a bullish crossover in the MACD, and buys for a short-term rally.
Both traders are profitable but have different objectives and strategies. This shows how FA and TA can coexist effectively.
8. Conclusion
Fundamental and Technical Analysis are two powerful yet distinct methods for understanding market movements.
Fundamental Analysis helps you understand what to buy by identifying assets with strong financial potential.
Technical Analysis helps you decide when to buy or sell by tracking market behavior and sentiment.
In essence, fundamentals tell the story, and technicals tell the timing. Successful traders often combine both — using fundamentals to choose quality assets and technicals to manage entry, exit, and risk. In today’s fast-moving markets, mastering both approaches gives traders a strategic edge and helps them make well-informed, confident trading decisions.
Market Structure and Price Action1. Introduction
In trading, understanding market structure and price action is like learning the grammar and vocabulary of the market’s language. Market structure defines the overall framework of how prices move — the trend, swing highs and lows, and turning points. Price action, on the other hand, tells the story of how buyers and sellers interact within that structure. Together, they form the foundation of technical trading and are essential for making informed decisions without relying solely on indicators.
2. What Is Market Structure?
Market structure is the framework that shows how price behaves over time. It represents the sequence of highs and lows that reveal whether a market is trending upward, downward, or moving sideways.
At its core, market structure is built on three phases:
Uptrend (Bullish Structure):
Characterized by Higher Highs (HH) and Higher Lows (HL).
Each swing high surpasses the previous one, and each retracement forms a higher low, showing strong buying pressure.
Downtrend (Bearish Structure):
Characterized by Lower Highs (LH) and Lower Lows (LL).
Prices fail to make new highs, and sellers dominate, pushing the market downward.
Range (Consolidation):
Occurs when price moves sideways within a fixed zone of support and resistance.
Buyers and sellers are in balance, often leading to accumulation or distribution before a breakout.
3. Phases of Market Structure
Markets typically move through repeating cycles. Understanding these helps traders anticipate potential trend reversals.
A. Accumulation Phase
Happens after a downtrend when price begins to stabilize.
Institutional traders start buying gradually without causing big price spikes.
Price moves sideways, forming a base or range.
Volume often increases slightly during this phase.
B. Mark-Up Phase
The market breaks above resistance, confirming an uptrend.
Retail traders begin to notice the strength, and buying accelerates.
Higher highs and higher lows form clearly.
Corrections are shallow as demand outweighs supply.
C. Distribution Phase
After a strong uptrend, large players start offloading positions.
Price forms a top or range — similar to accumulation but at higher levels.
Market shows exhaustion; volume may decline.
Often followed by a breakdown below support.
D. Mark-Down Phase
Price breaks below key support levels.
Sellers take control, leading to lower highs and lower lows.
Panic selling and bearish sentiment dominate.
The phase often ends when buyers start reaccumulating again — completing the cycle.
4. How to Identify Market Structure
To read market structure effectively:
Identify swing highs and swing lows.
Label the structure: HH, HL (uptrend) or LH, LL (downtrend).
Mark key zones: support, resistance, and break of structure (BOS).
Look for structural shifts: When a higher low breaks below a previous low, it signals a potential reversal.
Example:
If the market has been forming HH and HL but suddenly forms a Lower Low (LL) followed by a Lower High (LH) — that’s a shift in market structure from bullish to bearish.
5. What Is Price Action?
Price action is the study of price movement on a chart without using lagging indicators. It shows how market participants react to various price levels in real time.
Traders use candlestick patterns, support-resistance zones, and trendlines to interpret price action and anticipate future movement.
In essence, price action reflects market psychology — how greed, fear, and expectations manifest in price.
6. Key Elements of Price Action
A. Candlestick Behavior
Candlestick charts are the foundation of price action analysis.
Each candle shows the battle between buyers and sellers in a given period:
Bullish Candle: Buyers are stronger (close > open).
Bearish Candle: Sellers are stronger (close < open).
Important candle signals:
Pin Bar / Hammer: Reversal signal showing rejection of lower prices.
Engulfing Candle: Strong reversal sign where one candle engulfs the previous one.
Doji: Indecision or potential reversal area.
B. Support and Resistance
Price tends to react repeatedly at certain zones:
Support: A level where demand pushes prices up.
Resistance: A level where supply pushes prices down.
Price action traders look for breakouts, retests, and false breaks around these levels to find trade entries.
C. Trendlines and Channels
Drawing trendlines connecting swing highs or lows helps visualize structure.
A series of higher lows connected by a trendline confirms bullish control.
Similarly, parallel channels help identify overbought or oversold zones within a trend.
D. Market Rejection and Imbalance
When price moves sharply in one direction leaving a “gap” or imbalance, it signals strong institutional activity.
Traders often look for price to retrace to fill these imbalances before continuing the main trend.
7. Relationship Between Market Structure and Price Action
Price action and market structure are inseparable. Market structure provides the macro context — the overall direction — while price action gives the micro details for timing entries and exits.
For example:
In an uptrend, traders use price action to buy during pullbacks (at HLs).
In a downtrend, traders use price action to sell rallies (at LHs).
During range markets, price action helps identify breakouts or reversals at boundaries.
A price action setup has higher probability when it aligns with the market structure trend.
For instance, a bullish engulfing candle at a higher low within a bullish structure is more reliable than one forming randomly.
8. Tools and Techniques for Price Action Traders
Though price action trading avoids heavy indicators, some tools can enhance clarity:
Volume Profile: Reveals where most trading occurred — key areas of interest.
Order Blocks: Institutional zones where large orders were previously placed.
Fair Value Gaps (FVGs): Gaps showing inefficiency between buyers and sellers.
Liquidity Zones: Areas above highs or below lows where stop losses are accumulated.
These concepts, part of Smart Money Concepts (SMC), integrate price action with institutional market structure understanding.
9. Common Price Action Strategies
A. Break of Structure (BOS) Entry
When price breaks a previous high or low, traders wait for a retest to enter in the direction of the breakout.
B. Rejection from Key Zones
Look for reversal candlesticks (like pin bars) near support/resistance or order blocks.
C. Trend Continuation
After a pullback to a higher low (in an uptrend), wait for bullish confirmation candles to rejoin the trend.
D. Fakeout Strategy
When price briefly breaks support/resistance but fails to sustain, it traps traders and reverses sharply — an opportunity for contrarian entries.
10. The Psychology Behind Market Structure and Price Action
Every candle and structure shift represents the emotion of market participants.
Uptrends show confidence and optimism.
Downtrends reflect fear and panic.
Consolidations show indecision or accumulation.
Recognizing these emotional patterns helps traders align themselves with the smart money rather than reacting impulsively.
11. Importance for Traders
Mastering market structure and price action:
Eliminates dependence on lagging indicators.
Improves timing and accuracy of trades.
Provides clarity on trend direction and key zones.
Builds confidence through understanding why price moves.
Professional traders, institutional desks, and even algorithmic systems rely on structure and price movement — not random signals — because they reflect real market intent.
12. Conclusion
Market structure and price action form the core foundation of technical trading. Market structure shows the skeleton — the trend, phases, and key levels — while price action gives the heartbeat — how buyers and sellers interact within that framework.
By studying swing points, candlestick behavior, and the rhythm of higher highs and lows, traders can interpret the market’s language without confusion. Whether you trade intraday, swing, or positional setups, understanding structure and price action ensures you’re trading with the flow, not against it.
Emotional Discipline and Risk Control in Trading🧠 1. Why Emotional Discipline Matters
Emotional discipline means sticking to your plan regardless of fear or greed.
Markets are designed to test your patience, confidence, and decision-making. Every losing trade tempts you to change your system — but consistency wins.
✅ Key habits of emotionally disciplined traders:
They accept losses without revenge trading.
They follow rules, not impulses.
They manage expectations — no trade will make them rich overnight.
💰 2. Risk Control — Protect Before You Profit
Your risk management defines your survival. Successful traders think in probabilities, not certainties. They never risk too much on one idea.
📏 Golden Rules of Risk Control:
Risk 1–2% of your capital per trade.
Always use a stop-loss, never a “mental” one.
Define your R:R ratio (minimum 1:2 or better).
Never add to a losing position — only to confirmed winners.
Risk control is not about avoiding losses — it’s about limiting damage and staying consistent over time.
🧩 3. How to Strengthen Emotional Discipline
Like a muscle, discipline grows with routine. Try this daily:
Pre-trade routine – review your plan before every session.
Post-trade journal – log your emotions, not just results.
Take breaks – emotional fatigue leads to poor judgment.
Detach from outcomes – focus on process, not profit.
💡 Tip: When you reduce emotional pressure, your clarity and accuracy both improve.
⚙️ 4. Professional Mindset Shift
Amateurs chase profit; professionals protect capital.
Each trade is just one data point — not a reflection of your worth. Once you start thinking like a risk manager first, your results change naturally.
🗣️ “Discipline is choosing what you want most over what you want now.”
📊 Conclusion
To grow as a trader, focus on controlling yourself before controlling the market.
Emotional stability + strict risk control = long-term success.
Be the trader who executes with logic, not emotion. 🧘♂️
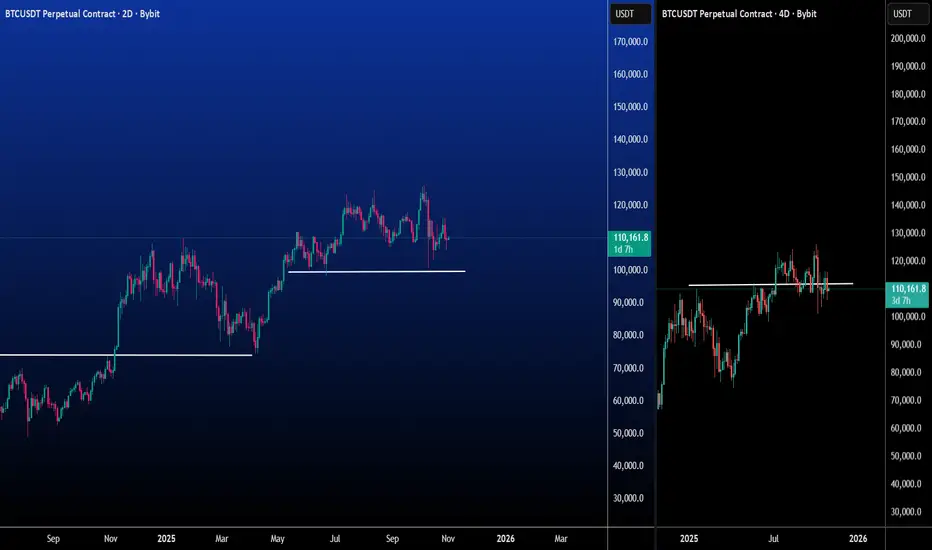
ByBit BTCUSDT Chart ( Mid Term Trade )Welcome Back To My Page.
Very Simple Chart.
-> First Trend Line
-> Second Trend Line
As we see the the pullback from the first Trend Line in Left Graph, Right Side Graph shows that Price got rejected from it's ATH and looking to take the support at Second Trend Line.
Like If your view align with my view.
Make sure any strong new now capable to Dump the price so take this advantage as December arrives soon.
Note : This is not a financial advice. Made just for Educational purpose
Part 10 Trade Like Institutions Option Trading Strategies
Options offer immense flexibility. Traders can combine calls and puts in various ways to create strategies suitable for bullish, bearish, or neutral markets. Some popular ones include:
Covered Call: Holding a stock while selling a call option to earn premium income.
Protective Put: Buying a put option to hedge a long stock position.
Bull Call Spread: Buying one call option and selling another at a higher strike to limit cost.
Bear Put Spread: Buying one put and selling another at a lower strike to profit from a downtrend.
Iron Condor: A non-directional strategy involving both calls and puts to profit from low volatility.
Straddle: Buying both a call and a put with the same strike to profit from big moves in either direction.
These strategies balance risk and reward depending on the trader’s view and volatility expectations.

Part 9 Trading Master Class With Experts How Option Pricing Works
Option prices are determined by several factors, most notably:
Intrinsic Value – The real value if exercised today (difference between the current price and strike price).
Time Value – The additional amount traders are willing to pay due to the time left until expiration.
Volatility – Higher volatility means higher uncertainty, leading to higher premiums.
Interest Rates and Dividends – These also affect pricing but to a lesser degree.
The most popular model for calculating option prices is the Black-Scholes Model, which uses these variables to estimate fair value.

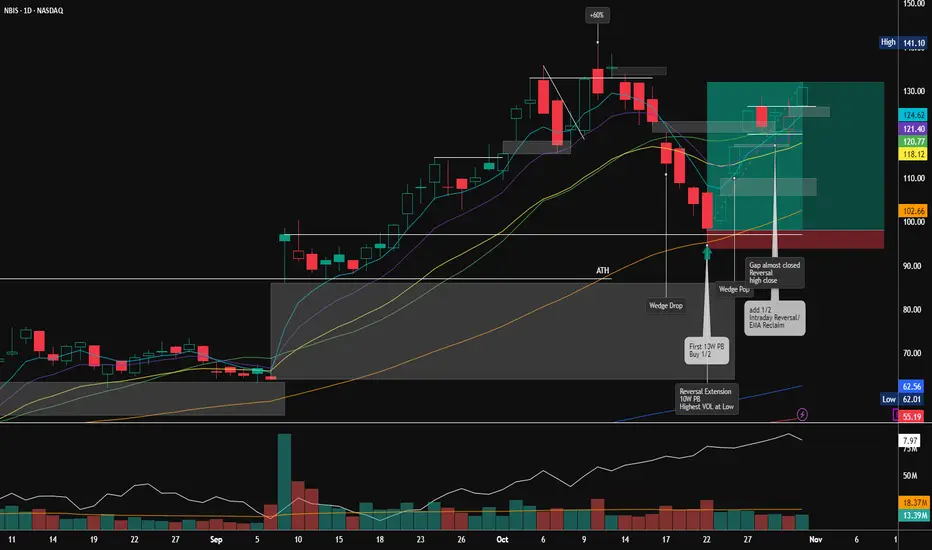
How would you Trade NBIS?Cyan -> 5 EMA
Violette -> 10 EMA
Yellow -> 20 EMA
Green -> 20 SMA
Orange -> 50 SMA
Blue -> 150 SMA
Red -> 200 SMA
Would you have traded NBIS exactly as I did?
Part 8 Trading Master Class With ExpertsTypes of Options Based on Exercise Style
Options can also differ based on when they can be exercised:
American Options: Can be exercised any time before expiry (used in U.S. markets).
European Options: Can only be exercised on the expiry date (common in India and Europe).
On Indian exchanges like NSE, most index and stock options are European-style.

Part 6 Learn Institutional Trading How Option Trading Works
When you trade options, there are two sides to every contract: the buyer and the seller.
Option Buyer: Pays the premium for the right to exercise the option. Their risk is limited to the premium paid but potential profit is unlimited (in calls) or substantial (in puts).
Option Seller (Writer): Receives the premium upfront but assumes an obligation if the buyer exercises the option. Their potential loss can be large, depending on market movement.
For example:
Let’s say stock XYZ is trading at ₹100.
You buy a call option with a strike price of ₹105, paying a premium of ₹3.
If XYZ rises to ₹115 before expiry, your profit = (115 – 105) – 3 = ₹7 per share.
If it stays below ₹105, your loss is limited to ₹3 (the premium paid).

Part 4 Learn Institutional Trading Key Terminology in Option Trading
To understand options, one must be familiar with some basic terms:
Underlying Asset: The instrument on which the option is based (e.g., stock, index, or commodity).
Strike Price: The price at which the option holder can buy (call) or sell (put) the asset.
Premium: The cost paid by the option buyer to acquire the contract.
Expiration Date: The date when the option contract becomes void.
In-the-Money (ITM): A call option is ITM when the underlying price is above the strike; a put is ITM when the price is below the strike.
Out-of-the-Money (OTM): The opposite of ITM. The call option has no intrinsic value when the price is below the strike; a put option has none when the price is above the strike.
At-the-Money (ATM): When the underlying price and strike price are nearly equal.
Intrinsic Value: The actual profit if the option were exercised immediately.
Time Value: The portion of the premium that reflects the probability of the option gaining value before expiry.

Part 3 Learn Institutional Trading What Are Options?
An option is a derivative contract whose value is derived from an underlying asset such as a stock, index, commodity, or currency. The buyer of an option pays a premium to the seller (also called the writer) for the right—but not the obligation—to execute the trade under specified terms.
There are two main types of options:
Call Option: Gives the buyer the right to buy the underlying asset at a fixed price (called the strike price) before or on the expiry date.
Put Option: Gives the buyer the right to sell the underlying asset at the strike price before or on the expiry date.
These contracts can be traded on exchanges (like NSE, BSE, CBOE) or over-the-counter (OTC).

Intraday and Scalping Strategies: Mastering Short-Term Trading1. Introduction
In the fast-paced world of stock trading, two of the most active and adrenaline-filled approaches are intraday trading and scalping. These trading styles revolve around capturing small price movements within the same trading session—without holding positions overnight. Traders using these methods aim to exploit market volatility, volume spikes, and short-term trends to generate profits.
While both intraday and scalping share the same principle—quick trades—they differ in timeframes, position sizes, and profit expectations. Intraday traders hold positions for minutes to hours, while scalpers operate on a much shorter horizon, often seconds or a few minutes. Success in these methods requires discipline, technical analysis mastery, and a deep understanding of market structure and momentum.
2. Understanding Intraday Trading
Definition
Intraday trading, also known as day trading, involves buying and selling financial instruments—such as stocks, indices, commodities, or forex—within a single trading day. Traders aim to profit from short-term price fluctuations without carrying overnight risk.
Objective
The core objective of intraday trading is to capitalize on daily volatility. Traders focus on price action, news-driven moves, and liquidity zones to identify opportunities.
Timeframe
Intraday traders typically use charts ranging from 1-minute to 15-minute intervals for entries and exits, while analyzing higher timeframes like the 1-hour or 4-hour chart for overall trend direction.
3. The Mechanics of Intraday Trading
a. Market Selection
Intraday traders prefer stocks or instruments that have:
High liquidity (easy entry and exit)
Volatility (to create meaningful price movements)
Strong volume participation
For example, large-cap stocks, index futures (like NIFTY, BANK NIFTY), and active currency pairs (like EUR/USD) are common choices.
b. Time of Entry
The most volatile and profitable intraday periods are:
Opening hour (9:15–10:30 AM IST) – when overnight news is absorbed.
Closing hour (2:30–3:30 PM IST) – as institutional traders adjust their positions.
c. Leverage
Intraday traders often use margin trading, which magnifies both profits and risks. For instance, with 5x leverage, a 1% move can yield a 5% profit—or loss.
d. Tools and Indicators
Some of the most popular technical tools used by intraday traders include:
Moving Averages (MA): Identifying short-term trend direction.
VWAP (Volume Weighted Average Price): Used as an intraday benchmark.
MACD & RSI: Momentum indicators signaling strength or weakness.
Support and Resistance Levels: Key zones where price often reacts.
Volume Profile: To identify price levels with maximum trading activity.
4. Popular Intraday Trading Strategies
a. Momentum Trading
Momentum traders seek stocks that are moving strongly in one direction with high volume. The goal is to “ride the momentum” until signs of reversal appear.
Example:
If a stock breaks above a key resistance with high volume, a trader may buy with a stop-loss below the breakout level.
b. Breakout Trading
This strategy focuses on entering positions when the price breaks through well-defined support or resistance levels.
Entry: When price closes above resistance or below support.
Stop-loss: Just outside the breakout zone.
Target: Based on previous swing or risk-reward ratio (often 1:2).
c. Reversal Trading
Contrarian traders look for signs that a trend is about to reverse, such as:
Divergences in RSI or MACD
Candlestick reversal patterns (e.g., hammer, shooting star)
Volume exhaustion
d. Gap Trading
Traders exploit price gaps created by overnight news, earnings, or global cues. For example:
Gap-up open: Short if the stock fails to hold early gains.
Gap-down open: Buy if the price recovers with strong volume.
e. VWAP Strategy
The VWAP line acts as a fair value indicator for intraday traders.
Above VWAP: Indicates bullish bias.
Below VWAP: Indicates bearish bias.
Institutional traders often use VWAP to execute large orders efficiently.
5. Understanding Scalping
Definition
Scalping is the fastest form of trading, involving dozens—or even hundreds—of trades within a single session. Scalpers aim to capture tiny profits (5–10 paise or a few ticks) multiple times throughout the day.
Objective
The goal is to exploit micro-price movements and order flow inefficiencies. Scalpers rely on high liquidity and rapid execution rather than large price swings.
Timeframe
Scalpers operate in seconds to a few minutes. They rely heavily on 1-minute charts, tick charts, and order book depth for decision-making.
6. Key Principles of Scalping
a. Speed and Precision
Scalpers depend on fast execution and tight spreads. Even a few seconds of delay can turn a winning trade into a loss.
b. Small Targets, Strict Stops
A scalper might target 0.05–0.2% profit per trade with equally small stop-losses.
The focus is on high accuracy and consistency rather than big gains.
c. High Trade Frequency
Scalpers execute many trades in a session. For example, if a trader makes 50 trades with a ₹100 average profit, total profit = ₹5,000.
d. Leverage Usage
Because profits per trade are small, scalpers often use higher leverage—but this also magnifies risk.
e. Market Depth Analysis
Scalpers monitor Level II data (order book) to anticipate short-term imbalances in buying and selling pressure.
7. Popular Scalping Techniques
a. Bid-Ask Spread Scalping
Traders take advantage of the small difference between the bid and ask prices.
This method requires ultra-fast execution and often direct market access (DMA) platforms.
b. Moving Average Cross Scalping
Uses two short-term moving averages (e.g., 9 EMA and 21 EMA):
Buy signal: When shorter EMA crosses above longer EMA.
Sell signal: When it crosses below.
c. Price Action Scalping
Relies purely on candlestick patterns and support/resistance zones without indicators. Traders look for micro-trends or breakout candles for quick entries.
d. News-Based Scalping
During economic releases (like inflation data, RBI announcements, or Fed decisions), markets become volatile. Scalpers exploit rapid price moves right after such events.
e. Range Scalping
When markets move sideways, scalpers buy at the bottom of the range and sell near the top repeatedly—profiting from oscillations.
8. Tools and Platforms for Scalping and Intraday Trading
Both strategies demand real-time precision, so traders rely on:
Advanced charting platforms: TradingView, MetaTrader, ThinkorSwim, Zerodha Kite, etc.
Fast order execution: Brokers offering low-latency trading.
Level II data & market depth: To analyze liquidity zones.
Hotkeys and algorithms: For instant order placement.
High-speed internet and dual-screen setups are common among serious intraday traders.
9. Risk Management: The Heart of Short-Term Trading
Both intraday and scalping strategies can yield consistent returns—but only with strict risk control.
Key Rules:
Use Stop-Losses: Never trade without predefined exits.
Position Sizing: Risk only 1–2% of total capital per trade.
Avoid Overtrading: Stick to your setup; don’t chase losses.
Set Daily Limits: Stop trading after hitting max loss or profit goals.
Control Emotions: Greed and fear are the biggest threats in short-term trading.
Risk-Reward Example:
If your stop-loss is ₹2 and target is ₹4, you maintain a 1:2 ratio. Even with 50% accuracy, you remain profitable.
10. Psychology Behind Short-Term Trading
Scalping and intraday trading test a trader’s discipline and emotional control. Success depends not only on strategy but also on mindset:
Patience: Waiting for perfect setups.
Emotional neutrality: No excitement after wins or frustration after losses.
Focus: Constant screen time and attention to detail.
Adaptability: Changing tactics as market conditions shift.
A calm, rule-based approach outperforms impulsive decision-making every time.
11. Best Practices for Successful Execution
Start Small: Begin with small capital and low-risk trades.
Backtest Strategies: Analyze performance on historical data.
Journal Every Trade: Record reasons, outcomes, and emotions.
Avoid News Noise: Focus on technical levels, not random headlines.
Improve Continuously: Refine setups based on win-rate analysis.
12. Combining Scalping and Intraday Approaches
Some professional traders blend both:
Use scalping during volatile periods (opening or news hours).
Use intraday swing trades during calmer, trend-driven phases.
This hybrid model balances frequency and profitability—allowing flexibility based on volatility and market mood.
Conclusion
Intraday and scalping strategies offer exciting opportunities to profit from short-term market movements. They demand speed, discipline, and sharp technical skills. Unlike long-term investing, where time cushions errors, intraday and scalping reward precision and risk management.
The secret to mastering these techniques lies not in trading more, but in trading smart—with a consistent plan, strict stops, and psychological balance. For those willing to put in the effort, the art of short-term trading can become both a profitable skill and a professional edge.
AI, Big Data & Predictive Analytics in TradingIntroduction: The Fusion of Technology and Markets
Over the last two decades, the world of trading has evolved from simple human-driven decisions to a technologically advanced ecosystem powered by artificial intelligence (AI), big data, and predictive analytics. Financial markets today generate an immense volume of data every second—from stock prices, news feeds, social media sentiment, and macroeconomic indicators to even satellite imagery and alternative data sources.
The challenge for traders and investors is no longer about accessing information, but rather about interpreting and utilizing it effectively. This is where AI, Big Data, and Predictive Analytics step in. They collectively empower traders to identify opportunities, manage risk, and execute strategies faster and more accurately than ever before.
1. Understanding the Core Concepts
Before diving deeper, it’s important to define the three core components transforming trading:
Artificial Intelligence (AI)
AI refers to computer systems that can perform tasks requiring human-like intelligence—such as recognizing patterns, making decisions, and learning from experience. In trading, AI systems can analyze historical data, detect anomalies, and even make autonomous buy/sell decisions.
Big Data
Big Data represents the massive and complex sets of information generated from multiple sources—market feeds, economic reports, tweets, and even sensor data. This data is often characterized by the three Vs: Volume (massive size), Velocity (speed of generation), and Variety (different data types). Traders use big data analytics tools to uncover hidden correlations and market insights that traditional models often miss.
Predictive Analytics
Predictive analytics involves using statistical algorithms, data mining, and machine learning to forecast future outcomes. In trading, predictive models analyze historical price behavior, market sentiment, and macroeconomic indicators to predict price movements, volatility spikes, or trend reversals.
Together, these three technologies form the backbone of quantitative and algorithmic trading in modern markets.
2. How Big Data Fuels Modern Trading
Every tick, trade, and transaction in the financial market adds to a sea of information. Big Data allows traders to capture this data and extract actionable intelligence.
Key Sources of Big Data in Trading:
Market Data: Price feeds, order book data, volume profiles, and volatility indices.
Fundamental Data: Corporate earnings, balance sheets, macroeconomic indicators.
Alternative Data: Social media sentiment, Google search trends, web traffic analytics.
Geospatial and Satellite Data: Used by hedge funds to monitor industrial activity or crop yields.
Transactional Data: Payment records and credit card spending patterns reflecting consumer sentiment.
How It’s Used:
Big Data analytics tools process petabytes of information to detect correlations—for example, how rising oil prices might affect airline stocks or how social media mentions of a company could influence its short-term price.
For instance, quant funds like Renaissance Technologies or Two Sigma rely heavily on structured and unstructured data sets to find non-obvious relationships that traditional analysis would overlook.
The Competitive Edge:
In today’s markets, possessing more data is not enough; it’s about who can analyze it faster and smarter. Traders equipped with real-time analytics can identify shifts in sentiment or volatility before the rest of the market reacts—turning milliseconds of advantage into millions in profit.
3. The Role of Artificial Intelligence in Trading
AI takes data analysis one step further by enabling systems that learn from experience and adapt to changing market conditions.
Key AI Applications in Trading:
Machine Learning Models
These algorithms train on historical data to recognize patterns—such as when a stock is likely to break out of a price range.
Models like Random Forests, Gradient Boosting, and Neural Networks are frequently used to predict asset prices, volatility, and correlations.
Deep Learning and Neural Networks
Deep learning networks simulate human brain behavior to find intricate nonlinear patterns.
In trading, deep learning models are used for image recognition (chart pattern identification), natural language processing (news sentiment), and time-series forecasting.
Natural Language Processing (NLP)
NLP allows AI systems to “read” and “understand” text-based data—such as earnings reports, news headlines, and tweets.
For example, algorithms can instantly gauge whether a CEO’s statement is positive, neutral, or negative and trade accordingly.
Reinforcement Learning
A type of AI that learns optimal strategies through trial and error.
Used in portfolio optimization, automated trading bots, and dynamic risk management systems.
Robo-Advisors
AI-driven investment platforms that automatically allocate portfolios based on user goals and risk appetite.
They continuously rebalance portfolios as market conditions change—offering accessibility to retail investors at minimal cost.
AI in Decision-Making:
Unlike human traders, AI doesn’t suffer from fatigue or emotions. It executes based purely on logic and data-driven signals. This reduces bias and improves trading consistency, though it introduces new risks, such as algorithmic errors or overfitting.
4. Predictive Analytics: The Power of Forecasting
Predictive analytics bridges the gap between past and future by transforming historical patterns into forecasts.
Techniques Used in Predictive Analytics for Trading:
Regression Models: Estimate the relationship between variables (e.g., GDP growth and stock index performance).
Time-Series Analysis: Forecast price trends using historical data patterns, volatility clustering, and seasonal effects.
Monte Carlo Simulations: Model multiple possible future price paths to estimate risk.
Sentiment Analysis: Assess the emotional tone behind market chatter to predict short-term volatility.
Event-Driven Modeling: Predict market reactions to upcoming earnings, interest rate decisions, or geopolitical events.
For example, predictive analytics might identify that when gold prices rise by 2% and the dollar index falls by 1%, emerging market equities tend to outperform within two weeks. Such insights help traders position themselves ahead of time.
5. Real-World Examples of AI and Data-Driven Trading
High-Frequency Trading (HFT):
Firms like Citadel Securities and Jump Trading use AI-powered algorithms to execute thousands of trades per second. These systems react to micro-changes in prices faster than any human could.
Quantitative Hedge Funds:
Funds such as Renaissance Technologies, Two Sigma, and AQR Capital Management rely on massive datasets and machine learning models to identify repeatable patterns. Their edge lies in continuously retraining models to adapt to new data.
Retail Trading Platforms:
Apps like Robinhood, Zerodha, and eToro integrate AI tools to recommend trades, provide risk alerts, or forecast trends using sentiment indicators and pattern recognition.
Sentiment Analysis Tools:
AI-driven analytics platforms (like Dataminr or Accern) scan millions of online data points in real-time to alert traders to breaking news before it hits mainstream outlets.
6. Advantages of AI, Big Data & Predictive Analytics in Trading
Speed and Efficiency:
Automated systems process millions of data points in milliseconds—far beyond human capability.
Data-Driven Objectivity:
Decisions are made on logic and data, not emotion or intuition.
Pattern Recognition:
AI can detect complex, nonlinear relationships that traditional models miss.
Risk Management:
Predictive analytics can forecast potential drawdowns and volatility spikes, allowing traders to hedge in advance.
Cost Reduction:
AI and automation reduce manual analysis time and the cost of large research teams.
Scalability:
Models can be applied across multiple asset classes and markets simultaneously.
7. Challenges and Limitations
Despite the benefits, AI and Big Data in trading come with certain limitations:
Data Quality and Noise:
Massive datasets often contain errors or irrelevant data, leading to false signals.
Overfitting:
Models trained too specifically on past data may fail in changing market conditions.
Black-Box Models:
Deep learning models often lack transparency—making it hard to explain why a trade was made.
Ethical and Regulatory Risks:
The use of AI raises questions about fairness, accountability, and compliance with financial regulations.
Market Crowding:
When many algorithms follow similar patterns, it can lead to sudden flash crashes or liquidity imbalances.
8. The Future of AI and Predictive Trading
The future of trading lies in integration—where AI, big data, and predictive analytics merge seamlessly to create adaptive, self-learning trading ecosystems.
Emerging Trends:
Explainable AI (XAI): Focus on improving transparency and interpretability of AI decisions.
Quantum Computing: Expected to revolutionize predictive analytics with faster, more complex computations.
Hybrid Models: Combining human intuition with AI precision for balanced decision-making.
Alternative Data Expansion: Use of geolocation, climate, and sentiment data for edge prediction.
Automated Risk Assessment: Real-time portfolio stress testing through predictive algorithms.
Human-AI Collaboration:
While AI excels at processing data, human traders still play a vital role in understanding macro context, ethics, and judgment calls. The most successful trading models of the future will combine human experience with machine intelligence.
9. Conclusion: Data Is the New Alpha
In the modern trading world, data is the new form of “alpha”—the edge that separates winning strategies from the rest. The combination of AI, Big Data, and Predictive Analytics is redefining not just how markets are analyzed, but how decisions are made, risks are managed, and profits are realized.
Traders who harness these technologies gain access to a level of precision, speed, and foresight that was once unimaginable. Yet, the true success lies in balance—using data-driven insights while maintaining human oversight and adaptability.
In essence, the trading floor of the future isn’t just about human intuition or machine learning—it’s about intelligent collaboration between the two, powered by algorithms that see the unseen and predict the unpredictable.
Smart Money Concepts (SMC) and Institutional Order Flow1. Introduction: Understanding the Market Beyond Retail Noise
Most retail traders lose money not because they lack effort but because they follow the market’s surface moves rather than its hidden intentions. Price charts show what has already happened — but Smart Money Concepts (SMC) and Institutional Order Flow reveal why it happened.
SMC is a modern trading framework built on the idea that large institutions, hedge funds, and banks — the so-called “smart money” — drive market trends. Their goal is not to “trade” but to accumulate and distribute liquidity. Retail traders, often unknowingly, provide that liquidity.
SMC teaches traders how to identify where institutional players are entering and exiting positions. It focuses on understanding liquidity, market structure, order blocks, and the psychology of accumulation and manipulation.
2. The Foundation of Smart Money Concepts
Smart Money Concepts evolved from the teachings of ICT (Inner Circle Trader) and Wyckoff theory. It blends market structure analysis, liquidity theory, and institutional footprints into a unified framework.
At its core, SMC assumes that the market moves through a cycle driven by institutional intentions:
Accumulation – Smart money builds long positions quietly.
Manipulation (Stop Hunt) – Price is driven below or above key levels to trigger liquidity.
Distribution (Expansion) – Price moves strongly in the intended direction.
Re-Accumulation or Redistribution – Trend continuation or reversal zones form.
The retail mindset looks for patterns (double tops, indicators), but SMC looks for intentions — where smart money must buy or sell to fill massive orders.
3. The Core Principles of Smart Money Concepts
A. Market Structure
Market structure is the backbone of SMC. It identifies the direction of institutional order flow — whether the market is making higher highs and higher lows (bullish) or lower highs and lower lows (bearish).
Key structural elements include:
BOS (Break of Structure) – When price breaks the previous swing high or low, signaling a continuation.
CHOCH (Change of Character) – A shift from bullish to bearish structure (or vice versa), often indicating a reversal.
Market structure shows where institutions are likely to transition from accumulation to expansion phases.
B. Liquidity
Liquidity refers to clusters of orders resting at obvious levels — such as stop-losses above swing highs or below swing lows. Institutions need liquidity to fill large positions, so they manipulate price toward these zones.
Common liquidity pools include:
Equal Highs/Lows – Where stop orders are concentrated.
Trendline Liquidity – Price repeatedly bounces off a line, attracting more retail traders.
Session Highs/Lows – Intraday liquidity pools, especially during London and New York sessions.
Once these areas are raided, the true move — aligned with institutional direction — often begins.
C. Order Blocks
An order block (OB) is the last opposite candle before an impulsive move. It represents the footprint of institutional accumulation (in bullish moves) or distribution (in bearish moves).
Types:
Bullish Order Block – The last bearish candle before a strong bullish push.
Bearish Order Block – The last bullish candle before a strong bearish drop.
Price often retraces to these OBs to “rebalance” before continuing. They act as institutional zones of interest.
D. Imbalance or Fair Value Gaps (FVG)
When price moves aggressively in one direction, it can leave behind an imbalance — a region with unfilled orders. These are inefficiencies institutions may later revisit to complete their transactions.
In SMC, traders look for FVG retracements as potential entries when the overall structure aligns with institutional direction.
E. Inducement
Before price reaches an order block or liquidity pool, it often creates smaller “bait” structures — inducements — to trap early traders. For example, a mini double-top before a liquidity sweep ensures enough orders are available for institutions to enter.
4. Institutional Order Flow: The Engine Behind SMC
Order flow represents the sequence and intention of institutional buying and selling. Unlike retail traders who react to indicators, institutions plan their trades around liquidity collection.
Here’s how order flow unfolds institutionally:
Position Building (Accumulation) – Institutions buy/sell in fragments at key zones, keeping price within a range.
Liquidity Engineering – They allow retail traders to establish positions by creating obvious patterns (e.g., false breakouts).
Stop Hunt / Manipulation Phase – Price violently breaks the structure to grab liquidity (stops and pending orders).
Market Expansion – Once liquidity is captured, institutions drive price toward their true profit targets.
Distribution / Exit – They unload positions gradually, creating new liquidity traps for the next cycle.
This cycle repeats on all timeframes, from the 1-minute chart to the daily.
5. The Smart Money Cycle: Accumulation to Distribution
To understand institutional order flow, visualize the market as a four-phase process:
Phase 1: Accumulation
Price ranges in a tight zone. Retail traders view this as consolidation, but institutions are building positions quietly. Volume may rise slightly but with no clear trend.
Clues:
Flat structure with equal highs/lows.
Multiple liquidity pools forming on both sides.
Inducement wicks below or above range lows/highs.
Phase 2: Manipulation
The market suddenly sweeps one side of the range — a fake breakout. This is the “stop hunt” where liquidity is collected. Retail traders get trapped here.
Clues:
A large candle pierces a liquidity pool.
Market immediately reverses, leaving a wick.
FVG or order block forms right after.
Phase 3: Expansion
Institutions push price rapidly in their true direction. This is the most profitable phase — the trend traders catch late if they don’t understand SMC.
Clues:
Strong BOS confirming new structure.
Continuous creation of higher highs/lows (bullish) or lower highs/lows (bearish).
Minor retracements to order blocks or FVGs.
Phase 4: Distribution
As price matures, institutions begin to offload their positions. This often looks like a slowdown in momentum or a range after a strong move — preparing for the next cycle.
6. SMC Entry Models: Precision with Institutional Logic
SMC traders use refined entry techniques to align with order flow and liquidity behavior.
1. Liquidity Grab + CHOCH
Wait for a liquidity sweep (stop hunt), followed by a structure shift in the opposite direction. This combination often signals a true reversal.
2. Order Block Retest
Once a BOS occurs, price frequently returns to the last valid order block. This provides a high-probability entry aligned with institutional footprints.
3. FVG Mitigation
After a sharp move, look for price to retrace partially into the imbalance zone before continuing.
4. Premium vs Discount Zones
Using a Fibonacci tool, smart money looks to sell in premium zones (above 50%) and buy in discount zones (below 50%) relative to the swing range.
These methods ensure entries occur in areas of high institutional interest rather than random mid-range levels.
7. Time and Session Theory in SMC
Institutions trade based on global liquidity timings:
London Open (7:00–9:00 GMT) – Initial liquidity sweep and false moves.
New York Open (12:00–14:00 GMT) – Real directional push; often the true institutional move.
Asia Session (00:00–05:00 GMT) – Accumulation and low-volatility phases.
Understanding session order flow allows traders to predict when manipulation or expansion phases are likely to occur.
8. Multi-Timeframe Confluence: The SMC Edge
SMC traders never analyze a single timeframe in isolation. Instead:
Higher timeframe (HTF) defines the directional bias (institutional order flow).
Lower timeframe (LTF) offers refined entries using liquidity sweeps and order blocks.
For example:
Daily or 4H chart may show bullish structure.
15M or 5M chart reveals liquidity grabs and CHOCH for precise entry points.
This top-down approach aligns retail participation with institutional timing.
9. Tools and Indicators Supporting SMC
Although SMC is primarily a price-action-based framework, a few tools can enhance precision:
Volume Profile or Delta Order Flow – Shows where large volume or aggressive buying/selling occurred.
Session Indicators – Visualize liquidity timings.
FVG and Order Block Indicators – Mark potential mitigation zones automatically.
However, the true power of SMC lies in naked chart reading — interpreting pure price movement through logic, not lagging signals.
10. Psychology Behind Smart Money Movements
Institutions exploit human behavior. Most retail traders operate on fear and greed — placing stops too close, chasing breakouts, or trading without patience. SMC reverses this psychology.
Smart Money:
Buys when others panic (fear).
Sells when others are euphoric (greed).
Creates fake moves to manipulate these emotions.
A trader adopting SMC must rewire their mindset: the goal is not to follow the crowd but to think like the institutions who move the crowd.
11. Common Mistakes in Applying SMC
Overdrawing zones – Not every candle is an order block. Quality > quantity.
Ignoring HTF bias – Taking entries against the dominant order flow reduces accuracy.
Trading every liquidity grab – Wait for confirmation via CHOCH or BOS.
No patience for mitigation – Smart money retraces; traders must wait for it.
Overleveraging – Even with SMC precision, risk management remains key.
12. Risk Management in SMC Trading
Institutions never risk randomly, and neither should retail traders.
Stop-Loss Placement – Beyond liquidity zones or invalidation points.
Risk-to-Reward (RR) – Minimum 1:3 setups are standard.
Partial Profits – Secure profits at intermediate FVGs or liquidity pools.
Trade Management – Move stops to breakeven after structural confirmation.
Risk control ensures survival even through inevitable false setups.
13. The Power of Institutional Order Flow in Modern Markets
With algorithmic and HFT systems dominating liquidity today, understanding order flow has become vital. Market moves are not random — they reflect large-scale positioning, hedging, and rebalancing activities.
Institutional order flow analysis allows traders to:
Detect accumulation zones before the trend.
Avoid fake breakouts.
Enter with optimal timing.
Predict where liquidity will be targeted next.
When combined with volume analysis or footprint charts, order flow provides near-institutional visibility into price intention.
14. Conclusion: Trading with the Smart Money
Smart Money Concepts and Institutional Order Flow represent the evolution of trading psychology — shifting focus from indicators to intent, from reaction to anticipation.
By mastering liquidity theory, order blocks, and market structure, traders can align with institutional footprints rather than fall victim to them. The market is not random; it’s a battlefield of liquidity, manipulation, and precision — and SMC is the map that reveals the hidden strategy of the elite.
Psychology of Trading & Risk ManagementIntroduction
Trading in financial markets is often perceived as a game of numbers, charts, and strategies. However, beyond the equations and algorithms lies the human mind — a complex network of emotions, biases, and impulses that can make or break a trader’s success. The psychology of trading is the invisible force that dictates how traders behave under pressure, how they respond to wins and losses, and how consistently they execute their trading plans.
Equally important is risk management, the art of protecting capital from emotional and financial ruin. While psychology controls how we make decisions, risk management defines how much we are willing to lose to stay in the game. Together, these two pillars form the foundation of long-term trading success.
1. The Psychological Nature of Trading
Trading is a mental battlefield. Every decision involves uncertainty — no matter how strong your analysis, the market can move against you. This uncertainty triggers emotional responses like fear, greed, hope, and regret, all of which can cloud judgment.
1.1 The Human Brain in Trading
Our brains are wired for survival, not speculation. In evolutionary terms, humans are risk-averse; losses hurt more than gains feel good. This is known as loss aversion, a concept from behavioral economics that explains why traders tend to cut winners early but let losers run — a psychological trap that often leads to losses.
1.2 Emotional Reactions and Decision-Making
Emotions are not inherently bad, but uncontrolled emotions in trading can cause impulsive actions. For instance:
Fear makes traders close positions too soon or avoid taking trades altogether.
Greed drives over-leveraging or chasing quick profits.
Hope keeps traders stuck in losing trades, waiting for the market to reverse.
Regret after a bad trade often leads to “revenge trading,” an emotional attempt to recover losses quickly.
Recognizing these emotions early and managing them effectively is key to developing a professional trading mindset.
2. Common Psychological Biases in Trading
Psychological biases are mental shortcuts that distort thinking. They operate subconsciously and can lead to repeated trading mistakes. Let’s explore the most common biases affecting traders:
2.1 Overconfidence Bias
After a few successful trades, many traders begin to believe they have “figured out” the market. This false sense of control leads to excessive risk-taking, ignoring stop-losses, and trading without confirmation. The market quickly humbles such traders.
2.2 Confirmation Bias
Traders often look for information that confirms their existing beliefs and ignore data that contradicts them. For instance, a bullish trader might only focus on positive news about a stock while dismissing warning signals.
2.3 Anchoring Bias
When traders rely too heavily on a single piece of information — like a past price level — they become “anchored” to it, even when market conditions have changed.
2.4 Recency Bias
Recent events tend to influence traders more than older ones. A trader who faced losses last week might become overly cautious, while one who made profits might turn reckless.
2.5 Herd Mentality
Many traders follow the crowd during sharp rallies or crashes, thinking “everyone can’t be wrong.” Unfortunately, by the time the herd reacts, the smart money is usually exiting.
2.6 Sunk Cost Fallacy
Traders often hold onto losing trades simply because they’ve already invested time or money, refusing to cut losses. This emotional attachment can destroy accounts over time.
By becoming aware of these biases, traders can detach emotion from execution and approach trading decisions with a rational mindset.
3. Building a Trader’s Mindset
To master the psychology of trading, one must think like a professional — not a gambler. Successful traders understand that consistent performance comes from discipline, patience, and process rather than luck or intuition.
3.1 Emotional Discipline
The best traders control emotions rather than suppress them. Emotional discipline means having a predefined trading plan and following it regardless of the market’s noise. This includes sticking to stop-losses, taking profits as planned, and avoiding impulsive entries.
3.2 Patience and Timing
Markets reward patience. Waiting for a high-probability setup rather than forcing trades prevents unnecessary losses. “No trade” is also a position — sometimes the best decision is to stay out.
3.3 Adaptability
Markets evolve, and strategies that worked yesterday may not work tomorrow. Traders must remain flexible and open to new information without being emotionally attached to past methods.
3.4 Self-Awareness
Understanding one’s emotional triggers, such as anxiety during volatility or overconfidence after wins, helps traders take preventive action. Journaling trades and emotions is an excellent way to track behavior patterns.
4. The Role of Risk Management
While psychology deals with mindset, risk management ensures survival. Even the best traders face losing streaks. Risk management is what keeps losses small enough to recover from.
4.1 The Core Principle: Capital Preservation
The first rule of trading isn’t to make money — it’s to protect your capital. Without capital, there’s no opportunity to trade tomorrow. Proper risk management ensures that one bad trade doesn’t wipe out weeks of gains.
4.2 Position Sizing
Position sizing is the process of determining how much of your capital to risk per trade. Most professional traders risk 1–2% of total capital per trade. This allows room for multiple trades and psychological comfort during losing streaks.
4.3 Stop-Loss and Take-Profit
A stop-loss defines where you’ll exit if the market goes against you. It acts as a shield against emotional decision-making. Similarly, take-profit levels ensure traders don’t let greed take over.
Together, they create a structured framework — you know your potential loss and reward before entering a trade.
4.4 Risk-to-Reward Ratio
Successful traders look for trades with a favorable risk-to-reward (R:R) ratio, typically 1:2 or higher. This means risking ₹100 to make ₹200 or more. Even if only 50% of trades succeed, the account can grow consistently.
4.5 Diversification
Putting all capital into one trade or asset increases risk exposure. Diversifying across instruments, time frames, or sectors reduces dependency on a single outcome.
4.6 Managing Leverage
Leverage amplifies both profits and losses. Beginners often misuse leverage out of greed, ignoring that it also multiplies risk. Responsible use of leverage, aligned with a strict risk management plan, ensures long-term survival.
5. Integrating Psychology and Risk Management
Trading psychology and risk management are not separate disciplines — they work together. Risk management provides structure, while psychology ensures adherence to that structure.
5.1 The Emotional Side of Risk
When traders risk too much, emotions like fear and panic dominate decision-making. Small, controlled risk per trade allows traders to think clearly and follow logic instead of emotion.
5.2 Accepting Losses as Part of the Game
Even the best strategies have losing trades. Accepting this truth mentally prevents frustration. A trader who can lose gracefully has already mastered half of trading psychology.
5.3 Consistency Over Perfection
Perfection doesn’t exist in trading. The goal is not to win every trade, but to make consistent, risk-adjusted returns. Psychology helps maintain this long-term vision during inevitable short-term setbacks.
6. Developing a Winning Trading Routine
To achieve mastery, traders must build habits that reinforce discipline and reduce emotional interference.
6.1 Pre-Market Preparation
A professional trader starts each day with preparation — analyzing overnight developments, marking key support/resistance levels, and reviewing trade setups. This builds confidence and clarity before execution.
6.2 Journaling and Reflection
Keeping a trading journal to record entries, exits, emotions, and results is one of the most powerful psychological tools. Over time, patterns emerge — such as taking trades due to boredom or skipping setups due to fear — allowing continuous improvement.
6.3 Regular Review and Feedback
Just as athletes review their performance, traders must analyze past trades objectively. Identify mistakes without self-judgment — the goal is to improve process, not punish oneself.
6.4 Maintaining Physical and Mental Health
Trading requires focus and mental stamina. Proper sleep, exercise, and nutrition improve cognitive performance. Meditation or mindfulness can help reduce stress and sharpen emotional control.
7. The Psychological Challenges of Different Market Phases
Market environments constantly change — trending, ranging, or volatile phases test different aspects of a trader’s psychology.
In bull markets, overconfidence and greed dominate; traders may over-leverage or ignore stop-losses.
In bear markets, fear takes over; traders hesitate to enter even valid setups.
In sideways markets, boredom leads to overtrading — a silent account killer.
Recognizing these psychological traps early helps traders adjust mindset according to market behavior.
8. The Professional Trader’s Mindset
Professional traders think differently from retail traders. Their mindset is shaped by discipline, patience, and objectivity.
8.1 Process Over Outcome
They focus on executing their process correctly, not on short-term profit or loss. Good trades can lose money, and bad trades can win — but only process-driven consistency ensures long-term success.
8.2 Emotional Detachment
Professionals treat each trade as one of thousands in a career. They don’t let one win inflate ego or one loss crush confidence.
8.3 Continuous Learning
Markets evolve with technology, macroeconomics, and sentiment. Professional traders stay curious, keep refining their strategies, and adapt without resistance.
9. Conclusion: Mastering the Mind, Protecting the Capital
The ultimate edge in trading doesn’t come from a secret indicator or algorithm — it comes from mastering oneself.
A trader who controls emotions, respects risk, and follows a structured process has already achieved what 90% of traders fail to: consistency.
Trading psychology teaches how to think, and risk management teaches how to survive. Together, they transform trading from an emotional gamble into a disciplined business.
Remember — the market rewards discipline, not emotion. Those who learn to manage risk and master their psychology will not only preserve capital but also thrive in the long run.

Technical Analysis & Price Action MasteryIntroduction
In the world of trading, where market movements can shift within seconds, the ability to interpret price charts and forecast future moves is one of the most valuable skills a trader can possess. Technical analysis and price action mastery together form the foundation of this skill — enabling traders to read market psychology, anticipate potential reversals, and make data-driven decisions with confidence.
Unlike fundamental analysis, which focuses on company performance or macroeconomic indicators, technical analysis studies the market itself — using price, volume, and chart patterns to identify opportunities. Price action, on the other hand, takes this a step deeper by interpreting raw price movements without relying on indicators.
Mastering these two disciplines allows a trader to see beyond noise and understand the true story behind every candle on a chart — the story of buyers and sellers in constant battle.
1. The Essence of Technical Analysis
Technical analysis is based on three key principles formulated decades ago by Charles Dow — the father of modern market analysis. These principles still guide traders today:
Price Discounts Everything
All available information — economic, political, or psychological — is already reflected in price. Therefore, price itself becomes the ultimate truth.
Price Moves in Trends
Markets rarely move randomly. They follow identifiable patterns — uptrends, downtrends, or sideways ranges — which tend to persist until a clear reversal occurs.
History Tends to Repeat Itself
Human emotions like fear and greed drive markets. Because human psychology is constant, the patterns formed by price movements often repeat over time.
These foundations make technical analysis a universal language for traders across asset classes — whether in stocks, forex, commodities, or cryptocurrencies.
2. Tools and Techniques of Technical Analysis
Technical analysis is a broad field that combines multiple tools and strategies. The most widely used include:
a) Chart Types
Line Charts: Simplest form; shows closing prices over time — good for spotting long-term trends.
Bar Charts: Display open, high, low, and close — providing more depth.
Candlestick Charts: The most popular; visually intuitive and used for price action analysis. Each candle tells a story of market sentiment.
b) Trend Analysis
Trendlines help traders visualize the direction of price.
Uptrend: Higher highs and higher lows.
Downtrend: Lower highs and lower lows.
Sideways Trend: Range-bound, showing indecision.
A disciplined trader uses trendlines and moving averages to confirm trend direction before entering trades.
c) Support and Resistance
Support is where demand prevents the price from falling further; resistance is where supply halts a price rise. These zones are psychological barriers where traders often enter or exit trades.
A breakout above resistance or breakdown below support often signals strong market momentum.
d) Volume Analysis
Volume validates price moves. A price rise accompanied by high volume signals strength, while a rise on low volume can suggest weakness. Volume indicators like On-Balance Volume (OBV) and Volume Profile help in understanding the participation behind a move.
e) Indicators and Oscillators
While price action traders may avoid heavy indicator use, technical analysts often rely on tools for additional confirmation:
Moving Averages (MA): Identify trend direction and momentum.
Relative Strength Index (RSI): Measures overbought or oversold conditions.
MACD (Moving Average Convergence Divergence): Reveals momentum shifts.
Bollinger Bands: Indicate volatility and potential breakouts.
The best traders, however, use indicators as supporting evidence, not as the sole basis for decisions.
3. Understanding Price Action: The Heart of Market Psychology
Price Action is the purest form of technical analysis. It strips away indicators and focuses solely on how price behaves — through candlesticks, patterns, and key levels.
Every price movement represents a tug-of-war between buyers (bulls) and sellers (bears). Understanding this battle helps traders anticipate what might happen next.
a) Candlestick Psychology
Each candlestick shows the open, high, low, and close of a period. But beyond that, it reveals the emotion behind the move:
Bullish Candles: Buyers in control; close higher than open.
Bearish Candles: Sellers dominate; close lower than open.
Doji Candles: Indecision; open and close nearly the same.
Learning to interpret candle shapes and their context gives traders deep insights into potential reversals or continuations.
b) Key Price Action Patterns
Certain formations consistently appear in charts and indicate likely market behavior:
Pin Bar (Hammer/Shooting Star):
Long wick shows rejection of higher or lower prices — strong reversal signal.
Engulfing Pattern:
A large candle completely engulfs the previous one, showing a strong shift in control.
Inside Bar:
Represents market consolidation before a breakout — often a continuation pattern.
Breakout and Retest:
After breaking a key level, price often returns to “retest” it before continuing — a favorite entry point for professionals.
c) Market Structure in Price Action
Understanding structure means recognizing how price transitions between phases:
Accumulation: Smart money builds positions quietly.
Markup: Strong uptrend begins as more participants join.
Distribution: Smart money exits, price slows down.
Markdown: Trend reverses; prices fall as selling accelerates.
This structure repeats across all markets and timeframes — mastering it is the foundation of consistent profitability.
4. Combining Technical Analysis and Price Action
While technical analysis provides tools, price action gives context. A professional trader combines both approaches for precision and confidence.
For instance:
Use support and resistance to mark key zones.
Wait for price action confirmation (like a pin bar or engulfing pattern).
Confirm with volume or trend indicators.
Execute trade with defined risk-reward and stop-loss placement.
This systematic blend helps traders avoid emotional decisions and react logically to market data.
5. Risk Management: The Core of Mastery
No matter how accurate the analysis, losses are part of trading. The real mastery lies not in avoiding losses but in managing risk effectively.
Key risk management principles include:
Position Sizing: Never risk more than 1–2% of total capital per trade.
Stop-Loss Orders: Always define the level at which a trade is invalidated.
Risk-Reward Ratio: Aim for at least 1:2 — potential profit should be double the risk.
Trade Journal: Track every trade to identify strengths and weaknesses.
Technical mastery without risk control leads to eventual losses. Consistent traders understand that preserving capital is their first priority.
6. Trading Psychology and Discipline
Beyond charts and setups, success in trading depends heavily on mindset. Technical knowledge may get you started, but psychological discipline keeps you profitable.
Patience: Wait for high-probability setups; avoid overtrading.
Emotional Control: Don’t let fear or greed influence decisions.
Adaptability: Markets evolve — stay flexible.
Confidence through Practice: Backtesting and journaling build trust in your strategy.
Mastering technical analysis is not about predicting every move — it’s about responding intelligently to what the market shows.
7. Multi-Timeframe Analysis
Professional traders analyze multiple timeframes to align short-term setups with long-term trends.
Higher Timeframes (Daily, Weekly): Identify major trend and key zones.
Lower Timeframes (15m, 1h): Find precise entries and exits.
This “top-down approach” ensures trades are aligned with the overall market direction, reducing false signals.
8. Volume Profile & Market Structure Integration
Advanced traders integrate Volume Profile and Market Structure with price action for higher accuracy:
Volume Profile: Shows traded volume at different price levels — highlighting areas of strong institutional interest.
High Volume Nodes (HVN): Areas of heavy activity; act as support/resistance.
Low Volume Nodes (LVN): Thin zones — price tends to move quickly through them.
Combining these with price action helps identify where the next big move might begin.
9. Building a Complete Trading System
To truly master technical analysis and price action, a trader must build a personal trading system — a set of rules combining analysis, execution, and psychology.
A robust system should include:
Market Selection: Which instruments to trade (stocks, forex, commodities).
Setup Criteria: Clear patterns or signals to look for.
Entry Triggers: What must happen before taking a trade.
Stop-Loss & Targets: Defined before entering.
Risk Management Rules: Position sizing and capital exposure.
Review Process: Post-trade analysis to refine performance.
Once developed, this system should be followed with discipline and consistency. The goal is to remove emotion and rely on process — just like a professional.
10. Continuous Learning and Adaptation
Markets are dynamic, and strategies that work today may not always work tomorrow. True mastery requires continuous learning — adapting to changing volatility, economic shifts, and new tools.
Traders can enhance skills by:
Reviewing trades regularly.
Studying institutional order flow concepts.
Learning about liquidity traps, false breakouts, and market manipulation.
Using simulation tools for backtesting.
The more you study the market, the clearer its rhythm becomes.
Conclusion
Technical Analysis and Price Action Mastery is not about memorizing patterns or predicting the future — it’s about understanding the underlying forces that move markets and positioning yourself in harmony with them.
Every candle, every level, and every breakout represents human emotion in action. When you learn to read this emotion through structure, context, and momentum, you begin to trade with confidence — not guesswork.
Ultimately, the mastery of technical analysis and price action is a journey of discipline, patience, and deep observation. It turns trading from speculation into a structured profession — where each decision is backed by logic, not luck.
In the hands of a patient, risk-aware trader, these tools become a map to consistent profitability and long-term success in financial markets.
Market Structure and Volume Profile Analysis1. What is Market Structure?
Market structure refers to the framework or layout of price movements on a chart. It’s the foundation of technical analysis and represents how price transitions between different phases — uptrends, downtrends, and consolidations.
In simple terms, market structure is the “story” that price tells. It reveals the ongoing battle between bulls and bears, showing where momentum shifts occur and where the next possible move could be.
1.1 The Core Elements of Market Structure
Swing Highs and Swing Lows:
These are the turning points of the market.
Swing High: A peak where price reverses downward.
Swing Low: A trough where price reverses upward.
Higher Highs (HH) and Higher Lows (HL):
These define an uptrend. Each new high surpasses the previous one, and each low remains above the previous low — signaling strength in buying pressure.
Lower Highs (LH) and Lower Lows (LL):
These define a downtrend. Each new low is lower than the previous one, and each high fails to reach the prior peak — showing selling dominance.
Range or Consolidation:
When price moves sideways between defined boundaries, it indicates equilibrium — a pause before a breakout or breakdown.
2. The Three Phases of Market Structure
Market structure often unfolds in three broad phases, forming a continuous cycle:
2.1 Accumulation Phase
Occurs after a prolonged downtrend.
Smart money (institutional traders) quietly accumulate positions at discounted prices.
Price typically moves sideways within a range with low volatility.
Volume gradually increases near the lower end of the range.
2.2 Markup Phase
Begins when price breaks above resistance of the accumulation range.
Market starts forming higher highs and higher lows.
Retail traders begin to notice the trend, and participation increases.
This phase is characterized by momentum, volume expansion, and trend continuation.
2.3 Distribution Phase
After an extended uptrend, large players begin to distribute (sell) their holdings to late entrants.
Price moves sideways again, showing exhaustion.
The structure gradually shifts from higher highs to equal or lower highs, signaling a potential reversal.
After distribution, the market transitions into a markdown phase, starting the next downtrend cycle — mirroring the opposite of the markup phase.
3. Identifying Market Structure Shifts
A Market Structure Shift (MSS) occurs when price action breaks the pattern of highs and lows, signaling a potential change in direction.
For instance:
In an uptrend, if price forms a lower low, it suggests weakening buyer momentum.
In a downtrend, a higher high can indicate the first sign of reversal.
Practical Example:
Suppose price is making consistent higher highs and higher lows. Suddenly, it fails to make a new high and breaks below the last higher low.
➡️ This indicates a break in structure (BOS) — a possible start of a bearish trend.
Such breaks are crucial for traders as they provide early reversal signals and opportunities to align trades with the new direction.
4. Understanding Volume Profile Analysis
While market structure shows where price has moved, Volume Profile reveals why it moved there — by showing the distribution of traded volume across price levels rather than time.
Unlike traditional volume bars that appear at the bottom of the chart, Volume Profile is plotted horizontally along the price axis. This gives a clear picture of where the most buying and selling activity occurred, and hence, where strong support and resistance zones exist.
5. Key Components of Volume Profile
A Volume Profile typically consists of several important zones and metrics:
5.1 Point of Control (POC)
The price level with the highest traded volume.
It represents the fairest price or value area equilibrium where both buyers and sellers agreed most.
Acts as a magnet for price; markets often revisit the POC after deviations.
5.2 Value Area (VA)
The range covering roughly 70% of the total traded volume.
Divided into:
Value Area High (VAH): The upper boundary.
Value Area Low (VAL): The lower boundary.
Price movement above or below this zone suggests overbought or oversold conditions relative to value.
5.3 Low-Volume Nodes (LVN)
Price levels with very low traded volume.
These act as rejection zones or imbalance areas, often leading to sharp moves when revisited.
5.4 High-Volume Nodes (HVN)
Clusters of heavy trading activity.
They act as strong support/resistance levels and areas where the market is likely to consolidate.
6. Interpreting Volume Profile for Trading
Volume Profile provides context for market structure by helping traders answer key questions:
Where is the market balanced (value area)?
Where did price previously face acceptance or rejection?
Is current price above or below value?
Here’s how to interpret common scenarios:
6.1 Price Above Value Area
The market is overextended to the upside.
If volume is weak, a mean reversion toward the POC is likely.
If volume increases, it may signal acceptance of higher value, suggesting trend continuation.
6.2 Price Below Value Area
Indicates potential undervaluation.
A bounce back toward value (POC) is possible if buyers step in.
6.3 Single Prints or Volume Gaps
These represent inefficient auction areas where price moved too fast.
Market tends to revisit and fill these gaps to balance the order flow later.
7. Combining Market Structure and Volume Profile
When used together, these tools create a powerful framework for understanding price behavior.
7.1 Structure Confirms Direction, Volume Confirms Value
Market Structure shows the direction of the trend.
Volume Profile confirms where the value is being built.
For instance:
If market structure forms higher highs and higher lows (uptrend) and Volume Profile shifts upward (value moving higher), this confirms a healthy bullish trend.
Conversely, if price rises but volume value areas shift lower, it signals weakness — a potential reversal.
7.2 Trading Strategy Example
Scenario: Market is in an uptrend with clear HH-HL structure.
Observation: Volume Profile shows strong buying at higher value areas and rejection below the POC.
Action:
Wait for a pullback to VAL or POC.
Enter long when price shows bullish confirmation (e.g., bullish engulfing candle).
Target the previous high or next HVN.
Place stop-loss below the recent swing low or LVN.
This combination ensures trades are aligned with trend structure and supported by volume confirmation, improving accuracy and reducing noise.
8. Practical Applications in Different Timeframes
Market Structure and Volume Profile are timeframe-independent, but interpretation differs across timeframes.
8.1 Intraday Trading
Focus on session volume profiles to identify daily value shifts.
Identify volume imbalances and trade breakouts or rejections around them.
Structure shifts (like BOS or CHoCH — Change of Character) often provide early intraday reversals.
8.2 Swing Trading
Use composite volume profiles covering several weeks/months to spot long-term value zones.
Identify accumulation and distribution phases.
Align trades with larger structural trends and institutional footprints.
8.3 Position Trading
Evaluate macro structure across weekly and monthly charts.
Focus on long-term POCs, high-volume nodes, and trend phases.
Use volume confirmation to identify areas of institutional accumulation or exit.
9. The Psychology Behind Market Structure and Volume
Every structure and volume zone represents trader psychology:
High Volume Areas: Consensus zones — comfort areas where both sides transact heavily.
Low Volume Areas: Fear or indecision zones — markets move quickly through them.
Structure Breaks: Emotional points where one side capitulates, shifting control.
Understanding this behavioral context helps traders not only react to price but anticipate moves before they happen.
10. Common Mistakes Traders Make
Ignoring Higher Timeframe Structure:
Trading against the dominant trend often leads to false entries.
Overusing Indicators Instead of Price Context:
Indicators lag — market structure gives real-time insights.
Misinterpreting Volume:
Not all high-volume zones mean strength; sometimes they signal distribution.
Neglecting Balance and Imbalance:
Failing to differentiate between a balanced (ranging) and imbalanced (trending) market causes confusion.
11. Key Tips for Effective Market Structure and Volume Analysis
Always start with higher timeframes to establish trend context.
Mark key POC, VAH, VAL, and swing levels.
Watch for Market Structure Shifts (BOS/CHoCH) near volume extremes.
Combine with liquidity concepts — price often reacts around previous highs/lows.
Use Volume Delta and Cumulative Volume Delta (CVD) for deeper order flow confirmation.
12. Real-World Example: A Typical Trade Setup
Context:
Nifty Futures on a 1-hour chart.
Market structure: Higher highs and higher lows (uptrend).
Volume Profile: Value area shifting upward, with a new POC forming higher.
Price retraces to the previous VAL, showing bullish rejection candles.
Trade Execution:
Entry: Long at VAL with confirmation candle.
Stop-Loss: Below swing low or LVN.
Target: Next HVN or previous high.
This approach aligns trend structure, volume value, and entry precision — the essence of professional trading logic.
Conclusion
Market Structure and Volume Profile Analysis form the backbone of modern price action trading. While market structure reveals the rhythm of price, Volume Profile uncovers the hidden story of participation and value.
By mastering both, traders can move beyond mere patterns and indicators to understand the true mechanics of market movement — where orders flow, where value builds, and where opportunity lies.
In essence, the market is a dynamic auction — and those who can read its structure and volume footprints gain a powerful edge. When used together with discipline and patience, these tools transform trading from guesswork into a structured, data-driven process.
Part 2 Ride The Big Moves Advantages of Option Trading
Option trading offers several benefits:
Leverage: Small premiums control large positions, magnifying potential returns.
Flexibility: Options can be used for income generation, speculation, or hedging.
Limited Risk for Buyers: The maximum loss for option buyers is limited to the premium paid.
Diverse Strategies: Traders can design complex setups for any market condition.
Portfolio Protection: Helps reduce downside risks without liquidating assets.
Because of these advantages, options have become integral to both institutional and retail trading strategies worldwide.

Part 1 Ride The Big Moves Role of Options in Hedging and Speculation
Options serve two primary purposes—hedging and speculation.
Hedging: Investors use options to protect their portfolios from adverse price movements. For example, a fund manager expecting a market downturn might buy put options on an index to limit potential losses.
Speculation: Traders use options to bet on the direction of price movements with relatively low capital compared to buying stocks outright. For instance, buying a call option allows participation in a stock’s upside potential without investing the full stock price.
Thus, options balance the needs of both conservative and aggressive market participants.

Part 2 Intraday Master ClassStrategies in Option Trading
Options allow traders to build strategies tailored to market views—bullish, bearish, or neutral.
Some popular strategies include:
Covered Call: Selling a call option while holding the underlying asset to earn extra income.
Protective Put: Buying a put option to hedge against possible losses in a stock you own.
Straddle: Buying both a call and a put with the same strike and expiry to profit from volatility.
Strangle: Similar to a straddle but with different strike prices for the call and put.
Iron Condor: Combining multiple options to profit from low volatility conditions.
Such strategies help traders control risk and maximize profits under different market scenarios.
