Advanced Option Strategies1. Understanding Advanced Option Strategies
Advanced option strategies involve combining multiple option positions in ways that optimize outcomes for specific market scenarios. Unlike straightforward buying or selling of single options, these strategies use combinations of calls, puts, or both, sometimes with different strike prices and expiration dates, to achieve nuanced profit/loss structures.
Traders use these strategies for several reasons:
Hedging: Protect existing portfolios against adverse price movements.
Speculation: Take calculated bets on the direction, volatility, or timing of price movements.
Income Generation: Earn premiums through selling options while controlling risk.
Volatility Trading: Profit from changes in implied volatility rather than price direction alone.
To successfully implement advanced option strategies, traders must have a deep understanding of option Greeks (Delta, Gamma, Theta, Vega, and Rho), as these metrics determine how option prices react to market movements.
2. Popular Advanced Option Strategies
2.1 Spreads
Spreads involve buying and selling options of the same type (calls or puts) on the same underlying asset but with different strike prices or expiration dates. Spreads can be broadly categorized into vertical spreads, horizontal spreads, and diagonal spreads.
2.1.1 Vertical Spreads
Vertical spreads involve buying and selling options with the same expiration date but different strike prices. They can be bullish or bearish.
Bull Call Spread: Buy a call at a lower strike and sell a call at a higher strike. This strategy limits both profit and loss and is profitable if the stock price rises moderately.
Bear Put Spread: Buy a put at a higher strike and sell a put at a lower strike. Profitable if the underlying declines moderately.
Example: A stock trading at $100:
Buy 1 call at $100 strike for $5
Sell 1 call at $110 strike for $2
Net cost: $3, Maximum gain: $7, Maximum loss: $3
2.1.2 Horizontal (Time) Spreads
Also called calendar spreads, horizontal spreads involve options with the same strike price but different expiration dates.
Long Calendar Spread: Buy a long-dated option and sell a short-dated option at the same strike. This strategy profits from low volatility and time decay.
2.1.3 Diagonal Spreads
A combination of vertical and horizontal spreads, diagonal spreads involve options with different strikes and expiration dates. These allow traders to take advantage of both time decay and directional moves.
2.2 Straddles and Strangles
These strategies are designed to profit from volatility, regardless of price direction.
2.2.1 Straddle
A straddle involves buying a call and a put at the same strike price and expiration date. Traders use straddles when they expect significant price movement but are unsure of the direction.
Pros: Unlimited profit potential if the underlying makes a large move.
Cons: High cost due to purchasing two options, risk of losing premium if the price remains stable.
2.2.2 Strangle
A strangle is similar to a straddle but uses out-of-the-money options. This makes it cheaper but requires a bigger price movement to be profitable.
Example: Stock at $100:
Buy 1 OTM call at $105
Buy 1 OTM put at $95
Outcome: Profitable if the stock moves significantly beyond $105 or below $95.
2.3 Butterfly Spreads
Butterfly spreads are limited-risk, limited-reward strategies that involve three strike prices. The most common is the call butterfly spread:
Buy 1 call at lower strike
Sell 2 calls at middle strike
Buy 1 call at higher strike
This strategy profits if the underlying price remains near the middle strike at expiration. Variants include put butterflies and iron butterflies.
Iron Butterfly: Combines a call and put spread, offering a strategy that benefits from low volatility with defined risk and reward.
2.4 Condors
Condor strategies, like butterflies, involve four strikes and aim to profit from a narrow price range.
Iron Condor: Sell an OTM put and OTM call, and buy further OTM put and call to limit risk.
Pros: Generates income in low volatility markets.
Cons: Limited profit, requires precise range predictions.
2.5 Ratio Spreads
Ratio spreads involve buying and selling options in unequal quantities. For instance, a trader might buy 1 call and sell 2 calls at a higher strike.
Pros: Can generate credit upfront, benefit from moderate moves.
Cons: Unlimited risk if the underlying moves sharply beyond the sold options.
2.6 Backspreads
Backspreads are the opposite of ratio spreads: they involve selling fewer options and buying more further out-of-the-money options. Traders use them when expecting large moves in the underlying asset.
Example: Sell 1 ATM call, buy 2 OTM calls.
Outcome: Profitable if the stock surges, limited risk if the stock drops slightly.
2.7 Synthetic Positions
Synthetic strategies replicate the payoff of holding the underlying asset using options:
Synthetic Long Stock: Buy a call and sell a put at the same strike and expiration.
Synthetic Short Stock: Sell a call and buy a put.
These strategies allow traders to gain exposure to price movements without actually holding the underlying stock.
2.8 Box Spread
A box spread is a combination of a bull call spread and a bear put spread, effectively creating a riskless arbitrage if executed correctly.
Profit/Loss: The spread’s value converges to the difference between strikes at expiration, usually used by professional traders for interest rate arbitrage.
3. Practical Considerations
Advanced option strategies require careful planning and risk management. Key considerations include:
Volatility: High implied volatility increases option premiums, affecting the profitability of debit vs. credit strategies.
Time Decay (Theta): Strategies like calendar spreads benefit from time decay, while long options lose value as expiration approaches.
Liquidity: Illiquid options can have wide bid-ask spreads, increasing execution costs.
Greeks Management: Understanding Delta, Gamma, Vega, and Theta is critical for predicting how positions respond to market changes.
Margin Requirements: Complex strategies, especially those with naked positions, may require significant margin.
4. Risk Management
Even advanced strategies carry risks. Techniques to manage risk include:
Diversification: Avoid putting all capital into a single underlying or strategy.
Stop-Loss Orders: Predefined exit points can prevent large losses.
Position Sizing: Limit exposure per trade to a fraction of the total portfolio.
Adjustments: Rolling or converting positions can mitigate adverse movements.
5. Advantages of Advanced Option Strategies
Flexibility: Traders can structure strategies for bullish, bearish, or neutral market conditions.
Defined Risk: Many strategies offer limited-risk exposure compared to outright positions in the underlying asset.
Profit from Volatility: Traders can earn profits even in sideways markets.
Portfolio Hedging: Protects against large moves without selling assets.
6. Challenges and Limitations
Complexity: Understanding multiple legs, Greeks, and expiration cycles can be challenging.
Execution Costs: Commissions and slippage can reduce profits.
Market Timing: Many strategies require precise timing and predictions.
Psychological Pressure: Multi-leg trades can be stressful and require constant monitoring.
7. Conclusion
Advanced option strategies offer traders sophisticated tools to manage risk, speculate on price movements, and generate income. From spreads and straddles to butterflies and synthetic positions, each strategy has unique characteristics suited for different market conditions. Success in these strategies requires a thorough understanding of option pricing, Greeks, volatility, and risk management techniques. While the rewards can be substantial, the complexity and risks demand disciplined execution, continual learning, and practice.
For traders willing to invest the time in mastering these strategies, options provide a versatile framework to navigate today’s dynamic markets and optimize portfolio performance.
Chart Patterns
Choose Mutual Funds Smartly1. Understanding Mutual Funds
Before choosing mutual funds, it’s important to understand what they are.
Definition: A mutual fund is a pooled investment vehicle where money from multiple investors is collected and invested in a diversified portfolio of stocks, bonds, or other securities by professional fund managers.
Types of Mutual Funds:
Equity Funds: Invest primarily in stocks; higher risk, higher potential returns.
Debt Funds: Invest in bonds, government securities, and fixed-income instruments; lower risk, moderate returns.
Hybrid Funds: Mix of equity and debt; balance of risk and return.
Sectoral/Thematic Funds: Focus on specific sectors (like technology, pharma) or themes (like ESG investing).
Index Funds & ETFs: Track market indices; passive management; low expense ratio.
Key takeaway: Understanding the type of fund helps align investments with your financial goals and risk tolerance.
2. Define Your Investment Goals
Choosing mutual funds smartly begins with clarity about your financial objectives.
Short-term Goals (0–3 years): Emergency fund, vacation, buying a car. Focus on low-risk funds like debt or liquid funds.
Medium-term Goals (3–7 years): House down payment, higher education. Consider hybrid or balanced funds.
Long-term Goals (7+ years): Retirement, wealth creation. Equity funds or index funds are suitable for long-term growth.
Tip: Always match the fund’s investment horizon with your financial goal horizon.
3. Assess Your Risk Appetite
Risk tolerance is crucial for fund selection.
High-risk appetite: Can tolerate volatility for higher returns → Equity or sectoral funds.
Moderate-risk appetite: Comfortable with some fluctuations → Balanced or hybrid funds.
Low-risk appetite: Prefer stable returns → Debt funds or government securities.
Important: Assess your risk not just financially but emotionally. Some investors panic during market dips.
4. Analyze Fund Performance
Past performance is not a guarantee, but it indicates the fund manager’s skill.
Look for consistency: Check returns over 1, 3, 5, and 10 years.
Compare with benchmarks: A good equity fund should outperform its benchmark index.
Evaluate risk-adjusted returns: Use metrics like Sharpe Ratio or Standard Deviation.
Example: A fund that gives 12% annual return with moderate volatility is preferable to a 15% return fund with extreme fluctuations.
5. Evaluate the Fund Manager
A skilled fund manager can make a huge difference in returns.
Experience matters: Check the manager’s track record over different market cycles.
Fund house reputation: Trust established fund houses with strong research capabilities.
Fund manager tenure: Frequent changes may indicate instability.
Pro tip: A strong fund manager is particularly important in actively managed equity and sectoral funds.
6. Expense Ratio and Fees
Costs directly reduce your returns.
Expense Ratio: Annual fee charged by the fund for managing your money. Lower is better.
Exit Load: Fee for selling before a certain period. Avoid high exit loads if you plan to stay flexible.
Tip: Compare expense ratios across similar funds. Even a 1% difference compounds over long-term investments.
7. Tax Implications
Mutual fund investments are subject to taxes. Understanding them helps in smart planning.
Equity Funds:
Short-term capital gains (STCG) – 15% if held ≤1 year
Long-term capital gains (LTCG) – 10% on gains above ₹1 lakh if held >1 year
Debt Funds:
STCG – Taxed as per income slab if held ≤3 years
LTCG – 20% with indexation if held >3 years
ELSS Funds:
Equity-linked savings scheme; 3-year lock-in; tax-saving benefit under Section 80C
Smart strategy: Use tax-efficient funds to reduce liabilities and increase net returns.
8. Diversification and Portfolio Strategy
Diversification reduces risk without sacrificing returns.
Across Asset Classes: Mix equity, debt, and hybrid funds.
Within Equity: Invest in large-cap, mid-cap, and small-cap funds.
Geographic Diversification: Some funds invest globally, reducing dependence on a single economy.
Example: A portfolio with 50% large-cap equity, 20% mid/small-cap, 20% debt, and 10% international equity balances growth and stability.
9. Check the Fund’s Investment Style
Understanding the fund’s style helps anticipate performance in different markets.
Equity Funds: Growth vs. Value, Large-cap vs. Mid-cap vs. Small-cap
Debt Funds: Duration strategy – short-term, medium-term, or long-term
Hybrid Funds: Equity-Debt ratio and rebalancing frequency
Pro tip: Align the style with market conditions and your risk tolerance.
10. Review Fund Ratings and Research Reports
Independent fund ratings provide a quick insight into quality.
Agencies: CRISIL, Morningstar, Value Research
Ratings reflect: Past performance, volatility, fund manager expertise, and consistency
Use as a guide: Not a sole decision factor
11. Monitor and Rebalance Regularly
Investing smartly doesn’t end at selection.
Track Performance: Review quarterly or semi-annually
Rebalance Portfolio: Adjust allocation as goals, risk tolerance, or market conditions change
Avoid Emotional Decisions: Don’t panic during market downturns; focus on long-term goals
12. SIPs vs. Lump Sum Investment
Systematic Investment Plans (SIPs) are generally safer for new investors.
SIP: Regular, smaller investments; reduces impact of market volatility via rupee-cost averaging
Lump Sum: One-time investment; better if markets are undervalued or for experienced investors
Smart choice: For beginners or long-term wealth creation, SIPs in equity or hybrid funds are ideal.
13. Beware of Marketing Hype
Avoid choosing funds based on:
Short-term performance or “hot” recommendations
Celebrity endorsements or ads
Peer pressure
Smart investors: Focus on fundamentals, not hype.
14. Tools to Aid Smart Selection
Several online platforms can help in research:
Morningstar, Value Research, Moneycontrol: Fund performance, ratings, comparison
Robo-advisors: Personalized fund recommendations based on risk profile and goals
Mutual fund apps: For SIPs, monitoring, and portfolio tracking
15. Case Study: Smart vs. Hasty Choice
Investor A: Chose fund based on last year’s 40% return. Fund dropped 25% next year → panic sold → loss realized.
Investor B: Analyzed 5-year performance, fund manager experience, risk-adjusted returns → consistent 12–15% returns → held long-term → wealth accumulation.
Lesson: Smart selection focuses on consistency, not short-term gains.
16. Final Checklist Before Investing
Define your goal and time horizon
Assess risk tolerance
Understand fund type and strategy
Analyze past performance and fund manager
Compare expense ratios and fees
Evaluate tax implications
Ensure diversification
Start with SIP or lump sum wisely
Monitor periodically and rebalance
Conclusion
Choosing mutual funds smartly is less about luck and more about informed decision-making. By understanding your goals, assessing risk, analyzing funds carefully, and maintaining discipline, investors can achieve consistent returns and long-term wealth creation. Smart investors don’t chase hype—they focus on research, planning, and patience. Mutual funds, when selected and managed intelligently, are a powerful tool for financial freedom.
Mastering Trade with Volume: The Hidden Key to Market Precision1. Understanding Volume in Trading
Volume refers to the total number of units traded for a particular asset within a given time period. It is commonly displayed as a histogram at the bottom of price charts. Volume tells traders how strong a price move is, and can provide insights into market psychology:
High volume often confirms trends or signals the climax of a move.
Low volume indicates weak conviction or a potential pause in the market.
Volume spikes can mark key turning points or breakout areas.
Volume is a measure of liquidity. Highly liquid markets with large volume enable smoother trading, while thin volume markets may show exaggerated price swings.
2. Why Volume Matters in Trading
Volume analysis is not just about counting trades—it’s about interpreting market intent. Here’s why it matters:
Confirming Trends: A rising price with increasing volume validates the uptrend. Conversely, a rising price on declining volume suggests weakening momentum.
Identifying Reversals: Sudden volume spikes during downtrends or uptrends often precede reversals.
Breakouts and Fakeouts: Breakouts from key support or resistance levels are more reliable when confirmed by volume.
Market Sentiment: Volume reveals the psychology of participants—buyers and sellers—showing whether a trend is driven by genuine interest or speculation.
3. Key Volume-Based Trading Tools
Several technical tools leverage volume to improve trading accuracy:
Volume Bars: The simplest tool, showing traded quantity per time period.
Volume Moving Average (VMA): Helps identify unusual volume relative to average.
On-Balance Volume (OBV): Cumulative measure of volume flow to detect buying/selling pressure.
Volume Price Trend (VPT): Combines price and volume to measure the strength of moves.
Volume Profile: Displays volume distribution across price levels to identify key zones of support/resistance.
Each of these tools offers traders a unique perspective on market dynamics and provides high-probability trade setups.
4. Volume and Market Structure
To trade effectively with volume, it’s critical to combine it with market structure analysis:
Support and Resistance: High volume near support/resistance confirms strong buying or selling interest.
Breakouts: Breakouts accompanied by volume spikes indicate genuine moves, while low-volume breakouts are likely false.
Trend Continuation: In an uptrend, higher volume on rallies and lower volume on pullbacks suggests a healthy trend.
Trend Exhaustion: When volume decreases at the end of a trend, it signals potential reversal or consolidation.
By aligning volume with price action and market structure, traders can filter noise and focus on high-confidence trades.
5. Volume Trading Strategies
Volume trading is highly adaptable across time frames, from intraday to long-term investing. Here are some proven strategies:
a) Volume Breakout Strategy
Identify key support or resistance levels.
Enter trades when price breaks out with above-average volume.
Use volume spikes to confirm the legitimacy of breakouts.
b) Volume Reversal Strategy
Look for extreme volume spikes after prolonged trends.
Price action with unusual volume may indicate trend exhaustion.
Combine with candlestick patterns or indicators for confirmation.
c) Volume Divergence Strategy
Compare volume trends with price trends.
If price rises but volume falls, it suggests weakening buying pressure.
Similarly, falling prices with declining volume may indicate sellers are losing control.
d) Volume-Weighted Average Price (VWAP) Strategy
VWAP shows average price based on volume and is widely used by institutional traders.
Traders can align entry and exit points with VWAP levels for better trade execution.
6. Psychological Insights from Volume
Volume analysis provides insights into market psychology:
Fear and Greed: Sudden surges in volume often reflect panic selling or aggressive buying.
Institutional Activity: Large volume spikes may indicate accumulation or distribution by institutional players.
Herd Behavior: Retail traders often follow price blindly, but volume analysis reveals true market participation.
Understanding these psychological cues helps traders anticipate future price action rather than reacting to it.
7. Combining Volume with Other Indicators
Volume works best in combination with other technical tools:
With Moving Averages: Confirms trend strength.
With RSI/Stochastic: Volume validates overbought/oversold conditions.
With Price Patterns: Breakouts, triangles, and flags are more reliable with volume confirmation.
With Market Depth: Combines volume data with order book analysis for precision.
8. Common Mistakes in Volume Trading
Even experienced traders make errors:
Ignoring Relative Volume: Not all volume is meaningful; compare with average levels.
Overtrading on Volume Spikes: Volume spikes without context can lead to false signals.
Neglecting Trend Context: Volume must be analyzed within the current market structure.
Misreading Low-Liquidity Markets: Thinly traded instruments may produce misleading volume patterns.
Avoiding these mistakes ensures that volume becomes a powerful ally, not a misleading signal.
9. Practical Examples
Breakout Example: A stock breaks resistance at ₹150 with 3x average volume. Traders who wait for volume confirmation are more likely to profit.
Reversal Example: A prolonged downtrend shows a sudden surge in buying volume at ₹100. This often signals the bottoming phase.
Divergence Example: Nifty rises to new highs, but OBV falls. This warns of a weakening rally, prompting traders to tighten stops or take profits.
10. Conclusion
Volume is often called the “lifeblood of trading” for a reason. It tells the story behind the price, revealing the strength, conviction, and psychology of market participants. Traders who master volume analysis gain a critical edge—identifying high-probability trades, confirming trends, and spotting reversals early. By combining volume with price action, market structure, and other technical indicators, traders can transform their approach from guesswork to precision trading.
Ultimately, volume is not just a number—it is the pulse of the market, and learning to read it effectively is one of the most powerful skills a trader can acquire.
Consumption Trends in the Indian Trading Market1. Introduction
Consumption trends refer to the patterns and behaviors exhibited by consumers in terms of purchasing goods and services over time. In India, with a population exceeding 1.4 billion, consumption plays a pivotal role in driving economic growth. Retail, e-commerce, FMCG (Fast-Moving Consumer Goods), luxury goods, and digital services are some of the major sectors influenced by consumer spending patterns.
In recent years, consumption trends in India have shifted due to urbanization, rising disposable incomes, digital penetration, and changing lifestyles. Analyzing these trends provides valuable insights for traders and businesses to align their strategies with market demands.
2. Factors Driving Consumption Trends
Several macro and microeconomic factors influence consumption in India:
2.1 Rising Disposable Income
India’s growing middle class has more disposable income than ever before. With steady economic growth and higher employment rates, consumers are spending more on discretionary items like electronics, fashion, entertainment, and travel.
2.2 Urbanization
Rapid urbanization has created a surge in modern retail consumption. Tier-1 and Tier-2 cities have witnessed increased demand for branded products, premium services, and online retail platforms.
2.3 Digital Transformation
Digital technology has reshaped consumer behavior in India. E-commerce platforms such as Amazon, Flipkart, and Myntra have transformed the way people shop. Digital payments, mobile apps, and online promotions have contributed to convenience and impulse buying.
2.4 Lifestyle Changes
The younger generation, especially millennials and Gen Z, prioritize experiences over material goods. Their consumption patterns lean towards travel, wellness, fitness, and technology-driven products.
2.5 Government Policies
Government initiatives like Digital India, Make in India, and financial inclusion programs have increased accessibility to products and services across urban and rural regions, boosting overall consumption.
3. Consumption Patterns by Sector
3.1 FMCG (Fast-Moving Consumer Goods)
FMCG remains a cornerstone of Indian consumption. Staples like food, beverages, personal care products, and household goods dominate spending. Recent trends show a shift toward organic, health-oriented, and premium products.
Rising Health Awareness: Consumers prefer products with natural ingredients and low sugar/fat content.
E-commerce Impact: Online grocery shopping has surged, with platforms like BigBasket and Grofers leading the way.
3.2 E-commerce and Digital Consumption
E-commerce has revolutionized the Indian market, making products accessible beyond urban areas.
Growth of Mobile Commerce: Mobile apps drive more than 70% of e-commerce transactions.
Discount Culture: Festive sales and heavy discounts influence consumer behavior, leading to higher transaction volumes.
Niche Segments: Fashion, electronics, beauty products, and digital content subscriptions are seeing high online demand.
3.3 Luxury and Lifestyle Products
Luxury goods consumption has grown steadily among urban Indians, reflecting aspirations and status symbols.
Premium Brands: Demand for high-end automobiles, watches, and fashion brands is rising.
Experiential Consumption: People prefer experiences like fine dining, vacations, and wellness retreats over material possessions.
3.4 Technology and Electronics
Digital adoption drives significant consumption in electronics, including smartphones, laptops, and smart home devices.
Affordability: Competitive pricing of smartphones and appliances has widened consumer reach.
Integration with Lifestyle: Smart devices now complement entertainment, work, and fitness trends.
3.5 Rural Consumption
Rural India represents a massive consumption base, accounting for nearly half of total consumer spending.
Staple Goods: Food, FMCG, and agricultural products dominate.
Emerging Demand: Appliances, motorcycles, mobile phones, and digital services are becoming popular as connectivity improves.
4. Emerging Consumption Trends
4.1 Sustainability and Eco-consciousness
Consumers increasingly prefer sustainable and eco-friendly products. Brands focusing on packaging, renewable resources, and green initiatives gain trust.
4.2 Subscription-Based Models
Subscription services for streaming, meal kits, and curated products are gaining traction. Consumers appreciate convenience and customization.
4.3 Omni-channel Retail
Consumers expect a seamless experience across offline and online channels. Retailers offering click-and-collect, virtual try-ons, and personalized services are benefiting.
4.4 Experiential Spending
Experience-driven consumption, including travel, fitness, and leisure, is surpassing traditional material spending, especially among millennials.
4.5 Influence of Social Media
Social media platforms heavily influence purchasing decisions. Influencer marketing, short video apps, and online reviews have become key drivers of consumption.
5. Impact on Indian Trading Market
5.1 Growth of Retail and E-commerce
The retail sector is witnessing unprecedented growth due to changing consumption trends. Organized retail chains, supermarkets, and online platforms are expanding rapidly.
5.2 Increased Investor Interest
High consumption fuels business revenues, making sectors like FMCG, e-commerce, and technology attractive for investors. Stock performance of companies catering to changing consumer behavior is closely tied to these trends.
5.3 Supply Chain Evolution
Consumption trends are reshaping supply chain strategies. Efficient logistics, warehouse networks, and last-mile delivery are critical to meet demand.
5.4 Dynamic Pricing and Promotions
Companies adopt dynamic pricing and targeted promotions to influence buying patterns, particularly in e-commerce and FMCG sectors.
5.5 Product Innovation
Consumer expectations push companies to innovate continuously, focusing on personalization, convenience, and sustainability.
6. Challenges and Risks
Despite robust growth, consumption trends face challenges:
Economic Uncertainty: Inflation, interest rates, and global economic conditions can impact consumer spending.
Rural Penetration Barriers: Limited infrastructure and financial literacy may restrict rural consumption growth.
Regulatory Hurdles: Taxation and compliance requirements can affect pricing and margins.
Changing Preferences: Rapid shifts in consumer preferences may lead to inventory and investment risks for businesses.
7. Future Outlook
India’s consumption trends indicate a promising future for traders, investors, and companies. Key predictions include:
Rising Digital Consumption: Continued growth in e-commerce and online services.
Premiumization: Increased demand for premium, lifestyle, and health-oriented products.
Rural Market Expansion: Improved infrastructure and digital access will unlock rural consumption potential.
Sustainable Consumption: Brands focusing on eco-friendly products will capture long-term consumer loyalty.
Technology Integration: AI-driven personalization, AR/VR retail experiences, and smart devices will reshape buying patterns.
Overall, India’s consumption-driven market will remain a critical engine of economic growth, innovation, and global trading opportunities. Businesses and investors who anticipate these trends and adapt accordingly are likely to gain a significant competitive advantage.
8. Conclusion
The Indian trading market is evolving rapidly, with consumption trends at its core. From urban tech-savvy buyers to rural emerging consumers, the diversity of preferences demands that traders and companies remain agile. Understanding these trends enables businesses to innovate, investors to strategize, and policymakers to facilitate sustainable growth.
India’s consumption story is one of opportunity, fueled by demographic advantage, technological adoption, and a culture of aspiration. The next decade promises to redefine how goods and services are traded, consumed, and valued across the subcontinent.

Supercycle 2025: Metals, Energy, and PricesIntroduction
The global commodities market is experiencing a significant transformation in 2025, characterized by a resurgence in metal and energy prices. This phenomenon, often referred to as a "commodity supercycle," is driven by a confluence of factors including the energy transition, geopolitical tensions, and structural supply constraints. Understanding the dynamics of this supercycle is crucial for investors, policymakers, and industry stakeholders.
1. Understanding the Commodity Supercycle
Definition and Historical Context
A commodity supercycle refers to an extended period during which commodity prices remain well above their long-term trend, typically lasting several years or even decades. Historically, such supercycles have been driven by factors like industrialization, technological advancements, and shifts in global demand.
Current Drivers
In 2025, the supercycle is primarily fueled by:
Energy Transition: The global shift towards renewable energy sources is increasing demand for metals like copper, lithium, and nickel.
Geopolitical Instability: Conflicts and trade tensions are disrupting supply chains, leading to price volatility.
Supply Constraints: Limited investments in mining and energy infrastructure over the past decade are leading to supply shortages.
2. Metals: The Backbone of the Supercycle
Copper
Copper is at the forefront of the current supercycle. Its demand is surging due to its essential role in electric vehicles (EVs), renewable energy systems, and grid infrastructure. In 2025, copper prices have climbed to near-record levels, driven by a complex interplay of surging demand and significant supply disruptions. Analysts project a 30% increase in copper demand by 2040.
Lithium and Nickel
Lithium and nickel are critical for battery production. The rise of EVs and energy storage solutions is propelling their demand. However, supply is struggling to keep pace, leading to price increases.
Gold
Gold has emerged as a safe haven amid economic uncertainties. In October 2025, gold prices surpassed $4,000 per ounce for the first time, marking a 53% increase year-to-date. This rally is attributed to factors like anticipated interest rate cuts, a weak U.S. dollar, and geopolitical instability.
3. Energy: The Fuel of the Supercycle
Oil
The energy sector is witnessing a paradox. While global oil production is at record highs, oversupply concerns are leading to price declines. The U.S. Energy Information Administration (EIA) forecasts U.S. oil production to reach 13.53 million barrels per day in 2025, yet prices are expected to average $65 per barrel, down about 15% from the previous year.
Natural Gas
Natural gas prices are experiencing volatility due to fluctuating demand and supply disruptions. The transition to cleaner energy sources is also impacting its long-term outlook.
Renewable Energy
Investments in renewable energy infrastructure are driving demand for materials like steel, aluminum, and rare earth elements. The shift towards a materials-intensive energy system is reshaping global commodity markets.
4. Implications for Investors and Policymakers
Investment Opportunities
Metals and Mining Stocks: Companies like Tata Steel and Hindalco are benefiting from rising metal prices and increased demand.
Energy Infrastructure: Investments in renewable energy projects and related infrastructure are poised for growth.
Commodity ETFs: Funds like SPDR Gold Shares (GLD) and United States Oil Fund (USO) offer exposure to commodity markets.
Policy Considerations
Supply Chain Resilience: Policymakers must address vulnerabilities in commodity supply chains, especially concerning critical minerals.
Sustainable Mining Practices: Encouraging environmentally responsible mining can mitigate the ecological impact of increased extraction activities.
Energy Transition Strategies: Developing comprehensive plans for transitioning to renewable energy can ensure energy security and economic stability.
5. Conclusion
The commodity supercycle of 2025 presents both challenges and opportunities. While rising prices can benefit producers and investors, they also underscore the need for strategic planning and investment in sustainable practices. As the world continues its transition towards cleaner energy, the dynamics of commodity markets will play a pivotal role in shaping the global economic landscape.

Algorithmic AI Trading SystemIntroduction
Algorithmic AI trading systems are transforming the financial markets by combining the power of algorithms, artificial intelligence (AI), and big data to make trading more efficient, precise, and profitable. Traditional trading relied heavily on human intuition and manual execution, which was slower and prone to errors. In contrast, AI-powered trading systems leverage complex mathematical models, machine learning, and real-time data analysis to execute trades automatically, often outperforming human traders in speed and accuracy.
The integration of AI in algorithmic trading has become crucial for institutions, hedge funds, and retail traders seeking competitive advantages in highly volatile and liquid markets.
1. Understanding Algorithmic Trading
Algorithmic trading, often called algo-trading, uses predefined rules and mathematical models to execute trades automatically. These rules are designed based on market data such as price, volume, and timing. The main features include:
Speed: Algorithms can execute orders in milliseconds, capitalizing on short-lived market opportunities.
Accuracy: Reduces human errors in execution, ensuring trades occur exactly as planned.
Cost Efficiency: Automation lowers operational costs and reduces slippage in high-frequency trades.
Types of Algorithmic Trading Strategies
Trend-Following Algorithms: Identify and follow market trends to generate profits.
Mean Reversion Algorithms: Trade based on the assumption that prices will return to their historical average.
Statistical Arbitrage: Exploit price inefficiencies between correlated assets.
High-Frequency Trading (HFT): Leverages milliseconds-level execution speed for arbitrage or market making.
While these strategies are effective, AI enhances them by incorporating machine learning and predictive analytics to adapt to changing market conditions.
2. Role of Artificial Intelligence in Trading
Artificial intelligence brings adaptability, predictive power, and self-learning capabilities to algorithmic trading. AI in trading generally involves:
Machine Learning (ML): Algorithms learn from historical and real-time data to predict future price movements.
Natural Language Processing (NLP): Analyzes news, earnings reports, and social media sentiment to inform trades.
Deep Learning: Identifies complex non-linear patterns in market data that traditional models might miss.
AI Applications in Trading
Predictive Analytics: AI models forecast asset price movements and volatility based on historical data.
Sentiment Analysis: NLP models assess market sentiment from financial news, tweets, or analyst reports.
Risk Management: AI continuously monitors market exposure, portfolio risks, and liquidity constraints.
Trade Execution Optimization: Machine learning adjusts order execution to minimize slippage and transaction costs.
By combining AI with algorithms, trading systems move from rule-based automation to adaptive intelligence, enabling smarter and faster decision-making.
3. Architecture of an AI Trading System
A robust AI trading system typically consists of four key components:
Data Acquisition Layer:
Gathers structured (price, volume) and unstructured data (news, social media).
Sources include market feeds, APIs, historical databases, and alternative datasets like satellite imagery or economic indicators.
Data Processing & Feature Engineering:
Cleans, normalizes, and transforms raw data into meaningful inputs for AI models.
Feature engineering is critical to highlight relevant signals for price prediction.
AI Modeling Layer:
Machine learning models such as Random Forests, Gradient Boosting, or LSTM neural networks predict price movements or detect anomalies.
Reinforcement learning can be used to optimize trading strategies over time based on rewards and penalties.
Execution & Monitoring Layer:
Converts AI-generated signals into actionable trades using low-latency order execution engines.
Continuously monitors market conditions, system performance, and risk exposures.
4. Benefits of Algorithmic AI Trading
Speed and Efficiency: AI systems process vast datasets and execute trades far faster than humans.
24/7 Market Monitoring: AI can continuously monitor multiple markets without fatigue.
Data-Driven Decisions: Eliminates emotional bias from trading, relying on objective, statistical analysis.
Adaptive Strategies: Machine learning allows strategies to evolve with changing market dynamics.
Risk Minimization: Predictive models and real-time monitoring help prevent major losses.
5. Challenges and Risks
Despite its advantages, algorithmic AI trading comes with risks:
Overfitting: AI models trained on historical data may fail in live market conditions.
Market Impact: High-frequency trades may inadvertently affect market prices.
Data Quality Issues: Inaccurate or incomplete data can lead to wrong trading decisions.
Cybersecurity Risks: AI systems are vulnerable to hacking or manipulation.
Regulatory Compliance: Algorithmic and AI-driven trades are under strict regulatory scrutiny in many markets.
Traders must balance innovation with caution, ensuring robust risk management and compliance protocols.
6. Popular AI Trading Strategies
Reinforcement Learning for Portfolio Optimization:
AI agents learn to maximize portfolio returns while minimizing risk using reward-based learning.
Sentiment-Based Trading:
NLP algorithms analyze news and social media sentiment to predict price trends.
Algorithmic Arbitrage:
AI identifies temporary price discrepancies across exchanges for profit.
Predictive Modeling for Volatility:
AI forecasts market volatility, enabling traders to hedge positions effectively.
Hybrid Models:
Combines technical indicators, fundamental data, and sentiment analysis for holistic decision-making.
7. Case Studies and Real-World Applications
Hedge Funds and Investment Banks:
Firms like Renaissance Technologies and Goldman Sachs use AI-driven strategies to outperform traditional market approaches.
Retail Trading Platforms:
AI-powered trading bots for retail investors provide automated signal generation and trade execution.
Cryptocurrency Markets:
AI systems exploit the high volatility of crypto markets to generate consistent returns.
Alternative Data Utilization:
AI can analyze satellite imagery, weather data, or shipping patterns to predict commodity prices or stock movements.
8. The Future of AI in Trading
The AI trading landscape is evolving rapidly:
Explainable AI: Traders demand transparency in AI-driven decisions to trust automated systems.
Cross-Asset Integration: AI systems will increasingly manage multi-asset portfolios, including stocks, crypto, and derivatives.
Quantum Computing: May accelerate AI algorithms, enabling near-instantaneous market analysis.
Regulatory Evolution: Regulators are developing frameworks to monitor and manage AI-driven trading risks.
The future points toward AI-driven systems that are smarter, faster, more adaptive, and capable of operating across global markets seamlessly.
Conclusion
Algorithmic AI trading systems represent a paradigm shift in financial markets. By combining computational speed, adaptive intelligence, and vast data processing capabilities, these systems are setting new benchmarks for efficiency, profitability, and risk management. While challenges like overfitting, cybersecurity risks, and regulatory hurdles exist, the potential benefits for investors and institutions are immense.
AI in trading is not just about automation; it is about building systems that think, learn, and adapt—ushering in a new era where data-driven intelligence shapes the future of finance.

AI Trading Profits: Unlocking the Future of Smart Market Gains1. Understanding AI Trading
AI trading refers to the use of machine learning, natural language processing, and advanced algorithms to make trading decisions. Unlike traditional trading, which relies on human intuition, AI trading analyzes massive datasets in real-time, identifies patterns, and executes trades with precision. AI systems are capable of learning from historical data, adapting to changing market conditions, and continuously improving their performance.
Key components include:
Data acquisition: Collecting historical and real-time financial data.
Pattern recognition: Using machine learning to identify profitable trends.
Execution algorithms: Automatically placing trades based on AI predictions.
Risk management: Monitoring positions and adjusting strategies dynamically.
2. Sources of AI Trading Profits
AI trading profits come from multiple sources, often simultaneously:
a. Arbitrage Opportunities
AI can identify price discrepancies across markets faster than humans. For example, slight differences in currency pairs or stock prices between exchanges can be exploited within milliseconds, yielding small but highly consistent profits.
b. Predictive Market Analysis
AI models can forecast price movements using historical data, news sentiment, macroeconomic indicators, and social media trends. By predicting short-term or long-term trends, traders can enter and exit positions at optimal moments.
c. High-Frequency Trading (HFT)
AI enables high-frequency trading, executing thousands of trades per second. This leverages micro-movements in asset prices to generate cumulative profits over time.
d. Sentiment Analysis
Modern AI models analyze news articles, social media, and financial reports to gauge market sentiment. Positive or negative sentiment can trigger AI-based trading strategies that anticipate market reactions.
3. AI Trading Strategies That Drive Profits
AI trading profits are heavily influenced by the strategies employed:
Trend-Following Algorithms: AI detects upward or downward price trends and automatically adjusts positions.
Mean Reversion Models: Identifying when an asset is overbought or oversold and betting on a return to the mean.
Reinforcement Learning Systems: AI learns optimal trading actions through trial-and-error simulations.
Neural Network Predictive Models: Deep learning models analyze complex data patterns to predict future price movements.
Portfolio Optimization Algorithms: AI balances risk and return by continuously reallocating assets across diverse instruments.
4. Advantages of AI in Trading Profits
Speed and Accuracy: AI can analyze vast data in milliseconds, far faster than human traders.
Emotionless Trading: AI removes emotional biases that often lead to trading mistakes.
24/7 Market Monitoring: AI can operate continuously in global markets.
Adaptive Learning: Machine learning models improve over time, refining strategies.
Scalability: AI can simultaneously trade multiple markets and instruments.
5. Challenges and Risks in AI Trading
While AI offers significant profit potential, risks remain:
Data Quality Issues: Poor or biased data can lead to incorrect predictions.
Overfitting: AI models may perform well in simulations but fail in live markets.
Market Volatility: Sudden market shocks can overwhelm AI systems.
Regulatory Constraints: Certain jurisdictions impose rules on automated trading.
Ethical Concerns: AI-driven market manipulation risks exist if not properly monitored.
6. Case Studies of AI Trading Profits
Hedge Funds: Quantitative hedge funds like Renaissance Technologies and Two Sigma generate billions annually using AI-driven strategies.
Retail Traders: Platforms using AI-assisted trading tools allow retail traders to capture profitable signals.
Cryptocurrency Markets: AI is used extensively in crypto trading to exploit high volatility and sentiment-driven price swings.
7. Future Outlook of AI Trading Profits
The future of AI trading promises even greater profitability as technology advances:
Integration of Alternative Data: Satellite imagery, social trends, and IoT data will refine AI predictions.
AI-Driven Risk Management: Advanced AI models will optimize risk-adjusted returns.
Global Market Connectivity: AI will seamlessly trade across borders, currencies, and asset classes.
Hybrid Human-AI Models: Traders will increasingly use AI as an assistant, combining human intuition with machine precision.
Conclusion
AI trading profits represent a paradigm shift in financial markets. By leveraging speed, accuracy, predictive capabilities, and advanced strategies, AI transforms how profits are generated. However, success depends on high-quality data, robust algorithms, and continuous monitoring. For traders, institutions, and investors, AI is no longer optional—it is the key to achieving consistent, scalable, and intelligent market gains.
Investing in ESG: Shaping Profits with PurposeUnderstanding ESG Investing
ESG investing refers to the integration of three core dimensions into investment analysis and decision-making: Environmental, Social, and Governance factors. Each element provides a lens through which investors assess companies, industries, and projects, ensuring that investments contribute positively to society while also delivering sustainable financial returns.
Environmental Factors (E): This aspect evaluates how companies interact with the natural environment. Key considerations include carbon footprint, climate change mitigation, energy efficiency, resource usage, waste management, pollution control, and biodiversity conservation. Investors look for companies that proactively reduce their environmental impact, implement sustainable practices, and innovate in green technologies.
Social Factors (S): The social dimension examines how businesses manage relationships with employees, suppliers, customers, and the broader community. It encompasses labor standards, workplace diversity and inclusion, human rights, consumer protection, community engagement, and social responsibility initiatives. Companies that prioritize positive social outcomes are often seen as more resilient and trusted by stakeholders.
Governance Factors (G): Governance addresses the internal structure, policies, and practices that guide corporate behavior. This includes board composition, executive compensation, shareholder rights, transparency, ethics, anti-corruption measures, and regulatory compliance. Strong governance frameworks reduce risks associated with mismanagement, fraud, and reputational damage.
By integrating ESG factors into investment strategies, investors seek not only financial returns but also long-term sustainability, resilience, and alignment with ethical and social values.
The Growth of ESG Investing
Over the past decade, ESG investing has witnessed exponential growth. According to industry reports, global ESG assets under management (AUM) surpassed $35 trillion in 2025, reflecting a steady increase in investor demand. Several factors have driven this surge:
Global Awareness of Climate Change: Rising concerns about global warming, extreme weather events, and environmental degradation have heightened the need for sustainable investments.
Regulatory Support: Governments and regulatory bodies worldwide have introduced policies encouraging ESG disclosure and responsible investing. The European Union’s Sustainable Finance Disclosure Regulation (SFDR) and similar frameworks in the US and Asia have created transparency and accountability for ESG practices.
Investor Demand for Ethical Choices: Millennials and Gen Z, who are becoming a dominant force in wealth accumulation, prioritize sustainability and social responsibility. Their investment choices reflect a desire to create positive impact while generating returns.
Financial Performance and Risk Mitigation: Numerous studies suggest that ESG-focused companies often outperform their peers in the long term, demonstrating lower volatility, reduced risk exposure, and enhanced operational efficiency.
ESG Investment Strategies
Investors have multiple approaches to incorporating ESG principles into their portfolios. These strategies range from selective exclusion to proactive engagement:
Negative Screening: This involves excluding companies or industries that fail to meet ESG criteria. Commonly excluded sectors include tobacco, firearms, fossil fuels, and companies with poor labor practices.
Positive Screening: Investors identify companies that excel in ESG performance, emphasizing leaders in environmental stewardship, social impact, or governance practices.
Thematic Investing: This strategy focuses on specific ESG-related themes, such as renewable energy, clean technology, gender diversity, or affordable housing.
Impact Investing: Beyond financial returns, impact investing actively seeks measurable social or environmental impact. Examples include financing green infrastructure projects or supporting social enterprises.
ESG Integration: Here, ESG factors are incorporated into traditional financial analysis to assess risk and return profiles comprehensively. This approach recognizes that ESG risks can directly affect financial performance.
Active Ownership & Engagement: Investors engage with company management to encourage ESG improvements. Shareholder activism and proxy voting can influence corporate policies toward sustainability.
Benefits of ESG Investing
Long-Term Financial Performance: Companies with strong ESG practices often demonstrate operational efficiency, innovation, and risk management, leading to sustainable financial growth.
Risk Mitigation: ESG integration reduces exposure to regulatory, environmental, and reputational risks. For example, companies with robust governance frameworks are less likely to face scandals or legal penalties.
Positive Societal Impact: ESG investing aligns capital with societal goals, supporting climate action, social equality, and ethical business practices.
Attracting Capital: Companies with strong ESG ratings may attract long-term institutional investors, resulting in increased demand for shares and potentially higher valuations.
Regulatory Compliance: ESG-focused companies are better positioned to navigate evolving regulations related to environmental protection, labor laws, and corporate governance.
Challenges in ESG Investing
Despite its growth and benefits, ESG investing also faces challenges:
Data Quality and Standardization: ESG data is often inconsistent, unverified, or based on self-reported metrics. This makes comparison across companies and industries difficult.
Greenwashing Risks: Some companies exaggerate ESG achievements for marketing purposes without making substantial changes, misleading investors.
Performance Trade-offs: Critics argue that prioritizing ESG criteria may limit returns, particularly in sectors where sustainable practices are costly or less developed.
Dynamic Standards: ESG definitions and metrics are evolving, making it challenging for investors to establish clear and consistent benchmarks.
Complexity in Measuring Impact: Quantifying social and environmental outcomes can be subjective, requiring robust evaluation methods.
Global ESG Trends
The global ESG landscape continues to evolve, shaped by technological innovation, regulatory frameworks, and investor priorities:
Green Bonds and Sustainable Finance: Issuance of green bonds and sustainability-linked loans has surged, providing capital for environmentally beneficial projects.
Corporate ESG Reporting: Increasingly, companies disclose ESG metrics in annual reports and sustainability reports, often following frameworks like GRI, SASB, and TCFD.
Integration of AI and Big Data: Technology is enabling investors to analyze ESG data at scale, improving decision-making and transparency.
Cross-Border ESG Investments: Investors are increasingly seeking international opportunities in emerging markets where ESG adoption is accelerating.
Climate Risk Assessment: Physical and transition risks related to climate change are now considered integral to investment decisions, influencing asset allocation and portfolio strategies.
Practical Steps for Investors
For those looking to embrace ESG investing, several practical steps can help:
Define ESG Priorities: Determine which ESG factors align with personal or institutional values, whether environmental protection, social equity, or corporate governance.
Select Appropriate Investment Vehicles: ESG investments are available across stocks, mutual funds, ETFs, green bonds, and private equity. Choose instruments aligned with your strategy and risk tolerance.
Evaluate ESG Ratings: Use independent ESG rating agencies such as MSCI ESG Ratings, Sustainalytics, and Refinitiv to assess company performance.
Diversify ESG Portfolio: Spread investments across sectors and regions to balance risk and capitalize on growth opportunities.
Engage and Monitor: Active investors can influence corporate behavior through engagement, proxy voting, and continuous monitoring of ESG performance.
Stay Updated: ESG trends, regulations, and best practices evolve rapidly. Staying informed ensures alignment with current standards and emerging opportunities.
The Future of ESG Investing
The future of ESG investing is poised for continued growth and integration into mainstream finance. Several trends indicate this trajectory:
Mainstream Institutional Adoption: Pension funds, insurance companies, and sovereign wealth funds are increasingly integrating ESG criteria into their investment mandates.
Enhanced Regulatory Frameworks: Governments worldwide are strengthening ESG disclosure requirements and sustainable finance regulations.
Technological Innovation: AI, blockchain, and big data analytics will improve ESG data accuracy, impact measurement, and reporting transparency.
Increased Focus on Social Equity: Investors are broadening ESG considerations to include human capital development, diversity, equity, and inclusion.
Global Collaboration: International initiatives such as the UN Principles for Responsible Investment (PRI) and the Task Force on Climate-Related Financial Disclosures (TCFD) are standardizing ESG practices and encouraging cross-border investments.
Conclusion
Investing in ESG is not merely a trend; it represents a paradigm shift in how capital interacts with society and the environment. By integrating environmental, social, and governance considerations into investment strategies, investors can achieve a dual objective: generating sustainable financial returns while contributing to a healthier, fairer, and more resilient world. The growth, innovation, and regulatory momentum behind ESG investing signal that it will continue to play a central role in shaping the future of finance, ensuring that profits and purpose go hand in hand.
Best Sectors for DIP BuyingUnderstanding DIP Buying
DIP buying is not about chasing falling stocks randomly; it is a strategic approach that involves:
Identifying market corrections — temporary downturns due to macroeconomic, geopolitical, or industry-specific factors.
Focusing on strong fundamentals — companies and sectors that have resilient business models, consistent revenue streams, and solid management.
Timing entry carefully — entering after a confirmed DIP, avoiding panic-driven short-term losses.
Successful DIP buying requires a blend of technical analysis, fundamental insights, and macroeconomic awareness. The sectors most suitable for DIP buying often exhibit strong historical performance, high growth potential, and resilience during economic downturns.
1. Information Technology (IT) Sector
The IT sector is one of the most reliable candidates for DIP buying due to its consistent growth, global demand, and adaptability. Companies in this sector benefit from:
Global outsourcing trends — Many multinational corporations rely on Indian and global IT firms for software, cloud services, and consulting.
Digital transformation — The ongoing shift to AI, cloud computing, cybersecurity, and data analytics ensures long-term growth.
Revenue visibility — Strong contracts and recurring income streams reduce investment risk.
DIP buying strategy for IT: Look for temporary dips caused by global tech slowdowns, currency fluctuations, or short-term policy changes. Strong firms often rebound faster than the market.
2. Banking and Financial Services
The banking sector is sensitive to economic cycles but offers excellent opportunities during market corrections:
Rising interest rates — Can improve net interest margins, boosting profitability.
Credit growth potential — In emerging economies, the demand for loans, mortgages, and consumer credit often leads to long-term sector growth.
Consolidation benefits — Mergers among banks often create stronger entities capable of weathering downturns.
DIP buying strategy for banks: Focus on fundamentally strong banks with healthy capital ratios and lower NPAs (Non-Performing Assets). Temporary market fears often result in attractive entry points.
3. Pharma and Healthcare
Pharmaceuticals and healthcare are defensive sectors with strong potential for DIP buying:
Global demand — Aging populations and increasing healthcare awareness drive sustained demand.
Innovation pipeline — Continuous R&D in vaccines, therapeutics, and biotech ensures long-term growth.
Regulatory resilience — Even during recessions, healthcare demand remains relatively stable.
DIP buying strategy for pharma: Short-term dips caused by regulatory changes, pricing pressures, or temporary market sentiment can offer buying opportunities in companies with robust pipelines and global presence.
4. Consumer Goods and FMCG
Fast-Moving Consumer Goods (FMCG) are classic defensive investments:
Stable demand — Products like food, beverages, and personal care are essentials, ensuring steady sales.
Inflation hedges — Well-managed companies can pass on cost increases to consumers.
Brand loyalty — Strong brands maintain market share during economic slowdowns.
DIP buying strategy for FMCG: Market dips caused by temporary macroeconomic concerns often create excellent buying opportunities in large, cash-rich companies with pricing power.
5. Renewable Energy and Infrastructure
The renewable energy and infrastructure sectors are emerging as high-growth segments:
Government initiatives — Policy support and subsidies boost sector confidence.
Global trends — Investment in solar, wind, and green technologies is accelerating worldwide.
Long-term contracts — Infrastructure projects provide predictable revenue streams.
DIP buying strategy: Short-term market jitters, like interest rate concerns or project delays, can create attractive entry points in fundamentally strong companies.
6. Metals and Commodities
Cyclically sensitive sectors like metals and commodities offer DIP buying opportunities when global demand is temporarily weak:
Infrastructure demand — Metals like steel and aluminum benefit from industrial expansion.
Global supply fluctuations — Temporary supply chain issues or geopolitical tensions can depress prices, creating buying opportunities.
Export potential — Rising global commodity prices can boost revenue for exporting companies.
DIP buying strategy: Focus on sectors with strong balance sheets and long-term demand growth, rather than short-term market panic-driven dips.
7. Real Estate
Although cyclical, the real estate sector provides strong DIP buying opportunities during market slowdowns:
Interest rate sensitivity — Lower interest rates can lead to property demand recovery.
Urbanization trends — Growing urban populations ensure long-term housing demand.
Government policies — Initiatives like affordable housing schemes create consistent opportunities.
DIP buying strategy: Invest in developers with strong project pipelines, low debt, and a proven track record. Dips often occur due to temporary liquidity concerns or sentiment-driven corrections.
8. Energy and Oil
Energy, particularly oil and gas, remains critical in a globalized economy:
Global demand recovery — Economic growth cycles drive energy consumption.
Price volatility — Temporary declines in crude prices can create buying opportunities for integrated energy firms.
Dividend potential — Many energy companies provide steady dividends, making them attractive in market dips.
DIP buying strategy: Target integrated energy players with low debt and strong cash flows during global commodity price corrections.
Key Indicators for Identifying DIP Buying Opportunities
To maximize the success of DIP buying, investors should monitor:
Price-to-Earnings (P/E) ratio — Compare with historical averages.
Debt-to-Equity ratio — Low leverage indicates financial resilience.
Revenue and profit growth trends — Ensure fundamentals remain strong despite short-term market dips.
Macro indicators — Inflation, interest rates, and GDP growth impact sector performance.
Global cues — International demand, trade policies, and geopolitical tensions can create temporary dips.
Risk Management in DIP Buying
While DIP buying is rewarding, risks must be managed:
Avoid falling knives — Don’t buy purely based on price decline; analyze fundamentals.
Diversify across sectors — Reduces impact of sector-specific downturns.
Set target levels and stop losses — Protect capital from unexpected market shocks.
Monitor liquidity — Ensure the stock or sector is liquid enough for easy entry and exit.
Conclusion
DIP buying is a powerful strategy for long-term wealth creation, but its success hinges on careful sector selection, timing, and risk management. The best sectors for DIP buying — IT, banking, pharma, FMCG, renewable energy, metals, real estate, and energy — combine strong fundamentals, growth potential, and resilience against market volatility. By focusing on these sectors and using systematic analysis, investors can convert temporary market corrections into profitable opportunities, securing superior returns over time.
Consistent Trading Plan: The Long-Term Market Success1. Understanding a Consistent Trading Plan
A consistent trading plan is a documented framework that defines how a trader enters and exits trades, manages risk, and evaluates performance. It eliminates guesswork, emotional decision-making, and impulsive actions, providing a structured approach to achieve long-term profitability. Unlike short-term strategies that rely on luck or intuition, a trading plan focuses on repeatable processes backed by data, experience, and market logic.
Key features of a consistent trading plan include:
Clarity: Every rule and guideline is explicitly defined.
Discipline: Following the plan consistently without deviation.
Adaptability: Periodic evaluation to incorporate market changes.
Risk Management: Predefined risk per trade to preserve capital.
Performance Tracking: Continuous assessment to improve strategy.
2. Core Components of a Trading Plan
A robust trading plan is multidimensional. It involves technical, fundamental, psychological, and logistical elements. The following are the core components:
a. Market and Instrument Selection
Choosing the right market and instruments is the first step. Traders need to determine which asset classes they will trade—stocks, commodities, forex, or derivatives. Considerations include:
Liquidity: Higher liquidity ensures smoother trade execution.
Volatility: Volatility defines potential profit and risk per trade.
Trading Hours: Understanding market timing helps optimize entries and exits.
Personal Knowledge: Focus on markets and instruments you understand well.
b. Trading Strategy and Setup
A trading plan must clearly define the strategies used. This includes:
Trend-following vs. Counter-trend: Will you trade in the direction of the trend or against it?
Technical Indicators: Such as moving averages, RSI, MACD, or Fibonacci retracements.
Entry Criteria: Specific conditions that must be met to enter a trade.
Exit Criteria: Rules for taking profit or cutting losses.
c. Risk Management
One of the most crucial elements of a consistent plan is risk management. Without it, even profitable strategies can fail. Risk management involves:
Position Sizing: Determining the size of each trade based on account balance and risk tolerance.
Stop-loss Placement: Predefined points to limit losses.
Risk-Reward Ratio: A minimum acceptable ratio ensures profitable trades outweigh losing trades.
Diversification: Avoid overexposure to a single asset or sector.
d. Psychological Framework
Emotions are a trader’s biggest enemy. Fear, greed, and overconfidence can lead to impulsive decisions. A trading plan should address:
Emotional Awareness: Recognize your emotional triggers.
Discipline Protocols: Steps to stay disciplined during losses or winning streaks.
Routine: Establish pre-market and post-market rituals to maintain focus.
e. Performance Evaluation
Even the best plan requires ongoing evaluation. This includes:
Trade Journal: Record every trade with reasons for entry/exit, emotions, and outcomes.
Metrics Analysis: Track win/loss ratio, average profit/loss, drawdowns, and risk-adjusted returns.
Review Schedule: Weekly, monthly, or quarterly evaluations help refine strategies.
3. Building Your Trading Plan Step by Step
Creating a consistent trading plan is a step-by-step process. Here’s a structured approach:
Step 1: Define Your Trading Goals
Determine realistic profit targets and acceptable drawdowns.
Set short-term, medium-term, and long-term objectives.
Clarify your purpose: income generation, capital preservation, or wealth accumulation.
Step 2: Choose Your Trading Style
Select a style aligned with your personality and time availability:
Scalping: Quick trades, high frequency, requires constant attention.
Day Trading: Positions closed within a day, moderate time commitment.
Swing Trading: Trades held for days to weeks, suitable for part-time traders.
Position Trading: Long-term trades, less frequent monitoring, patience required.
Step 3: Define Entry and Exit Rules
Use technical indicators or chart patterns for entry triggers.
Determine precise exit points for profits and stop-losses.
Establish rules for adjusting positions as markets move.
Step 4: Implement Risk Management
Decide the maximum percentage of your account to risk per trade.
Define leverage usage if trading derivatives.
Prepare contingency plans for unexpected market events.
Step 5: Develop a Trading Routine
Allocate specific times for market analysis, order placement, and review.
Include pre-market preparation: reviewing charts, news, and economic data.
Conduct post-market reflection: assess trades and performance metrics.
Step 6: Track and Evaluate Performance
Maintain a detailed trading journal.
Analyze mistakes and successes.
Adjust strategies based on performance data, not emotion.
4. Psychological Discipline in a Trading Plan
A well-structured plan is ineffective without psychological discipline. Key principles include:
Consistency Over Perfection: Focus on following your plan rather than winning every trade.
Patience: Avoid impulsive trades; wait for setups that meet criteria.
Resilience: Accept losses as part of the process; never chase trades to recover.
Confidence in Strategy: Trust your plan, especially during drawdowns.
5. Common Mistakes Traders Make
Even with a trading plan, mistakes happen. Awareness is crucial:
Ignoring the Plan: Deviating from rules during emotional swings.
Overtrading: Entering trades without valid setups.
Poor Risk Management: Using high leverage or risking too much per trade.
Neglecting Journaling: Without tracking, you cannot improve.
Failure to Adapt: Markets evolve; static strategies may underperform.
6. Benefits of a Consistent Trading Plan
The advantages of following a disciplined, consistent plan are profound:
Reduced Emotional Stress: Confidence grows when rules guide decisions.
Better Risk Control: Systematic management reduces catastrophic losses.
Increased Profitability: Consistency compounds returns over time.
Improved Self-Awareness: Journaling reveals psychological strengths and weaknesses.
Adaptability: Regular evaluation allows strategy refinement without panic.
7. Tools to Support Your Trading Plan
Modern trading technology can enhance the effectiveness of your plan:
Trading Platforms: Real-time charts, indicators, and order execution.
Screeners and Alerts: Monitor opportunities aligned with your plan.
Journaling Software: Track trades and generate performance analytics.
Backtesting Tools: Validate strategies against historical data.
News and Economic Feeds: Stay informed of market-moving events.
8. Adapting Your Plan to Market Conditions
A consistent plan does not mean rigidity. Traders must:
Analyze Market Trends: Adjust strategies for bullish, bearish, or sideways markets.
Evaluate Volatility: Modify position sizing during high or low volatility periods.
Stay Updated: Economic policies, interest rates, and geopolitical events influence outcomes.
Refine Strategies: Remove setups that underperform; add new, tested methods.
9. Real-Life Example of a Consistent Trading Plan
Consider a swing trader in the stock market:
Market: Nifty 50 stocks.
Style: Swing trading, 2-5 day holding period.
Entry Rule: Buy when the 20-day moving average crosses above the 50-day moving average, confirmed by RSI below 70.
Exit Rule: Take profit at 5-10% gain or stop-loss at 2%.
Risk: 1% of total account per trade.
Routine: Review charts every morning, place orders, and update journal post-market.
Review: Weekly analysis to optimize entry/exit rules based on performance.
This example demonstrates the clarity and repeatability a trading plan provides.
10. Conclusion: Discipline is the Ultimate Profit Engine
A consistent trading plan is not a magic formula for instant wealth; it is a structured approach to long-term market success. It removes emotion, enforces discipline, and allows traders to focus on process over outcome. Traders who embrace a comprehensive plan—covering strategy, risk management, psychology, and evaluation—are far more likely to achieve sustainable profitability.
Remember, consistency in trading is not about winning every trade; it is about winning over time, learning from mistakes, and compounding gains in a disciplined manner. By committing to a consistent trading plan, you transform trading from a gamble into a professional, repeatable skill.
AI Predicts Market Moves1. The Foundation: How AI Understands Market Behavior
AI predicts market movements by analyzing enormous amounts of structured and unstructured data. Unlike traditional models that rely on past prices and fixed formulas, AI adapts dynamically to changing market conditions.
Here’s how the process works:
Data Collection: AI systems gather information from multiple sources — stock prices, volumes, social media sentiment, macroeconomic indicators, corporate filings, and even satellite images.
Feature Engineering: Machine learning algorithms identify key features (price momentum, volatility, correlations) that may impact future movements.
Model Training: AI models, especially deep learning networks, are trained using historical data to learn patterns that precede bullish or bearish trends.
Prediction: The trained model predicts probable outcomes, such as price direction, volatility range, or breakout levels.
Feedback Loop: The system continuously learns from real-time data, refining its accuracy over time.
This self-learning nature makes AI a powerful force in financial prediction, as it becomes more accurate and efficient the longer it operates.
2. Machine Learning Models That Power Market Predictions
Several AI techniques are used to predict market movements. Each serves a unique role depending on the type of market data and the trading objective.
A. Supervised Learning
Supervised models are trained on labeled data (e.g., past price data with known outcomes). Common algorithms include:
Linear and Logistic Regression: Useful for basic price trend forecasts.
Random Forests and Gradient Boosting: Handle complex, nonlinear relationships between variables.
Support Vector Machines (SVM): Ideal for identifying trend reversals.
B. Unsupervised Learning
Unsupervised models detect hidden patterns without pre-labeled outcomes.
Clustering (e.g., K-means): Groups similar stocks or market behaviors.
Principal Component Analysis (PCA): Reduces data complexity to identify dominant market factors.
C. Deep Learning and Neural Networks
These models simulate how the human brain processes information.
Recurrent Neural Networks (RNNs) and LSTM (Long Short-Term Memory): Designed to analyze sequential data like time series, making them perfect for price prediction.
Convolutional Neural Networks (CNNs): Surprisingly effective for pattern recognition in candlestick charts or heatmaps.
Transformers (like those used in ChatGPT): Emerging models that can process multiple forms of data — text, numbers, sentiment — simultaneously for market insight.
D. Reinforcement Learning
In this model, AI acts as an agent that learns by taking actions and receiving feedback (reward or penalty). It’s widely used in algorithmic trading to optimize execution strategies or portfolio balancing.
3. Sentiment Analysis: Reading the Market’s Mood
The market is not purely mathematical — it’s emotional. Investor sentiment can drive markets up or down faster than fundamentals. AI sentiment analysis decodes these emotions from textual and social data sources.
Natural Language Processing (NLP) allows AI to read news articles, analyst reports, earnings calls, and social media posts.
By detecting tone and language, AI gauges whether market sentiment is bullish, bearish, or neutral.
Sentiment data is then quantified and fed into predictive models to anticipate short-term movements.
For example, a sudden surge in positive social media mentions about a stock may indicate upcoming bullish momentum. Conversely, a negative news trend could trigger an early warning for a price drop.
4. Big Data Meets AI: The New Market Edge
Market prediction used to depend primarily on numerical data — prices, volumes, and indicators. Today, AI uses big data to analyze patterns across multiple dimensions simultaneously.
Key data types AI analyzes include:
Price and Volume Data: Traditional market information.
Fundamental Data: Balance sheets, earnings reports, P/E ratios.
Macroeconomic Data: Inflation, interest rates, GDP growth.
Alternative Data: Satellite imagery (e.g., tracking retail traffic), credit card spending, or shipping volumes.
Behavioral Data: Search engine trends, social media posts, and online sentiment.
AI’s ability to merge these data types into a single predictive framework creates a far more holistic understanding of market dynamics — something human analysts can’t achieve manually.
5. High-Frequency Trading (HFT) and Predictive Algorithms
AI plays a crucial role in high-frequency trading, where thousands of trades occur in milliseconds. Here, even a microsecond advantage can yield significant profits.
AI systems in HFT:
Predict short-term price fluctuations based on market microstructures.
Execute trades automatically using reinforcement learning strategies.
Continuously adapt to new data and refine models to maintain a competitive edge.
For instance, if AI detects a sudden imbalance between buy and sell orders, it might predict a short-term breakout and place rapid-fire orders to capitalize on the move — all before human traders can react.
6. Predictive Portfolio Management and Risk Control
AI doesn’t just forecast prices; it predicts risk. Predictive portfolio models use AI to optimize allocations by analyzing correlations, volatility, and macroeconomic scenarios.
Predictive Asset Allocation: AI forecasts which assets are likely to outperform under certain conditions.
Dynamic Hedging: Machine learning models predict downside risk and automatically adjust hedges using derivatives.
Anomaly Detection: AI identifies abnormal price movements that may indicate fraud, manipulation, or systemic instability.
This predictive capability helps fund managers stay one step ahead of uncertainty, minimizing losses and enhancing long-term returns.
7. AI-Powered Tools Used by Traders
The global trading ecosystem now hosts numerous AI-based tools and platforms that help traders predict and react faster.
Examples include:
Bloomberg Terminal AI: Integrates NLP to summarize financial news instantly.
Kavout’s Kai Score: AI-driven stock ranking system.
Upstox and Zerodha (India): Implement algorithmic and data-driven recommendations powered by AI analytics.
AlphaSense: Scans millions of financial documents to detect sentiment and trends.
Even retail traders can now use AI-based trading bots that combine technical indicators, sentiment data, and reinforcement learning to generate predictive insights.
8. Limitations and Risks of AI Predictions
While AI has immense potential, it’s not infallible. Market predictions are inherently uncertain, and several challenges remain:
Black-Box Models: Deep learning models often lack transparency. Traders may not understand why a prediction was made.
Data Bias: If training data is skewed or incomplete, predictions may be inaccurate.
Overfitting: Models may perform well on past data but fail in new, unseen conditions.
Market Manipulation Risks: Predictive AI can be exploited by bad actors who manipulate data sources.
Flash Crashes: Rapid automated trading decisions can trigger sudden market collapses, as seen in past HFT incidents.
Thus, while AI enhances prediction power, it must be used responsibly, with human oversight and ethical guardrails.
9. The Human-AI Partnership in Trading
Despite automation, human intuition still matters. The most successful traders today combine AI-driven insights with human experience.
AI handles the data overload, filtering millions of variables into actionable signals.
Humans interpret context, political events, and macroeconomic nuances that models might miss.
Hybrid Strategies — where AI predicts and humans confirm — are proving to be the most effective approach for modern trading.
This collaboration ensures that traders harness the computational power of AI without losing the strategic foresight that only human judgment provides.
10. The Future of AI Market Predictions: What Lies Ahead
The next generation of AI in trading will go beyond prediction — it will move toward autonomous financial decision-making.
Emerging trends include:
Quantum AI Trading: Combining quantum computing with AI to handle even more complex datasets.
Generative AI Models: Creating simulated market scenarios for predictive testing.
Explainable AI (XAI): Making black-box models transparent so traders understand the “why” behind predictions.
Emotion AI: Measuring real-time trader sentiment through voice and facial analysis for behavioral prediction.
Global Integration: AI systems linking across markets — equities, commodities, forex, and crypto — for unified predictive analysis.
By 2030, it’s expected that over 70% of all trades globally will be AI-assisted or AI-driven, making machine intelligence the core of the financial ecosystem.
Conclusion: The Predictive Revolution in Trading
AI has evolved from being a buzzword to becoming the backbone of market prediction and trading. Its ability to process massive datasets, identify hidden correlations, and forecast potential moves with remarkable accuracy is transforming the very structure of financial markets.
Yet, while AI can predict patterns and probabilities, it cannot guarantee certainty — because markets are influenced by human behavior, policy shifts, and black swan events that defy logic.
The key lies in balance: leveraging AI’s speed, precision, and learning capability while maintaining human control and intuition. As AI continues to mature, those who adapt early — blending technology with insight — will dominate the next generation of global trading.

Identifying when to enter a stock?Identifying when to enter a stock?
Indicator Set Up Required: Bollinger Band, 9 EMA (Orange Line), 21 EMA (Black Line), 50 EMA line (Blue Line), Volume
Wait for the formation of Long body Green Candle.
Ensure that the candle forms near the bottom of Bollinger Band.
Confirm the Big Volume spurt.
Can enter the next day or after pullback to 21 EMA (Blackline).
You can exit when the stock touches upper bolliner band when volume shrinks.
Note: This setup works most of the time.
However, backtest the strategy before trying in the market.
You can keep stoploss below 50 EMA line or 21 EMA line.
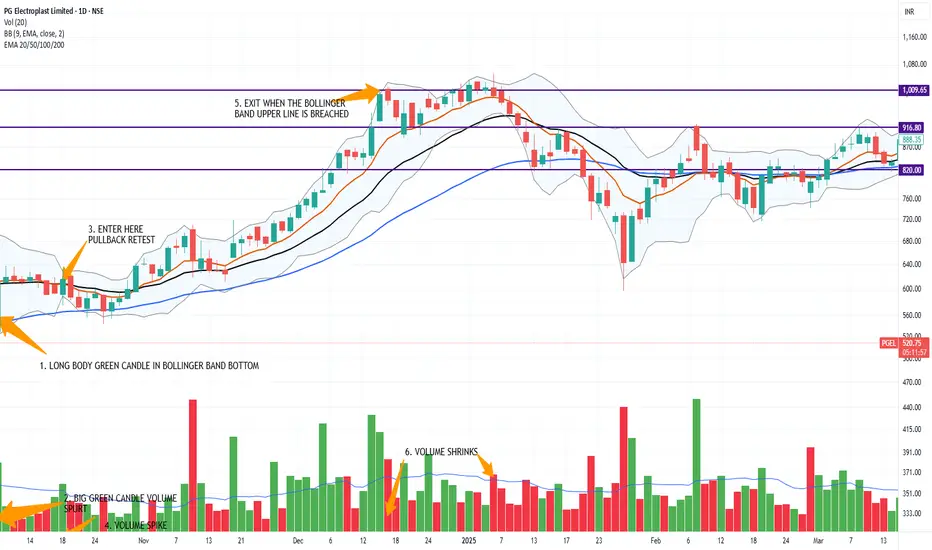
From Euphoria to Equilibrium The Market’s True PatternHello Mates, Hope everyone’s doing great and enjoying the charts so today let’s explore one of the most important market concepts that how an All-Time High gradually evolves into a fresh Support and Resistance cycle.
Understanding the Market’s Natural Rhythm--::
Every chart tells a story a story of enthusiasm, correction, recovery, and retest.
Price action moves in cycles, and one of the most powerful yet simple cycles is when a market makes an All-Time High, corrects into a Support Zone, and then forms a New Resistance before deciding its next direction.
This NIFTY 50 weekly chart beautifully captures that structure a sequence every trader should recognize to understand market behavior with more clarity.
1️⃣ Major Swing High (The All-Time High)
At this stage, optimism dominates and new buyers rush in, assuming the trend will never end.
However, this is also where smart money begins distributing positions quietly.
You’ll often notice slowing momentum, smaller candle bodies, or divergence on oscillators.
This “All-Time High” is not just a price it’s the point where supply pressure starts building and emotional euphoria reaches its peak.
2️⃣ Primary Demand Zone (Support After the All-Time High)
As the correction begins, emotional traders exit while strong hands start building positions again.
The price eventually finds primary demand a zone that often aligns with previous breakout areas or major volume clusters.
This becomes a high-value area, where institutional accumulation quietly begins.
It represents balance after a phase of imbalance a healthy step in any structural cycle.
3️⃣ Secondary Supply Zone (Resistance After Support)
Once the support holds, the price rallies back and retests the previous breakdown region.
This forms a secondary supply zone, where earlier buyers might book profits and short-term traders look for reaction.
It’s a retest phase, where the market decides whether it wants to continue upward or stay range-bound. A breakout from here indicates renewed strength, while rejection can invite another leg of consolidation or retracement.
4️⃣ New Structural Base (Fresh Support)
Recently, we can observe a new higher base forming just below the resistance zone.
This area acts as a structural pivot — often referred to by professionals as:
Intermediate Demand Zone
Base Formation Area
Mid-Structure Support
Higher Low Support Zone
Why This Cycle Matters--::
Recognizing this evolution from All-Time High → Correction → Support → Retest → New Structural Base helps traders identify where they are in the price cycle instead of reacting emotionally and It builds a roadmap of liquidity flow and institutional intent.
No matter the timeframe or assets like stocks, forex, or crypto this structure repeats endlessly, forming the core rhythm of the market.
Key Takeaway--::
Price doesn’t move randomly. It evolves through phases of enthusiasm, fear, and reaccumulation and every level leaves footprints of intent.
Traders who learn to read these transitions stop chasing moves and start understanding the underlying structure of opportunity.
Regards- Amit Rajan
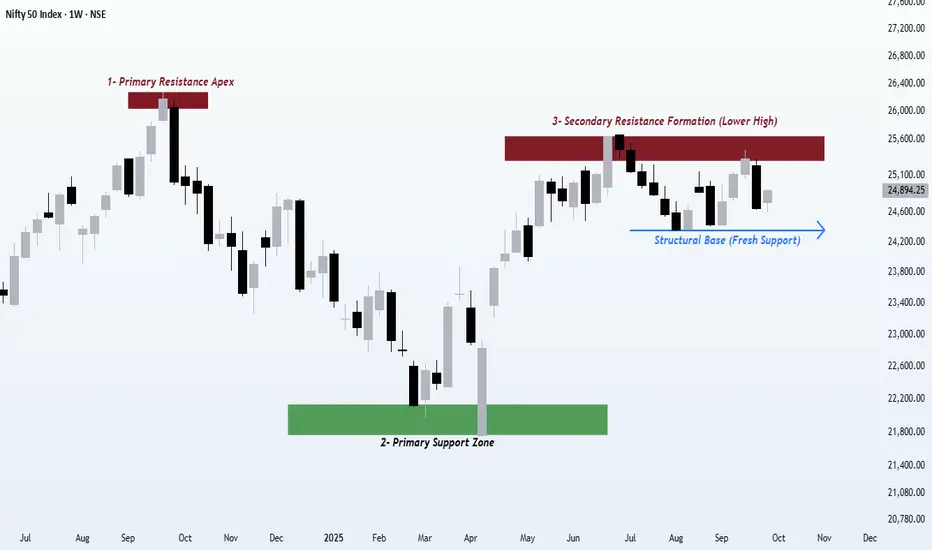
Head and Shoulders - Bearish Reversal Setup🔎Overview
The Head and Shoulders Pattern is a classic bearish reversal formation that signals a potential change in trend from uptrend to downtrend .
It is formed by three peaks:
- Left Shoulder → Price rises, forms a peak, then retraces.
- Head → Price moves higher than the left shoulder, creating the tallest peak, then falls back.
- Right Shoulder → Price rises again but fails to surpass the head, showing loss of momentum.
- Neckline → A line drawn through the two troughs between the shoulders and the head. A breakdown below the neckline confirms bearish sentiment.
This pattern reflects weakening buying pressure and strengthening selling interest, often appearing at the end of strong rallies.
____________________________________________________________
📌 How to Use
• ✅ Pattern Confirmed → When candle closes below the Validation Line
• ❌ Pattern Invalid → If candle closes above the Devalidation Line (Failure Protection).
• Protects against false signals & ensures structured risk management.
____________________________________________________________
📊 Chart Explanation
• Symbol → NSE:NIFTY
• Timeframe → 30m
• Left Shoulder Peak - 24970.30
• Head (Highest Peak) - 25448.95
• Right Shoulder Peak - 24900.80
• Neckline → Drawn by connecting the two troughs between shoulders and head.
• Validation Level → 24,585.75 → Close below = Pattern Confirmed .
• Devalidation Level → 24,910.65 → Close above = Pattern Invalid.
____________________________________________________________
👀 Observations
- The right shoulder often appears weaker, highlighting reduced buyer confidence.
- Once the neckline is tested multiple times, probability of a breakdown increases.
- Volume generally decreases during formation and expands during breakdown, strengthening confirmation.
- This setup helps traders anticipate major reversals rather than chasing late entries.
- Head and Shoulders is widely followed, making it self-fulfilling as many traders act on the same signal.
____________________________________________________________
💡 Why It Matters
Head & Shoulders is one of the most reliable reversal patterns, giving clear validation/devalidation levels for structured risk management. It helps avoid false breakouts and provides traders with predefined stop-loss and target zones.
____________________________________________________________
✅ Conclusion
Breakdown below the Validation Line confirms bearish reversal bias. Combine this with broader market context, volume confirmation, and disciplined position sizing for effective trading decisions.
____________________________________________________________
⚠️ Disclaimer
📘 For educational purposes only.
🙅 Not SEBI registered.
❌ Not a buy/sell recommendation.
🧠 Purely a learning resource.
📊 Not Financial Advice.
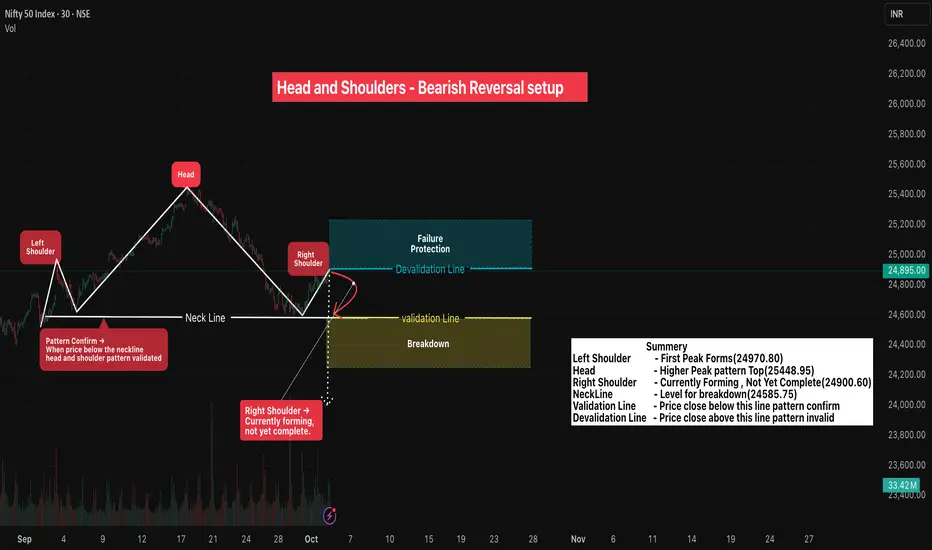
Commodity MCX Trading1. Overview of MCX and Commodity Trading
The Multi Commodity Exchange (MCX) is India’s premier commodity derivatives exchange, offering futures trading in metals, energy, and agricultural commodities. It was established to provide a transparent and regulated platform for trading commodities, mitigating the risks associated with price volatility.
Key Features:
Futures contracts for commodities
Price discovery mechanism
Hedging opportunities for producers and consumers
Regulated by the Securities and Exchange Board of India (SEBI)
MCX trading allows participants to speculate on price movements or hedge against potential losses in commodity prices. Commodities traded on MCX are divided into precious metals, base metals, energy commodities, and agricultural commodities.
2. Types of Commodities Traded on MCX
MCX offers a variety of commodities under different categories:
Precious Metals: Gold, Silver, Platinum, and Palladium
Base Metals: Copper, Aluminium, Zinc, Lead, Nickel
Energy Commodities: Crude Oil, Natural Gas, Petrol, Diesel
Agricultural Commodities: Cotton, Cardamom, Jeera, Turmeric
Each commodity has specific contracts with defined lot sizes, expiry dates, and tick sizes, providing structured opportunities for traders.
3. Understanding MCX Trading Mechanism
MCX operates on a futures-based trading system. In futures trading, traders agree to buy or sell a commodity at a predetermined price on a future date.
How it works:
Contract Selection: Traders choose the commodity and the expiry month.
Order Placement: Buy or sell orders are placed through brokers registered with MCX.
Margin Requirement: Traders deposit an initial margin to cover potential losses.
Settlement: Contracts are cash-settled or physically delivered at expiry, depending on the commodity.
MCX trading is electronic, ensuring transparency, liquidity, and real-time price discovery.
4. Role of Leverage and Margins
MCX trading involves leverage, which allows traders to control a large value of commodities with a relatively small margin.
Key Points:
Initial Margin: Required to open a position, varies by commodity and market volatility.
Mark-to-Market (MTM): Daily profit or loss adjustments based on closing prices.
Leverage Risk: High leverage can magnify gains but also increases potential losses.
Understanding margin requirements is critical to managing risks effectively in MCX trading.
5. Hedging and Speculation
MCX is used by both hedgers and speculators:
Hedgers: Producers, exporters, and manufacturers use MCX to mitigate price risks. Example: A gold jeweler may hedge against future price rises by buying gold futures.
Speculators: Traders aiming to profit from price fluctuations, often using technical and fundamental analysis to identify trading opportunities.
Hedging ensures stability for businesses, while speculation adds liquidity to the market.
6. Analysis Techniques in MCX Trading
Successful MCX trading relies on technical and fundamental analysis:
Technical Analysis: Uses charts, indicators, and patterns to predict price movements. Common tools include Moving Averages, RSI, MACD, and Bollinger Bands.
Fundamental Analysis: Focuses on supply-demand dynamics, geopolitical events, weather conditions, and macroeconomic factors affecting commodity prices.
A combination of both approaches helps traders make informed decisions.
7. Risk Management in Commodity Trading
Commodity trading carries inherent risks due to price volatility. Effective risk management strategies include:
Stop-loss Orders: Limit potential losses on a position.
Position Sizing: Allocate capital according to risk tolerance.
Diversification: Trade multiple commodities to spread risk.
Regular Monitoring: Keep track of global events, inventory reports, and currency fluctuations.
Risk management is crucial for both short-term and long-term traders.
8. Benefits and Challenges of MCX Trading
Benefits:
High liquidity and transparent trading platform
Opportunities for hedging and speculation
Potential for profit in rising or falling markets
Structured contracts with standardized specifications
Challenges:
High volatility and market risk
Requires understanding of complex derivative contracts
Leverage can magnify losses
Dependence on global commodity trends and geopolitical events
MCX trading offers opportunities for wealth creation but requires discipline, knowledge, and strategy.
Conclusion
MCX commodity trading is an essential tool for hedging, price discovery, and speculative profit in India. With the right analysis, risk management, and disciplined approach, traders can leverage the platform effectively. Understanding contract specifications, margins, market drivers, and trading psychology is crucial for success in the volatile commodity markets.
Event-Driven Earnings TradingEvent-driven earnings trading is a strategy in the financial markets that focuses on capitalizing on price movements caused by corporate events, primarily earnings announcements. Unlike traditional trend-following or technical trading, this strategy is based on analyzing how specific news, reports, or announcements affect a company’s stock price. Earnings trading is considered highly profitable but requires precise timing, strong analytical skills, and disciplined risk management.
Here’s a detailed breakdown of key elements of event-driven earnings trading:
1. Understanding Earnings Announcements
Earnings announcements are periodic reports released by publicly traded companies detailing their financial performance over a specific period, usually quarterly. Traders monitor these announcements to gauge a company's profitability, revenue growth, and future prospects.
EPS (Earnings Per Share): A critical metric showing the profit allocated to each share of stock.
Revenue vs. Expectations: Markets react not just to absolute earnings but to how they compare to analysts’ consensus estimates.
Forward Guidance: Companies often provide future forecasts, which can influence short-term and medium-term stock movements.
Key takeaway: A solid understanding of earnings reports allows traders to anticipate market reactions before they occur.
2. Pre-Earnings Analysis and Positioning
Traders often prepare well before an earnings release. Pre-earnings analysis involves:
Studying past earnings reactions to similar announcements.
Identifying patterns in volatility expansion prior to earnings.
Analyzing analyst expectations and market sentiment.
Observing options market activity for unusual trading volumes or skewed implied volatility.
Positioning strategies can include setting up directional trades if confident in the earnings outcome or hedged trades to limit risk.
3. Earnings Surprises and Market Reaction
Earnings surprises occur when the reported earnings deviate significantly from analysts’ expectations:
Positive Surprise: EPS or revenue exceeds expectations → Stock often gaps up.
Negative Surprise: EPS or revenue falls short → Stock may gap down.
The magnitude of the reaction depends on:
Market sentiment
Magnitude of the surprise
Company fundamentals and sector context
Key insight: Markets are highly sensitive to unexpected earnings outcomes, creating short-term trading opportunities.
4. Event-Driven Trading Strategies
Several approaches are employed by traders around earnings events:
Directional Bets: Taking a long or short position based on expected earnings outcome.
Straddle/Strangle Option Strategies: Buying calls and puts simultaneously to profit from volatility spikes.
Post-Earnings Momentum: Trading the continuation or reversal of price trends immediately after earnings.
Pairs Trading: Hedging exposure by trading correlated stocks when one releases earnings.
Each strategy involves balancing risk and reward while factoring in implied volatility and market sentiment.
5. Volatility Considerations
Earnings announcements often lead to high volatility:
Pre-Earnings: Volatility often rises in anticipation of the report, reflected in options prices.
Post-Earnings: A sharp drop or spike can occur depending on the surprise and market reaction.
Traders must account for implied volatility crush, a sudden decrease in options premium after earnings release. Understanding this concept is crucial for options-based strategies.
6. Risk Management in Earnings Trading
Event-driven trading carries high risk due to unpredictable market reactions. Effective risk management includes:
Setting strict stop-loss levels
Avoiding overleveraging positions
Diversifying trades across multiple earnings events
Hedging with options to limit potential losses
Maintaining discipline is essential because unexpected announcements or market sentiment shifts can lead to significant losses.
7. Tools and Data Sources
Successful earnings trading relies on real-time data and analytical tools:
Earnings Calendars: Track upcoming announcements.
Financial News Platforms: Bloomberg, Reuters, CNBC for updates.
Options Chains: Monitor implied volatility and unusual option activity.
Technical Analysis: Identify support/resistance levels for post-earnings movement.
Combining fundamental and technical insights allows traders to make informed decisions.
8. Psychology and Market Behavior
Understanding market psychology is as important as analyzing financials:
Traders react emotionally to surprises, leading to exaggerated moves.
Herd behavior can amplify short-term volatility.
Experienced traders exploit these reactions by anticipating overreactions and mean reversions.
Key takeaway: Emotional discipline and a systematic approach increase the probability of success in earnings trading.
Conclusion
Event-driven earnings trading offers traders unique opportunities to profit from corporate announcements. By combining pre-earnings analysis, strategic positioning, risk management, and psychological insight, traders can navigate the volatility and capitalize on market inefficiencies. While the potential rewards are significant, disciplined execution and robust analysis are vital to sustaining long-term profitability.
Intraday Scalping Tips1. Understanding the Scalping Concept
Scalping is different from traditional intraday trading. While intraday traders may hold positions for several hours, scalpers aim to profit from very small price fluctuations that occur over minutes—or even seconds. Key principles include:
High Trade Frequency: Scalpers often make dozens of trades in a single day.
Small Gains: Each trade typically targets 0.1–0.5% profit.
Minimal Exposure: Trades are closed quickly to avoid major market risks.
Scalping is particularly effective in highly liquid markets like Nifty, Bank Nifty, or major blue-chip stocks where order execution is smooth and spreads are low.
2. Choosing the Right Stocks or Instruments
Not all stocks are suitable for scalping. Selecting the right instruments is critical for consistent profits. Key considerations include:
Liquidity: Highly traded stocks allow quick entry and exit.
Volatility: Moderate volatility provides enough price movement for scalping without excessive risk.
Tight Spreads: Stocks with narrow bid-ask spreads reduce transaction costs.
Market Depth: Strong support and resistance levels make prediction of price action more reliable.
Popular choices for scalpers in India include Nifty, Bank Nifty, HDFC Bank, Reliance, and Infosys, as they provide both liquidity and predictable movement patterns.
3. Time Frame Selection and Chart Analysis
Time frame selection is critical in scalping since trades are short-lived:
1-Minute and 5-Minute Charts: Most scalpers rely on very short time frames for identifying entry and exit points.
Tick Charts: Some traders use tick charts to focus on the number of trades instead of time intervals, offering precision in fast markets.
Indicators: Common indicators include:
Moving Averages: For trend confirmation.
Relative Strength Index (RSI): To spot overbought/oversold conditions.
Volume Indicators: Confirm breakout strength and liquidity.
Chart patterns like flags, pennants, and micro-trends are also useful for short-term trade setups.
4. Setting Precise Entry and Exit Points
Successful scalping relies on strict entry and exit discipline:
Entry Rules: Enter trades when technical indicators align (e.g., price breaks a micro-resistance on high volume).
Exit Rules: Always set a pre-determined profit target (e.g., 0.2–0.5%) to avoid greed.
Stop-Loss Discipline: A tight stop-loss (0.1–0.3% below entry price) prevents small losses from becoming large.
Risk-Reward Ratio: Even for small profits, maintain a risk-reward ratio that ensures overall profitability.
Automation tools like bracket orders in NSE allow traders to simultaneously set stop-loss and target levels.
5. Capital Management and Trade Sizing
Proper capital management is crucial to survive in high-frequency scalping:
Small Position Sizes: Avoid risking too much on a single trade.
Leverage Management: Use leverage cautiously; while it magnifies profits, it also amplifies losses.
Diversification: Spread trades across multiple instruments to reduce concentration risk.
Daily Loss Limits: Decide beforehand how much you can lose in a day and stick to it—emotional control is key.
Even small profits can accumulate when losses are strictly controlled.
6. Using Technology for Speed and Accuracy
Scalping is a speed-driven strategy, making technology a critical factor:
Direct Market Access (DMA): Enables faster order execution compared to traditional brokers.
Low Latency Trading Platforms: Platforms like Zerodha Kite, Upstox Pro, and Interactive Brokers help reduce slippage.
Hotkeys and Advanced Orders: Pre-set hotkeys speed up entries and exits.
Real-Time Data Feeds: Access to live market data is essential for micro-trend identification.
Automated scripts and algorithmic tools can also be employed to execute scalping strategies without hesitation.
7. Psychological Discipline and Emotional Control
Scalping is mentally demanding due to rapid decision-making:
Avoid Overtrading: Even if setups are frequent, wait for high-probability signals.
Embrace Small Wins: Focus on cumulative gains rather than single trades.
Detach from Emotions: Fear and greed can destroy scalping strategies in seconds.
Routine and Focus: A disciplined pre-market routine enhances performance.
Mental fatigue can lead to poor execution, so breaks and mental preparation are crucial.
8. Continuous Learning and Strategy Adaptation
Markets are dynamic, and scalping strategies must evolve:
Review Trades Daily: Maintain a trade journal to track setups, wins, and losses.
Backtesting: Test strategies on historical data to identify strengths and weaknesses.
Adapt to Market Conditions: Scalping in trending markets differs from range-bound markets.
Stay Updated: Economic events, corporate news, and global market movements can drastically affect intraday behavior.
Continuous refinement ensures long-term profitability and helps scalpers stay ahead of changing conditions.
Conclusion
Intraday scalping is a high-speed, high-discipline trading approach that rewards precision, strategy, and emotional control. Success depends on selecting the right instruments, leveraging technology, maintaining strict risk management, and continuously learning from market behavior. While scalping can offer consistent profits, it is not suitable for everyone due to its demanding nature. Traders who combine discipline with strategic execution and adaptive methods can use scalping to capitalize on micro-movements in the market and achieve steady gains over time.
Smart Option Strategies1. Understanding the Basics of Options
Before diving into strategies, it’s crucial to understand what options are and their fundamental mechanics. An option is a contract that gives the buyer the right, but not the obligation, to buy (call option) or sell (put option) an underlying asset at a predetermined price (strike price) on or before a specified expiration date.
Key Terms:
Call Option: Right to buy the underlying asset.
Put Option: Right to sell the underlying asset.
Strike Price: Predetermined price at which the underlying can be bought/sold.
Premium: Price paid to acquire the option.
Expiry: The date when the option contract ends.
Options can be used for speculation, hedging, or income generation. Smart strategies leverage these concepts to create a risk-reward profile suited to the trader’s objective.
2. The Importance of Market Outlook
A critical step in any smart option strategy is defining your market outlook. Options are directional instruments, meaning your choice of strategy depends on whether you expect the market to go up, down, or stay neutral.
Bullish Outlook: Use strategies like long calls, bull call spreads, or cash-secured puts.
Bearish Outlook: Use strategies like long puts, bear put spreads, or protective puts.
Neutral Outlook: Use strategies like iron condors, butterflies, or straddles/strangles.
By aligning strategy with market expectations, traders can manage risk effectively while enhancing the probability of profit.
3. Leverage Through Spreads
One of the most effective tools in smart options trading is the spread. A spread involves taking two or more options positions simultaneously to limit risk while maintaining profit potential.
Vertical Spreads: Buy and sell options of the same type (call or put) with different strike prices but the same expiry. Examples: bull call spread, bear put spread.
Horizontal/Calendar Spreads: Buy and sell options of the same type and strike price but with different expiries.
Diagonal Spreads: Combination of vertical and calendar spreads; different strikes and expiries.
Advantages of Spreads:
Reduced upfront cost compared to naked options.
Lower risk due to simultaneous hedging.
Controlled profit and loss ranges.
Spreads are ideal for traders who want to capture directional moves without exposing themselves to unlimited losses.
4. Hedging and Risk Management
A smart option strategy always includes risk management. Hedging is a way to protect your positions from adverse price movements while maintaining upside potential.
Protective Puts: Buying a put option against a long stock position to limit downside.
Covered Calls: Selling call options on stocks you own to generate income and partially hedge downside.
Collars: Combining a protective put with a covered call to create a risk-defined range.
Risk management ensures that even if the market moves unexpectedly, losses are controlled. This is crucial for long-term sustainability in trading.
5. Income Generation with Options
Options are not only for speculation—they are a powerful tool for generating consistent income. Smart traders use strategies that collect premiums while managing risk.
Covered Calls: Sell calls against stock holdings to earn premiums. Ideal for slightly bullish or neutral outlooks.
Cash-Secured Puts: Sell puts against cash reserves to potentially buy stocks at lower prices while collecting premiums.
Iron Condors: Sell an out-of-the-money call and put spread to profit from a neutral market.
These strategies allow traders to create steady cash flow while carefully managing market exposure.
6. Volatility-Based Strategies
Volatility is a critical concept in options trading. It measures the market’s expectation of price fluctuation. Smart traders exploit volatility to maximize returns.
Long Straddles: Buy both a call and a put at the same strike price and expiry, profiting from large moves in either direction.
Long Strangles: Buy out-of-the-money calls and puts, benefiting from volatility with lower premium cost.
Short Straddles/Strangles: Selling these options if you expect low volatility; profit comes from premium decay (theta).
Understanding implied and historical volatility allows traders to choose strategies that capitalize on expected market movements.
7. Time Decay and Option Greeks
Option Greeks are essential for sophisticated strategy planning. They measure how options prices react to various factors:
Delta: Sensitivity to the underlying asset’s price.
Gamma: Rate of change of delta.
Theta: Time decay of the option.
Vega: Sensitivity to volatility.
Rho: Sensitivity to interest rates.
Smart traders use Greeks to manage timing and position sizing. For instance, options lose value as expiry approaches (theta decay), so selling premium in stable markets can be profitable.
8. Combining Strategies for Flexibility
Advanced traders combine multiple strategies to create a flexible trading framework. For example:
Iron Condor with Protective Puts: Combines premium collection with downside protection.
Diagonal Spreads with Calendar Adjustments: Exploits volatility and time decay simultaneously.
Delta-Neutral Strategies: Uses a combination of options and stocks to stay market-neutral while profiting from volatility.
By integrating multiple approaches, traders can adapt to changing market conditions and improve risk-adjusted returns.
Conclusion
Smart options strategies are not about chasing high profits blindly—they are about precision, planning, and adaptability. By understanding the market outlook, leveraging spreads, managing risk, exploiting volatility, and using Greeks, traders can create positions that maximize potential while minimizing risk. Whether your goal is speculation, hedging, or income generation, a smart, structured approach to options trading ensures sustainable success.
Futures and Options (F&O) in Indian Stock Market1. Introduction to F&O
Futures and Options are derivatives, which are financial contracts whose value is derived from an underlying asset such as stocks, indices, commodities, or currencies. Unlike spot market trading, where assets are exchanged immediately, derivatives provide the right or obligation to buy or sell an underlying asset at a predetermined price on a future date.
Futures Contract: A standardized agreement to buy or sell an asset at a future date at a price agreed upon today.
Options Contract: A contract that gives the holder the right, but not the obligation, to buy (Call Option) or sell (Put Option) the underlying asset at a predetermined price before or on the contract's expiry.
F&O trading is highly leveraged, allowing traders to control larger positions with smaller capital, but it also carries higher risk.
2. Components of F&O Contracts
Every F&O contract has specific components that traders must understand:
Underlying Asset: The stock, index, commodity, or currency on which the derivative is based.
Strike Price: The price at which the option can be exercised.
Expiry Date: The date on which the contract matures.
Lot Size: The minimum quantity of the underlying asset that can be traded in a contract.
Premium (for Options): The price paid to buy an option.
Settlement Mechanism: Physical delivery or cash settlement, depending on the contract type.
These components define the risk and payoff structure of F&O trades.
3. Types of F&O Instruments
In the Indian context, F&O instruments are broadly classified into:
Stock Futures and Options: Derivatives based on individual company stocks. For example, Infosys or Reliance stock futures.
Index Futures and Options: Derivatives based on market indices like Nifty 50, Bank Nifty, or Sensex.
Currency Derivatives: Based on currency pairs like USD/INR, EUR/INR.
Commodity Derivatives: Based on metals, energy products, and agricultural commodities.
Each type has its own market participants, risk profiles, and trading strategies.
4. Trading Mechanism in F&O
F&O trading happens on recognized exchanges like NSE (National Stock Exchange) and BSE (Bombay Stock Exchange) in India.
Margin-Based Trading: Traders are required to maintain a margin instead of paying the full contract value. This allows leverage but amplifies risk.
Mark-to-Market (MTM) Settlement: Daily profits and losses are adjusted in the trader’s account to reflect the market movement.
Hedging vs. Speculation: Traders can hedge existing positions in the cash market to reduce risk or speculate purely on price movements.
The trading mechanism ensures liquidity and efficient price discovery, making F&O an essential part of modern financial markets.
5. Advantages of F&O Trading
F&O trading offers several benefits:
Leverage: Control large positions with smaller capital investment.
Hedging: Protect against adverse price movements in the cash market.
Diversification: Trade in multiple asset classes like stocks, indices, commodities, and currencies.
Profit Opportunities in Both Directions: Traders can earn from rising or falling markets using futures and options strategies.
Price Discovery: F&O markets help determine the fair price of underlying assets.
Despite the advantages, F&O trading is risky and requires a clear understanding of strategies and market behavior.
6. Risks in F&O Trading
The high rewards of F&O come with significant risks:
Leverage Risk: Small market movements can result in large gains or losses.
Time Decay (for Options): Options lose value as expiry approaches if the market does not move favorably.
Volatility Risk: Sudden market swings can lead to margin calls or loss of capital.
Liquidity Risk: Some contracts may have fewer participants, making it hard to exit positions.
Effective risk management, such as stop-loss orders, position sizing, and hedging, is crucial for sustainable trading.
7. Popular F&O Strategies
Traders use various strategies depending on market conditions and risk appetite:
Hedging Strategies: Protect investments in the cash market using futures or options.
Speculative Strategies: Take leveraged positions to profit from short-term price movements.
Options Strategies:
Covered Call: Holding the underlying asset and selling call options to earn premium.
Protective Put: Buying a put option to protect against a potential drop in the asset price.
Straddles and Strangles: Profit from high volatility by buying both call and put options.
Understanding and applying strategies carefully is key to F&O success.
8. Regulatory Framework and Market Participants
F&O trading in India is regulated by the Securities and Exchange Board of India (SEBI). Key regulations include:
Position Limits: Restrictions on the maximum number of contracts one can hold.
Margin Requirements: Minimum collateral for trading F&O to mitigate systemic risk.
Settlement Procedures: Standardized processes for MTM, delivery, and expiry settlement.
Market participants include:
Retail Traders: Individual investors participating in hedging or speculation.
Institutional Investors: Mutual funds, insurance companies, and banks using F&O for portfolio management.
Proprietary Traders: Firms or individuals trading with their own capital for profit.
Arbitrageurs: Traders exploiting price discrepancies between spot and derivative markets.
Conclusion
F&O trading is a powerful tool for investors and traders seeking to leverage capital, hedge risks, and benefit from price movements in multiple asset classes. While the potential for high returns exists, it comes with significant risks that require discipline, market knowledge, and risk management skills. With the Indian F&O market growing rapidly, a strong understanding of concepts, strategies, and regulations is essential for anyone aiming to succeed in derivatives trading.
F&O is not just about speculation; it’s an integral part of modern financial markets that supports liquidity, price discovery, and risk management. For serious market participants, mastering F&O can be a game-changer in wealth creation and portfolio optimization.
Option Chain Terms – Comprehensive Explanation1. Strike Price
The strike price (also called exercise price) is the fixed price at which the buyer of an option can buy (call option) or sell (put option) the underlying asset upon expiry.
For call options, it is the price at which the underlying asset can be purchased.
For put options, it is the price at which the underlying can be sold.
Example:
If a stock trades at ₹5,000 and the call option has a strike price of ₹5,100:
Buying the call allows you to buy the stock at ₹5,100, regardless of the market price.
Buying the put allows you to sell the stock at ₹5,100, even if the market falls to ₹4,800.
Strike prices are usually set at regular intervals, known as strike intervals, e.g., ₹50, ₹100, ₹500 depending on the underlying asset.
2. Expiry Date
The expiry date is the date on which the option contract ceases to exist. Options in India typically expire on the last Thursday of the contract month.
European-style options can only be exercised on the expiry date.
American-style options can be exercised any time before or on the expiry date.
Expiry influences option premiums:
Longer expiries usually have higher premiums due to increased time value.
Short-dated options experience faster time decay (theta).
3. Option Type (Call / Put)
Options are classified into Call Options and Put Options:
Call Option: Right to buy the underlying at the strike price. Traders buy calls when expecting price increase.
Put Option: Right to sell the underlying at the strike price. Traders buy puts when expecting price decline.
The option chain displays both call and put options for each strike price side by side for easy comparison.
4. Premium / Last Traded Price (LTP)
The premium is the price paid by the buyer to purchase the option. On an option chain, this is displayed as the Last Traded Price (LTP).
Premium consists of Intrinsic Value (IV) and Time Value (TV):
Intrinsic Value: The difference between current underlying price and strike price (only if in-the-money).
Call Option: Current Price - Strike Price (if positive)
Put Option: Strike Price - Current Price (if positive)
Time Value: Extra value due to remaining time till expiry and volatility.
Options closer to expiry have lower time value.
Premium is highly influenced by volatility, time decay, and demand-supply.
5. Open Interest (OI)
Open Interest is the total number of outstanding contracts that have not been squared off (closed) or exercised.
High OI indicates liquidity and potential support/resistance levels at that strike.
Increasing OI along with rising prices may indicate bullish sentiment; decreasing OI may indicate weak trend.
Example:
If 5,000 call option contracts at strike ₹5,000 are outstanding, it means traders have taken positions worth 5,000 contracts, reflecting market interest in that price point.
6. Volume
Volume indicates the number of contracts traded during a particular session.
High volume reflects active trading and market participation.
Comparing volume with open interest helps gauge whether new positions are being initiated or closed.
Interpretation:
Rising price + rising volume = Strong bullish trend
Falling price + rising volume = Strong bearish trend
7. Implied Volatility (IV)
Implied Volatility (IV) is the market’s expectation of future volatility of the underlying asset.
Higher IV leads to higher premiums.
Lower IV means cheaper options, reflecting market stability.
IV is crucial for traders using strategies like straddles, strangles, and spreads because these depend on expected volatility movements.
Example:
If stock X has IV of 25%, traders expect the stock price to move significantly; if IV is 10%, minimal movement is anticipated.
8. Greeks (Delta, Gamma, Theta, Vega, Rho)
Greeks quantify risk and sensitivity of option prices to various factors:
Delta (Δ) – Measures change in option price per ₹1 change in underlying.
Call Delta ranges 0–1; Put Delta ranges 0 to -1.
Gamma (Γ) – Measures rate of change of delta.
Higher gamma = option more sensitive to price changes.
Theta (Θ) – Measures time decay; negative for long options.
Vega (V) – Measures sensitivity to implied volatility.
Rho (ρ) – Measures sensitivity to interest rates.
Greeks allow traders to hedge risks and plan multi-leg strategies effectively.
9. Bid and Ask
Bid Price: Price buyers are willing to pay for an option.
Ask Price (Offer Price): Price sellers are asking.
Bid-Ask Spread: Difference between bid and ask, reflecting liquidity.
A tight spread indicates active trading, while a wide spread indicates illiquid options.
10. In-The-Money (ITM), At-The-Money (ATM), Out-Of-The-Money (OTM)
ITM: Option has intrinsic value.
Call: Strike < Underlying Price
Put: Strike > Underlying Price
ATM: Strike price ≈ Underlying Price
OTM: Option has no intrinsic value.
Call: Strike > Underlying Price
Put: Strike < Underlying Price
These classifications help traders choose options based on risk appetite and strategy (speculation vs hedging).
Conclusion
An option chain is more than just numbers; it is a market sentiment map showing where traders are positioning themselves, potential support/resistance zones, and volatility expectations. Understanding terms like strike price, premium, open interest, volume, IV, Greeks, bid/ask, and moneyness enables traders to make informed decisions, structure strategies, and manage risk effectively.
By combining quantitative data (LTP, OI, volume) with qualitative interpretation (IV, Greeks), an option chain becomes an indispensable tool for both speculative and hedging strategies in the financial markets.
Brokers’ Impact on the Indian Trading Market1. Market Liquidity Enhancement
Brokers significantly enhance liquidity in the Indian trading market. By facilitating the buying and selling of securities, they ensure that there is a continuous flow of transactions, which allows investors to enter or exit positions with relative ease. High liquidity reduces the bid-ask spread and stabilizes prices, thereby creating a more efficient market. For example, large brokerage houses like Zerodha and ICICI Direct enable millions of retail investors to transact daily, adding substantial liquidity to both equity and derivatives markets.
2. Price Discovery and Market Efficiency
Brokers contribute directly to price discovery—the process through which the market determines the fair value of a security based on supply and demand. By executing trades promptly and efficiently, brokers help in reflecting accurate market sentiment. This becomes particularly crucial in volatile conditions, where brokers’ rapid response to client orders prevents large price gaps and contributes to overall market efficiency. Institutional brokers, due to their large order volumes, play a major role in signaling market trends.
3. Investor Accessibility and Participation
The democratization of the Indian trading market has largely been driven by brokers. Online brokerage platforms have reduced barriers to entry, enabling small retail investors to participate alongside institutional players. Features such as zero brokerage trading, mobile apps, and educational resources empower investors, broadening the market base. A larger investor base increases overall market participation, which in turn stabilizes market fluctuations and fosters long-term growth.
4. Advisory Services and Investment Guidance
Beyond executing trades, many brokers provide research, advisory services, and personalized investment guidance. They analyze market trends, corporate earnings, and macroeconomic developments, helping investors make informed decisions. These services influence trading patterns and investor behavior, shaping market trends indirectly. For instance, advisory reports recommending sectoral or stock-specific strategies can trigger substantial trading volumes in those assets.
5. Regulatory Compliance and Market Integrity
Brokers are the frontline enforcers of market regulations in India. Registered with SEBI (Securities and Exchange Board of India), they ensure compliance with trading norms, disclosure requirements, and anti-fraud measures. By adhering to regulatory frameworks, brokers maintain market integrity and protect investors from malpractices. Their role in preventing insider trading, front-running, and other unethical practices is crucial to maintaining confidence in the Indian financial system.
6. Technological Innovation and Market Modernization
Brokers have driven technological innovation in the Indian trading market. The introduction of electronic trading platforms, algorithmic trading services, and real-time market data feeds has revolutionized market operations. Brokers facilitate high-speed order execution, automated trading strategies, and advanced charting tools, allowing both retail and institutional investors to make rapid, informed decisions. These technological advancements enhance transparency and reduce operational inefficiencies in the market.
7. Market Stabilization During Volatility
During periods of high market volatility, brokers play a stabilizing role by managing order flows and advising clients prudently. Their risk management tools, such as stop-loss orders and portfolio diversification recommendations, help prevent panic selling and irrational market movements. By maintaining a balance between buyer and seller interest, brokers reduce extreme price swings and contribute to a resilient market structure.
8. Impact on Market Sentiment and Investor Psychology
Brokers influence not just trading volume, but also investor sentiment. Market rumors, analyst recommendations, and brokerage reports can shape investor perception, sometimes even more than fundamental data. Positive sentiment promoted by brokers can lead to bullish market trends, while negative sentiment may accelerate corrections. Understanding the psychological impact brokers have on trading decisions is key to evaluating their overall influence on market dynamics.
Conclusion
Brokers serve as the backbone of the Indian trading ecosystem. Their impact spans liquidity provision, price discovery, regulatory compliance, technological advancement, and investor education. Both traditional and modern brokerage models continue to shape market behavior, investor participation, and overall efficiency. As the Indian trading market grows in sophistication and scale, brokers’ role remains central in sustaining market stability, enhancing transparency, and promoting a culture of informed investing.

Trading with AI: Revolutionizing Financial Markets1. Understanding AI in Trading
AI in trading refers to the use of machine learning algorithms, deep learning, natural language processing, and other advanced computational methods to analyze market data and make trading decisions. Unlike traditional trading, which relies heavily on human intuition and manual analysis, AI trading systems can process massive datasets, detect patterns, and execute trades with minimal human intervention.
Key aspects include:
Machine Learning Models: Used to forecast price movements, volatility, and trading volume.
Algorithmic Trading: AI systems can automate order placement, optimizing timing and pricing.
Predictive Analytics: Historical market data is analyzed to predict future trends.
AI-powered trading aims to reduce human biases, improve decision speed, and increase profitability by leveraging data-driven insights.
2. Types of AI Trading Strategies
AI trading encompasses multiple strategies depending on market objectives and risk tolerance. Some of the most common strategies include:
Algorithmic Trading: AI algorithms execute high-frequency trades based on predefined rules and patterns.
Sentiment Analysis Trading: AI systems analyze news, social media, and financial reports to gauge market sentiment and predict price movements.
Predictive Modeling: Machine learning models predict asset prices using historical and real-time data.
Reinforcement Learning: AI agents learn optimal trading strategies through trial and error in simulated environments.
Each strategy has its own strengths and challenges. For instance, high-frequency trading (HFT) requires extremely low-latency systems, whereas sentiment analysis relies on natural language processing and advanced data scraping.
3. AI in Market Data Analysis
The financial market generates enormous volumes of structured and unstructured data daily, including stock prices, order books, news articles, social media posts, and economic indicators. Human traders cannot efficiently process this volume in real-time. AI excels in:
Pattern Recognition: Identifying recurring price patterns and anomalies.
Correlation Analysis: Detecting relationships between assets or markets that humans may overlook.
Event Impact Analysis: Evaluating how geopolitical events, policy changes, or corporate announcements affect markets.
By leveraging AI, traders gain actionable insights from complex datasets that improve the accuracy of predictions and reduce reaction time.
4. Risk Management and AI
Effective risk management is crucial in trading, and AI can significantly enhance it by:
Real-Time Monitoring: AI models track portfolio risks continuously and alert traders to potential exposure.
Dynamic Position Sizing: Algorithms can adjust trade sizes based on volatility and market conditions.
Predictive Risk Assessment: Machine learning models forecast potential losses and drawdowns using historical data.
AI reduces human error in risk assessment and allows traders to maintain discipline even during highly volatile market conditions.
5. Benefits of AI Trading
AI-driven trading offers several advantages over traditional methods:
Speed and Efficiency: AI systems can process data and execute trades in milliseconds, outperforming human reaction times.
Data-Driven Decisions: Trading decisions are based on analytics and predictive modeling rather than emotions or intuition.
Consistency: AI executes strategies consistently without being influenced by fear or greed.
Adaptive Learning: Machine learning models evolve and improve over time with more data.
Cost Reduction: Automated AI trading reduces the need for large trading teams and manual intervention.
These benefits make AI an indispensable tool for hedge funds, institutional traders, and increasingly, retail investors.
6. Challenges in AI Trading
Despite its advantages, AI trading comes with challenges:
Model Overfitting: AI models may perform well on historical data but fail in real market conditions.
Data Quality Issues: Inaccurate or incomplete data can lead to wrong predictions.
Market Impact: High-frequency AI trades can contribute to market volatility.
Regulatory Risks: Financial regulators are increasingly scrutinizing AI trading to prevent market manipulation and ensure transparency.
Technical Complexity: Developing, testing, and maintaining AI trading systems requires expertise in data science, finance, and computing infrastructure.
Traders must balance AI capabilities with careful oversight and risk management to mitigate these challenges.
7. AI in Retail Trading
Traditionally, AI trading was limited to institutional players due to high infrastructure costs. However, advances in cloud computing, APIs, and AI platforms have democratized access:
Robo-Advisors: AI-driven advisory platforms provide portfolio management, asset allocation, and personalized investment advice for retail investors.
AI Trading Bots: Retail traders can leverage automated bots to execute trades based on algorithms.
Sentiment-Based Trading Apps: Apps analyze social media sentiment and news to provide trading signals.
Retail adoption of AI trading has grown exponentially, allowing smaller investors to compete more effectively in financial markets.
8. The Future of AI in Trading
The future of trading is intertwined with AI. Key trends likely to shape AI trading include:
Integration of Quantum Computing: Accelerating AI model training and improving prediction accuracy.
Hybrid Models: Combining human judgment with AI analytics for optimal decision-making.
Ethical AI and Transparency: Regulators will demand explainable AI models to prevent unfair advantages and ensure market integrity.
Cross-Market AI Systems: AI will simultaneously analyze equities, commodities, forex, and crypto markets to identify arbitrage and hedging opportunities.
AI in ESG Investing: AI can assess environmental, social, and governance factors to guide sustainable investment decisions.
As AI continues to evolve, it will not only enhance trading efficiency but also reshape how markets operate globally.
Conclusion
AI trading represents a paradigm shift in financial markets, transforming how data is analyzed, trades are executed, and risks are managed. By combining speed, precision, and predictive power, AI allows traders—both institutional and retail—to make smarter, more informed decisions. However, successful AI trading requires robust infrastructure, high-quality data, careful risk management, and continuous monitoring to navigate challenges effectively.
The ongoing convergence of AI, big data, and financial markets promises a future where trading is faster, smarter, and increasingly automated, while still requiring human oversight to ensure ethical and strategic decision-making.
New Policies in the Indian Trade Market1. Launch of the Foreign Trade Policy (FTP) 2023–2028
In March 2023, the Government of India unveiled the new FTP, effective from April 1, 2023. This policy introduces several strategic initiatives:
Automation and Digitalization: The FTP emphasizes process re-engineering and automation to facilitate ease of doing business for exporters. It also focuses on emerging areas like dual-use high-end technology items under SCOMET, facilitating e-commerce export, and collaborating with States and Districts for export promotion.
One-Time Amnesty Scheme: To streamline operations, the FTP introduces a one-time Amnesty Scheme for exporters to close old pending authorizations and start afresh.
Support for MSMEs: The policy aims to support Micro, Small, and Medium Enterprises (MSMEs) by reducing the minimum export requirement for recognition as a status holder, allowing smaller exporters to achieve higher status and access benefits that lower transaction costs. Additionally, user charges under popular schemes like Advance Authorization and EPCG have been capped at ₹5,000, making it more affordable for MSMEs to export.
2. Enhancement of Export Incentives
The FTP 2023 introduces several measures to boost export incentives:
Remission of Duties and Taxes on Export Products (RoDTEP): The policy aims to enhance the RoDTEP scheme, which reimburses exporters for duties and taxes previously not refunded, thereby making Indian products more competitive in international markets.
Export Promotion Capital Goods (EPCG) Scheme: The FTP proposes to simplify the EPCG scheme, allowing exporters to import capital goods at zero customs duty, provided they meet specified export obligations.
Market Access Initiatives: The policy focuses on identifying and accessing new markets, particularly in regions like Africa, Latin America, and Southeast Asia, to diversify India's export destinations.
3. Promotion of E-Commerce Exports
Recognizing the growing importance of digital trade, the FTP 2023 outlines measures to promote e-commerce exports:
Simplification of Procedures: The policy aims to simplify customs procedures for e-commerce exports, reducing compliance burdens for small and medium-sized enterprises (SMEs).
Integration with Digital Platforms: The FTP encourages integration with global e-commerce platforms, facilitating easier access to international markets for Indian exporters.
Support for Startups: The policy provides support for startups engaged in e-commerce exports, including financial incentives and capacity-building programs.
4. Strengthening of Free Trade Agreements (FTAs)
India is actively pursuing and strengthening FTAs to enhance its trade relations:
India–EFTA Free Trade Agreement: The India–EFTA Free Trade Agreement, officially called the Trade and Economic Partnership Agreement (TEPA), is a comprehensive trade pact between the European Free Trade Association (EFTA) states (Iceland, Liechtenstein, Norway, and Switzerland) and the Republic of India. It was signed on March 10, 2024, after 16 years of intermittent negotiations, and is scheduled to enter into force on October 1, 2025. The agreement aims to eliminate or reduce tariffs on the majority of goods traded between India and the EFTA countries and to liberalize trade in services and investment. It also incorporates commitments on sustainable development and includes an unprecedented investment pledge of $100 billion from the EFTA side to India over 15 years.
India–UK Free Trade Agreement: Negotiations for an FTA with the United Kingdom are progressing, with expectations to finalize the agreement within the year. This FTA aims to boost bilateral trade and investment between the two nations.
5. Implementation of Anti-Dumping Measures
To protect domestic industries from unfair trade practices, India is implementing anti-dumping measures:
Solar Cell Imports: The Indian Commerce Ministry has proposed the imposition of an anti-dumping duty on solar cell imports from China for a duration of three years. This recommendation aims to protect domestic solar cell manufacturers from the adverse effects of low-cost Chinese imports, which are seen as a threat to local industry amid the rapid expansion of India's renewable energy sector.
Other Sectors: The government is reviewing other sectors for potential anti-dumping measures to safeguard domestic industries from unfair competition.
6. Digitalization of Trade Processes
The Indian government is focusing on digitalizing trade processes to enhance efficiency:
E-Bond System in Maharashtra: The Maharashtra government has introduced an electronic bond ('e-bond') system to replace traditional stamp paper bonds in import and export transactions. Launched on Friday, this digital initiative aims to streamline trade procedures, enhance business efficiency, and contribute to the modernization of the state's economy. The new system is expected to accelerate trade operations by increasing transparency and reducing reliance on physical documentation.
The Times of India
National Digital Trade Platform: The government is developing a National Digital Trade Platform to integrate various stakeholders in the trade ecosystem, including exporters, importers, logistics providers, and government agencies, to facilitate seamless trade operations.
7. Revised Foreign Borrowing Regulations
To enhance funding access for Indian companies, the Reserve Bank of India (RBI) has proposed significant changes to the country's corporate foreign borrowing regulations:
Increased Borrowing Limits: Companies would be allowed to borrow up to $1 billion or 300% of their net worth—whichever is higher—replacing the previous automatic route limit of $1.5 billion, which required specific approval for larger sums.
Removal of Cost Caps: The RBI intends to scrap cost caps on most external commercial borrowings (ECBs), allowing market-based interest rates rather than fixed ceilings aligned with global benchmarks.
Broadened Eligibility: Reforms would broaden the eligibility for both borrowers and lenders, permitting all India-incorporated entities, including those under financial restructuring or investigation, to raise overseas debt. Entities undergoing restructuring would require an approved resolution plan, while those under investigation must provide sufficient disclosures. Previously, only entities eligible for foreign direct investment could access foreign borrowings.
8. Simplification of Taxation for Foreign Firms
To improve the ease of doing business for foreign companies operating in India, NITI Aayog has proposed an optional presumptive taxation scheme:
Presumptive Taxation Scheme: NITI Aayog has proposed an optional presumptive taxation scheme for permanent establishments (PEs) of foreign companies operating in India. The goal of this proposal is to reduce bureaucratic discretion, minimize legal disputes, streamline compliance procedures, and safeguard government revenue. The simplified tax framework is expected to improve the ease of doing business for foreign firms in India, making the tax system more predictable and less cumbersome.
Conclusion
India's trade policy reforms in 2025 signify a strategic shift towards greater integration with the global economy, enhanced competitiveness, and a more conducive environment for businesses. By focusing on automation, digitalization, protective measures for domestic industries, and simplified regulatory frameworks, India is positioning itself as a formidable player in international trade. These initiatives are expected to not only boost exports but also attract foreign investment, thereby contributing to sustained economic growth and development.
