Part 1 Support and ResistanceIntroduction
Options trading is one of the most fascinating and versatile aspects of the financial markets. Unlike stocks, which give ownership in a company, or bonds, which provide fixed income, options are derivative instruments whose value is derived from an underlying asset such as stocks, indices, commodities, or currencies. They give traders the right, but not the obligation, to buy or sell the underlying asset at a predetermined price before a specific expiration date.
Because of this unique characteristic, options allow traders and investors to design strategies that suit a wide range of market conditions—whether bullish, bearish, or neutral. Through careful strategy selection, one can aim for limited risk with unlimited upside, hedge existing positions, or even profit from sideways markets where prices don’t move much.
This article explores options trading strategies in detail. We’ll cover the building blocks of options, common strategies, advanced combinations, and risk management. By the end, you’ll have a strong foundation to understand how professional traders use options to manage portfolios and generate returns.
1. Basics of Options
Before diving into strategies, it’s important to review some fundamental concepts.
1.1 What is an Option?
Call Option: Gives the holder the right (not obligation) to buy the underlying asset at a predetermined price (strike price) before or on expiration.
Put Option: Gives the holder the right (not obligation) to sell the underlying asset at a predetermined price before or on expiration.
1.2 Key Terms
Premium: The price paid to buy an option.
Strike Price: The agreed price to buy or sell the underlying.
Expiration Date: The last day the option can be exercised.
Intrinsic Value: Difference between underlying price and strike (if favorable).
Time Value: Portion of the premium that reflects time until expiration.
1.3 Options Styles
European Options: Exercisable only at expiration.
American Options: Exercisable any time before expiration.
Chart Patterns

Algorithmic & Quantitative TradingIntroduction
Trading has evolved dramatically over the past few decades. From the days of shouting bids in open-outcry pits to today’s ultra-fast trades executed in milliseconds, technology has transformed how markets operate. Two of the most important concepts in this transformation are algorithmic trading and quantitative trading.
At their core, both involve using mathematics, statistics, and technology to make trading decisions instead of relying purely on human judgment. While traditional traders might rely on intuition, news, and gut feeling, algo and quant traders build rules, models, and systems to trade with consistency and efficiency.
In this comprehensive guide, we’ll dive into:
The basics of algorithmic & quantitative trading.
Their differences and overlaps.
The strategies they use.
The technologies and tools behind them.
Risks, challenges, and regulatory aspects.
The future of algo & quant trading.
By the end, you’ll understand how these forms of trading dominate global financial markets today.
1. Understanding Algorithmic Trading
Definition
Algorithmic trading (often called algo trading) is the process of using computer programs and algorithms to automatically place buy or sell orders in financial markets. The algorithm follows a set of predefined instructions based on variables like:
Price
Volume
Timing
Technical indicators
Market conditions
The key idea is automation: once the rules are programmed, the system executes trades without manual intervention.
Why Algorithms?
Speed: Computers can process data and execute trades in milliseconds, far faster than humans.
Accuracy: Algorithms eliminate emotional decision-making.
Efficiency: They can scan thousands of instruments simultaneously.
Consistency: Strategies are applied without deviation or hesitation.
Examples of Algo Trading in Action
A program that buys stock when its 50-day moving average crosses above its 200-day moving average.
A system that places trades when prices deviate 1% from fair value in futures vs. spot markets.
High-frequency algorithms that profit from microsecond price differences across exchanges.
2. Understanding Quantitative Trading
Definition
Quantitative trading (quant trading) uses mathematical and statistical models to identify trading opportunities. Instead of intuition, it relies on data-driven analysis of price patterns, volatility, correlations, and probabilities.
In simple words:
Algo trading = How trades are executed.
Quant trading = How strategies are designed using math and data.
Many traders combine both: they design quantitative strategies and then execute them algorithmically.
Why Quantitative?
Markets are complex and noisy. Statistical models help filter out randomness.
Data-driven strategies can uncover hidden opportunities humans can’t easily spot.
Backtesting allows quants to test ideas on historical data before risking real money.
Quantitative Models Used
Mean Reversion Models – assuming prices return to their average over time.
Trend-Following Models – capturing momentum in markets.
Statistical Arbitrage Models – exploiting mispricings between correlated assets.
Machine Learning Models – using AI to adapt and predict market moves.
3. Algo vs. Quant Trading: Key Differences
Although often used interchangeably, there are subtle differences:
Feature Algorithmic Trading Quantitative Trading
Focus Execution of trades using automation Strategy design using math & statistics
Tools Algorithms, order routing systems Models, statistical analysis, simulations
Objective Speed, precision, automation Finding profitable patterns
Example VWAP (Volume Weighted Average Price) execution algorithm Pairs trading based on correlation
In practice, quant trading often leads to algo trading:
Quants design models.
Those models are turned into algorithms.
Algorithms execute trades automatically.
4. Key Strategies in Algorithmic & Quantitative Trading
Both algo and quant trading employ a wide variety of strategies. Let’s explore them in depth.
A. Trend-Following Strategies
Based on the belief that prices tend to move in trends.
Uses tools like moving averages, momentum indicators, and breakout levels.
Example: Buy when 50-day MA > 200-day MA (Golden Cross).
B. Mean Reversion Strategies
Assumes prices revert to their average over time.
Tools: Bollinger Bands, RSI, Z-score analysis.
Example: If stock deviates 2% from its mean, bet on reversal.
C. Arbitrage Strategies
Exploit price discrepancies between related securities.
Statistical Arbitrage – trading correlated assets (like Coke vs. Pepsi).
Merger Arbitrage – trading on price gaps during acquisitions.
Index Arbitrage – between index futures and underlying stocks.
D. Market-Making Strategies
Provide liquidity by continuously quoting buy and sell prices.
Profit comes from the bid-ask spread.
Requires ultra-fast systems.
E. High-Frequency Trading (HFT)
Subset of algo trading with extremely high speed.
Millisecond or microsecond execution.
Often used for arbitrage, market making, and exploiting tiny inefficiencies.
F. Machine Learning & AI-Based Strategies
Use large datasets and predictive models.
Neural networks, reinforcement learning, and deep learning applied to market data.
Example: Predicting volatility spikes or option price movements.
G. Execution Algorithms
These are not designed to predict prices but to optimize order execution:
VWAP (Volume Weighted Average Price) – executes in line with average traded volume.
TWAP (Time Weighted Average Price) – spreads order evenly over time.
Iceberg Orders – hides large orders by breaking them into small chunks.
5. Tools & Technologies Behind Algo & Quant Trading
Trading at this level requires robust infrastructure.
A. Data
Historical Data – for backtesting strategies.
Real-Time Data – for live execution.
Alternative Data – satellite images, social media, news sentiment, credit card usage, etc.
B. Programming Languages
Python – easy, rich libraries (pandas, numpy, scikit-learn).
R – strong for statistics and visualization.
C++/Java – high-speed execution.
MATLAB – research-heavy environments.
C. Platforms
MetaTrader, NinjaTrader, Amibroker – retail algo platforms.
Interactive Brokers API, FIX protocol – institutional-grade.
D. Infrastructure
Low-latency servers close to exchange data centers.
Cloud computing for scalability.
Databases (SQL, NoSQL) to handle terabytes of data.
6. Advantages of Algo & Quant Trading
Speed – execute trades in milliseconds.
Emotion-Free – avoids greed, fear, panic.
Backtesting – test before risking capital.
Diversification – manage thousands of instruments simultaneously.
Liquidity Provision – improves market efficiency.
Scalability – one strategy can be deployed globally.
7. Risks & Challenges
Despite advantages, algo & quant trading face serious risks.
A. Market Risks
Models might fail during extreme market conditions.
Example: 2008 financial crisis saw many quant funds collapse.
B. Technology Risks
Latency issues.
Software bugs leading to erroneous trades (e.g., Knight Capital loss of $440M in 2012).
C. Overfitting in Models
A strategy may look profitable in historical data but fail in real-time.
D. Regulatory Risks
Authorities impose strict rules to avoid market manipulation.
Example: SEBI in India regulates algo orders with checks on co-location and latency.
E. Ethical Risks
HFT firms sometimes exploit slower participants.
Raises fairness concerns.
8. Algo & Quant Trading in Global Markets
US & Europe: Over 60-70% of equity trading is algorithmic.
India: Around 50% of trades on NSE are algorithm-driven, with growing adoption.
Emerging Markets: Adoption is slower but rising as infrastructure improves.
Major players include:
Citadel Securities
Renaissance Technologies
Two Sigma
DE Shaw
Virtu Financial
9. Regulations Around Algo Trading
Different regulators have implemented measures:
SEC (US) – Market access rule, risk controls for algos.
MiFID II (Europe) – Transparency and monitoring of algo strategies.
SEBI (India) – Approval for brokers, limits on co-location, kill switches for runaway algos.
The aim is to balance innovation with market stability.
10. The Future of Algo & Quant Trading
The next decade will see major shifts:
AI & Deep Learning – self-learning trading models.
Quantum Computing – solving optimization problems faster.
Blockchain & Smart Contracts – decentralized, transparent execution.
Alternative Data Explosion – satellite data, IoT, ESG metrics.
Retail Algo Access – democratization through APIs and brokers.
Markets will become more data-driven, automated, and technology-intensive.
Conclusion
Algorithmic and quantitative trading represent the intersection of finance, mathematics, and technology. Together, they have reshaped global markets by making trading faster, more efficient, and more complex.
Algorithmic trading focuses on execution automation.
Quantitative trading focuses on designing mathematically-driven strategies.
From trend-following to machine learning, from VWAP execution to HFT, these approaches dominate today’s trading world.
However, with great power comes great risk—overreliance on models, tech glitches, and ethical debates remain.
Looking ahead, advancements in AI, alternative data, and quantum computing will further revolutionize how markets operate. For traders, investors, and policymakers, understanding these dynamics is crucial.
Trading Indicators & ToolsIntroduction
Trading in the stock market, forex, commodities, or crypto world is not just about intuition. Successful traders rely on indicators and tools that help them make more informed decisions. These tools act like a map and compass for navigating financial markets, providing signals about when to buy, when to sell, and when to stay on the sidelines.
Without indicators, trading would be like driving a car with your eyes closed – you might move forward, but you’d have no idea what lies ahead. Indicators, on the other hand, help you read market trends, identify opportunities, and manage risks effectively.
In this guide, we’ll explore trading indicators and tools in detail – their types, how they work, strengths and weaknesses, and how traders can combine them for better results.
Chapter 1: What Are Trading Indicators?
A trading indicator is a mathematical calculation based on price, volume, or open interest of a security. These indicators help traders understand market psychology, supply and demand, and price movement patterns.
Indicators are broadly divided into:
Leading Indicators – Predict future price movements (e.g., RSI, Stochastic Oscillator).
Lagging Indicators – Confirm trends after they occur (e.g., Moving Averages, MACD).
Simply put:
Leading indicators = prediction.
Lagging indicators = confirmation.
Chapter 2: Types of Trading Indicators
Let’s explore the major categories.
1. Trend Indicators
These show the direction of the market – whether it’s going up, down, or sideways.
Moving Averages (SMA, EMA): Smooth out price data to identify the overall direction.
MACD (Moving Average Convergence Divergence): Combines moving averages to show trend strength and direction.
Parabolic SAR: Dots above/below candles that signal trend direction and potential reversals.
Use: Trend indicators help traders stay aligned with the broader market direction.
2. Momentum Indicators
These measure the speed of price movements.
RSI (Relative Strength Index): Identifies overbought (>70) and oversold (<30) levels.
Stochastic Oscillator: Compares closing price to price range over time.
CCI (Commodity Channel Index): Detects price deviations from historical averages.
Use: Momentum tools are useful for spotting reversals or confirming trends.
3. Volatility Indicators
These track how much prices are moving up and down.
Bollinger Bands: Price channels based on standard deviation from a moving average.
ATR (Average True Range): Measures overall market volatility.
Keltner Channels: Similar to Bollinger Bands but based on ATR.
Use: Volatility tools help traders decide on stop-loss levels and position sizing.
4. Volume Indicators
These measure the strength of price movements by analyzing trading volume.
OBV (On-Balance Volume): Adds/subtracts volume to confirm price trends.
VWAP (Volume Weighted Average Price): Average price adjusted by volume – key for intraday traders.
Chaikin Money Flow: Tracks buying and selling pressure.
Use: Volume indicators confirm whether trends are strong or weak.
5. Support & Resistance Tools
These identify price zones where markets historically pause or reverse.
Pivot Points: Key levels based on previous high, low, and close.
Fibonacci Retracement: Levels (23.6%, 38.2%, 61.8%) used to predict pullbacks.
Trendlines: Simple but powerful lines drawn across highs/lows.
Use: Excellent for entry, exit, and stop-loss planning.
Chapter 3: Popular Trading Indicators Explained
1. Moving Averages (MA)
Simple Moving Average (SMA): Average of closing prices over a period.
Exponential Moving Average (EMA): Gives more weight to recent prices.
Traders often use Golden Cross (50-day MA crosses above 200-day MA) as bullish and Death Cross as bearish.
2. Relative Strength Index (RSI)
Ranges between 0–100.
Above 70 → Overbought (price may fall).
Below 30 → Oversold (price may rise).
RSI is best used with trend analysis, not as a standalone.
3. Bollinger Bands
Middle band = 20-day SMA.
Upper/lower bands = ±2 standard deviations.
When price touches upper band → Overbought.
When price touches lower band → Oversold.
Traders use “Bollinger Band Squeeze” to spot breakout opportunities.
4. MACD (Moving Average Convergence Divergence)
MACD Line = 12-day EMA – 26-day EMA.
Signal Line = 9-day EMA of MACD.
Histogram shows difference between them.
Crossovers are key signals:
MACD > Signal Line = Bullish.
MACD < Signal Line = Bearish.
5. Fibonacci Retracement
Traders apply Fibonacci ratios (23.6%, 38.2%, 50%, 61.8%) on charts to find support/resistance. It works because many traders watch these levels, creating self-fulfilling prophecies.
6. VWAP (Volume Weighted Average Price)
Commonly used by institutional traders.
VWAP acts as a benchmark price for the day.
Above VWAP → Bullish; Below VWAP → Bearish.
Chapter 4: Essential Trading Tools
Indicators are only half the story. Traders also need tools for execution, analysis, and risk management.
1. Charting Platforms
TradingView, MetaTrader, Thinkorswim, Zerodha Kite.
Offer real-time charts, indicators, drawing tools.
2. Screeners
Stock screeners filter stocks based on volume, price, RSI, moving averages, etc.
Popular: Finviz, Chartink, Screener.in.
3. Order Types & Tools
Market Order, Limit Order, Stop-Loss, Trailing Stop.
Tools like OCO (One Cancels Other) help automate exits.
4. Risk Management Tools
Position size calculators.
Portfolio trackers.
Risk-reward ratio analyzers.
5. News & Data Tools
Bloomberg, Reuters, Economic Calendars.
Vital for event-driven trading.
Chapter 5: How to Use Indicators Effectively
Don’t overload your chart – Too many indicators cause confusion.
Combine wisely – Mix a trend indicator (MA) with a momentum tool (RSI) for confirmation.
Backtest strategies – Check how indicators would have performed historically.
Understand false signals – Indicators aren’t 100% accurate; use stop-loss.
Adapt to market type – Trend indicators work best in trending markets; oscillators in sideways markets.
Chapter 6: Combining Indicators into Strategies
Here are a few proven combinations:
1. Moving Average + RSI
Use MA for trend direction.
Enter when RSI confirms overbought/oversold within trend.
2. Bollinger Bands + MACD
Bands identify volatility.
MACD confirms direction of breakout.
3. Fibonacci + Volume
Use Fibonacci retracement to identify pullback levels.
Confirm with OBV or VWAP for strong buying/selling activity.
Chapter 7: Pros & Cons of Trading Indicators
✅ Advantages
Simplify decision-making.
Provide objective entry/exit signals.
Help manage risk.
Can be automated into strategies.
❌ Disadvantages
Lagging nature (esp. moving averages).
False signals in choppy markets.
Over-reliance can ignore fundamentals.
Need practice and discipline.
Chapter 8: Real-World Application
Day Traders: Focus on VWAP, RSI, Bollinger Bands for intraday moves.
Swing Traders: Rely on Moving Averages, MACD, Fibonacci for 3–15 day trades.
Long-Term Investors: Use 200-day MA, volume indicators, and trendlines.
Algo Traders: Automate strategies using multiple indicators.
Chapter 9: Risk Management with Indicators
Indicators are not just for entries but also for protecting capital.
ATR helps set stop-loss based on volatility.
Support/resistance from Fibonacci prevents premature exits.
Volume indicators confirm whether risk-taking is justified.
Chapter 10: Future of Trading Indicators & Tools
With AI and machine learning, indicators are evolving into smarter systems:
Predictive analytics based on big data.
Sentiment analysis using social media.
AI-driven bots combining multiple signals.
Yet, the core remains the same: indicators help make sense of price action.
Conclusion
Trading indicators and tools are like a trader’s toolbox. Each tool has a purpose – some measure trend, some momentum, some volume, some volatility. The key is not to use all at once, but to understand each, master a few, and combine them smartly.
The most successful traders don’t rely on magic formulas; they rely on discipline, strategy, and the right mix of indicators and tools. Indicators guide you, but your psychology, money management, and consistency decide whether you succeed or fail.
Part 1 Master Candlestick PatternOptions in the Indian Stock Market
In India, options trading is booming, especially in:
Nifty & Bank Nifty (Index options).
Stock Options (Reliance, TCS, HDFC Bank, etc.).
👉 Interesting fact: Over 90% of trading volume in NSE comes from options today.
Expiry days (Thursdays for weekly index options) see massive action, as traders bet on final movements.
The Power of Weekly Options
Earlier, only monthly options were available. Now NSE has weekly expiries for Nifty, Bank Nifty, and even stocks.
Weekly options = cheaper premiums.
Traders use them for intraday or short-term bets.
But time decay is very fast.

Part 4 Institutional Trading Simple Option Strategies
Options allow creativity. Instead of just buying/selling, traders create strategies by combining calls & puts.
a) Protective Put
Buy stock + Buy Put option = Insurance against downside.
b) Covered Call
Own stock + Sell Call option = Earn income if stock stays flat.
c) Straddle
Buy Call + Buy Put (same strike, same expiry) = Profit from big moves either way.
d) Strangle
Buy OTM Call + OTM Put = Cheaper than straddle but requires bigger move.
e) Iron Condor
Sell OTM Call + OTM Put, while buying further OTM options = Profit if market stays in range.
These are just a few. Professional traders use dozens of strategies depending on market condition.
Risks in Options Trading
Options are attractive, but risky too.
Time Decay (Theta) → Every day, options lose value as expiry approaches.
Wrong Direction → If your view is wrong, you lose the premium.
Liquidity Risk → Some strikes may have no buyers/sellers.
Over-Leverage → Small premium tempts traders to overtrade, leading to big losses.

Part 2 Ride The Big MovesIntroduction to Options Trading
When people think about the stock market, they usually think about buying and selling shares. But there’s another side of the market that’s both exciting and complex—derivatives trading.
An option is one such derivative. Instead of directly buying a share, you buy a contract that gives you the right (but not the obligation) to buy or sell the share at a certain price within a certain time.
Sounds interesting? Let’s make it simple with an analogy.
👉 Imagine you’re interested in buying a car priced at ₹10 lakh. But you’re not sure if you’ll have the money or if the price will change in the future. The dealer says:
Pay me ₹10,000 now, and I’ll give you the right to buy the car at ₹10 lakh anytime in the next three months.
If car prices rise to ₹11 lakh, you can still buy at ₹10 lakh and save ₹1 lakh.
If prices fall to ₹9 lakh, you can simply let the contract expire and lose only your ₹10,000 advance.
This advance is like the option premium, and the contract is your option.
That’s the essence of options trading—buying rights, not obligations.
Basics of Options
Options are broadly of two types:
Call Option (CE) → Right to buy an asset at a fixed price before expiry.
Put Option (PE) → Right to sell an asset at a fixed price before expiry.
Example:
Call Option: You buy a Reliance 2500 CE (Call Option) at a premium of ₹50.
If Reliance rises to ₹2600, you can still buy it at ₹2500 and gain ₹100 (minus premium).
If Reliance falls to ₹2400, you won’t exercise it and lose only ₹50.
Put Option: You buy a Reliance 2500 PE at a premium of ₹40.
If Reliance falls to ₹2400, you can sell at ₹2500 (gain ₹100).
If Reliance rises to ₹2600, you won’t exercise it and lose only ₹40.
This is why options are considered insurance tools in markets.

AI, EV & Green Energy Stocks1. Introduction
In the past decade, three sectors have captured the imagination of investors, innovators, and governments worldwide: Artificial Intelligence (AI), Electric Vehicles (EVs), and Green Energy. These industries are not just technology-driven but are also seen as pillars of the global economic transformation toward a sustainable, digital, and cleaner future.
When we talk about stock markets, these sectors often come up as “the future growth engines”. Investors see them as multi-trillion-dollar opportunities. Governments view them as critical for reducing climate risks, increasing energy independence, and creating jobs. Businesses, on the other hand, race to gain market share in these fast-changing fields.
This article will give you a deep dive into AI, EV, and Green Energy stocks—covering what they are, why they are booming, which companies dominate the space, what opportunities and risks exist for investors, and how the future may look.
2. Artificial Intelligence (AI) Stocks
2.1 What is AI?
Artificial Intelligence is the use of algorithms, machine learning, and data processing to mimic human intelligence. From chatbots like me, to self-driving cars, predictive analytics, robotics, healthcare diagnostics, and financial trading systems, AI is everywhere.
2.2 Growth of AI Market
The AI industry is projected to cross USD 1.8 trillion by 2030.
Major drivers: cloud computing, data explosion, 5G rollout, and automation.
Governments (US, China, India, EU) are investing billions in AI R&D.
2.3 AI Stocks – Global Leaders
NVIDIA (NVDA) – Leading GPU maker powering AI models and data centers.
Microsoft (MSFT) – AI-powered cloud services (Azure), OpenAI partnership.
Alphabet (GOOGL) – AI search, DeepMind, Google Cloud AI tools.
Meta Platforms (META) – AI in social media, advertising, AR/VR.
Amazon (AMZN) – AI in logistics, Alexa, AWS AI tools.
2.4 AI Stocks – Indian Players
Tata Elxsi – AI in automotive and healthcare.
Happiest Minds Technologies – AI and analytics solutions.
Persistent Systems – AI-driven digital transformation.
Infosys & TCS – AI in IT services and automation.
2.5 Why AI Stocks Are Attractive
AI is not optional; it’s becoming a necessity for all industries.
Productivity boost across finance, healthcare, retail, and manufacturing.
Long-term exponential growth.
2.6 Risks
Regulation concerns (AI misuse, data privacy).
High R&D costs.
Rapid technological changes making companies obsolete.
3. Electric Vehicle (EV) Stocks
3.1 What are EVs?
Electric Vehicles run on electricity instead of fossil fuels. They include battery electric vehicles (BEVs), plug-in hybrid EVs (PHEVs), and hydrogen fuel cell vehicles.
3.2 Why EVs are Booming
Global climate change concerns.
Push for net-zero emissions by 2050.
Rising oil prices and government subsidies.
Battery technology becoming cheaper.
3.3 EV Stocks – Global Leaders
Tesla (TSLA) – The most famous EV maker.
BYD (China) – Warren Buffett-backed, world’s largest EV company.
NIO, Xpeng, Li Auto – Chinese EV innovators.
Rivian, Lucid Motors – US EV startups.
Ford, General Motors, Volkswagen – Traditional automakers going electric.
3.4 EV Stocks – Indian Players
Tata Motors – Market leader in India’s EV space.
Mahindra & Mahindra – Developing SUVs and commercial EVs.
Olectra Greentech – Electric buses.
Exide Industries & Amara Raja Batteries – Battery manufacturers.
Okinawa, Ather, Ola Electric (unlisted startups) – 2W EV space.
3.5 EV Ecosystem Stocks
It’s not just carmakers:
Battery producers (CATL, Panasonic, Exide).
Charging infrastructure (ChargePoint, EVgo).
Lithium miners (Albemarle, SQM).
3.6 Why EV Stocks are Attractive
EVs expected to reach 50% of all new car sales by 2035.
Government subsidies & policies accelerating adoption.
Ecosystem (batteries, charging, software) opening opportunities.
3.7 Risks
High competition and thin profit margins.
Battery raw material shortages (lithium, cobalt, nickel).
Dependence on government incentives.
Technological risks (hydrogen vs. battery EV debate).
4. Green Energy Stocks
4.1 What is Green Energy?
Green Energy refers to renewable energy sources that are environmentally friendly, such as:
Solar power
Wind energy
Hydropower
Biomass energy
Hydrogen fuel
4.2 Growth Drivers
Climate change urgency.
Declining cost of solar & wind power.
International commitments (Paris Agreement, COP summits).
Energy independence & reduced reliance on fossil fuels.
4.3 Green Energy Stocks – Global Leaders
NextEra Energy (NEE) – World’s largest renewable energy company.
Orsted (Denmark) – Offshore wind leader.
Iberdrola (Spain) – Green energy giant.
Brookfield Renewable Partners – Hydropower and solar.
First Solar (US) – Leading solar panel maker.
4.4 Green Energy Stocks – Indian Players
Adani Green Energy – Solar and wind projects.
Tata Power Renewables – Solar rooftops, EV charging.
Suzlon Energy – Wind energy solutions.
NTPC Green Energy – Government-backed renewable arm.
JSW Energy (Renewable arm) – Expanding solar & wind projects.
4.5 Hydrogen Economy
Green hydrogen considered future fuel.
Indian companies like Reliance Industries & Adani Group investing heavily.
4.6 Why Green Energy Stocks are Attractive
Governments worldwide investing trillions in green infrastructure.
Renewable energy cheaper than coal in many countries.
Long-term demand due to net-zero commitments.
4.7 Risks
High upfront capex.
Intermittency (solar depends on sunlight, wind depends on wind).
Policy and subsidy dependency.
Competition driving down margins.
5. How These Sectors Interconnect
Interestingly, AI, EV, and Green Energy are interconnected:
AI helps optimize energy grids, manage EV batteries, and improve renewable energy efficiency.
EVs require renewable energy to be truly sustainable.
Green energy requires AI for forecasting demand and efficiency.
Together, they represent the technology + sustainability revolution.
6. Global Trends Driving AI, EV & Green Energy Stocks
Decarbonization goals – Countries targeting net-zero emissions by 2050.
Digital transformation – AI is central to Industry 4.0.
Geopolitics – Energy independence from oil-exporting nations.
Technological breakthroughs – Cheaper batteries, efficient solar panels, advanced AI chips.
Investor Sentiment – ESG (Environmental, Social, Governance) investing is booming.
7. Indian Perspective
India is at the center of these revolutions:
AI: India aims to become a global AI hub with initiatives like Digital India & AI for All.
EV: Government’s FAME scheme and PLI incentives push adoption.
Green Energy: Target of 500 GW renewable energy capacity by 2030.
This means Indian AI, EV, and Green Energy stocks are poised for multi-decade growth.
8. Investment Strategies
8.1 Direct Equity
Invest in listed companies like NVIDIA, Tesla, Adani Green, Tata Motors.
8.2 ETFs & Mutual Funds
AI ETFs: Global X Robotics & AI ETF.
EV ETFs: Global X Autonomous & EV ETF.
Renewable ETFs: iShares Global Clean Energy ETF.
8.3 Thematic Funds in India
Motilal Oswal EV & Green Energy Fund.
Mirae Asset Global Electric & Autonomous Vehicles ETF.
8.4 Diversification
Invest across AI, EV, and green energy to reduce risk.
9. Risks for Investors
Valuation risk: Many stocks are highly priced (Tesla, NVIDIA).
Regulatory risk: AI misuse, EV subsidies, renewable tariffs.
Technological disruption: New innovations can make existing ones obsolete.
Market volatility: Being future-oriented, these sectors are sensitive to hype cycles.
10. Future Outlook (2025–2040)
AI: Expected to be integrated into every industry—healthcare, finance, defense, manufacturing.
EV: By 2030, 1 in 3 new cars sold globally will be electric.
Green Energy: Renewable energy to dominate 70%+ of electricity generation by 2050.
India: Could become a global leader in EV 2-wheelers and solar power.
Conclusion
AI, EV, and Green Energy are not just sectors; they are megatrends shaping the 21st century.
They represent a fusion of technology, sustainability, and economic opportunity.
For investors, these sectors offer multi-decade growth potential, but also come with risks of hype, overvaluation, and policy dependence. The smart way to approach them is through diversification, long-term horizon, and selective investing in leaders and innovators.
If the 20th century belonged to oil, automobiles, and traditional industries, the 21st century clearly belongs to AI, EVs, and Green Energy.
PSU & Infrastructure RallyIntroduction
The Indian stock market often moves in cycles—sometimes technology stocks lead, sometimes consumption stocks take the front seat, and sometimes financials dominate the headlines. In recent years, one of the strongest and most eye-catching trends has been the rally in Public Sector Undertakings (PSUs) and Infrastructure stocks.
This rally has surprised many investors. For decades, PSU stocks were treated as “slow movers,” known for dividends but not for sharp price appreciation. Infrastructure companies also had their share of challenges—debt burdens, project delays, and regulatory hurdles. Yet, from 2020 onwards, both these sectors have staged a powerful comeback, creating significant wealth for investors.
In this essay, we will break down the reasons behind the PSU & Infrastructure rally, the role of government policies, investor psychology, macroeconomic conditions, and future outlook. We will also examine challenges, risks, and strategies investors can consider.
1. Understanding PSU & Infrastructure Sectors
1.1 What are PSUs?
Public Sector Undertakings (PSUs) are companies where the Government of India holds a majority stake (usually above 51%). These companies were originally created to control strategic industries, ensure employment, and provide services to the public.
They operate across sectors:
Energy & Oil: ONGC, Oil India, IOC, BPCL, HPCL.
Banking & Financials: SBI, Bank of Baroda, PNB, LIC.
Power & Utilities: NTPC, Power Grid, NHPC, SJVN.
Defence & Engineering: HAL, BEL, BEML, Cochin Shipyard.
Infrastructure-linked: IRCTC, IRFC, RVNL, NBCC.
For a long time, PSU stocks were considered "value traps." Investors believed these companies were controlled by government decisions rather than pure profit motives. But things have started to change.
1.2 What is the Infrastructure Sector?
The infrastructure sector includes companies involved in building and maintaining physical systems like roads, railways, airports, ports, bridges, housing, water supply, and energy projects.
Key players include:
Construction companies: L&T, NCC, KNR Construction.
Railways & Transport: RVNL, IRCON, IRFC.
Power & Energy Infrastructure: NTPC, Adani Transmission, Power Grid.
Cement & Steel (linked to infra growth): UltraTech Cement, JSW Steel.
Infrastructure is often called the backbone of the economy. A country’s GDP growth depends heavily on the quality of its infrastructure.
2. Why Are PSU & Infrastructure Stocks Rallying?
The rally is not a coincidence. Several structural, policy-driven, and global factors are working together. Let’s break them down:
2.1 Government Push on Capital Expenditure (Capex)
One of the biggest drivers is the Indian government’s consistent increase in infrastructure spending.
In Union Budgets (2022–2025), capital expenditure has grown at double-digit rates.
The government has allocated massive funds for roads, highways, railways, and renewable energy.
The National Infrastructure Pipeline (NIP) plans ₹111 lakh crore investment in infrastructure between 2019 and 2025.
Programs like Gati Shakti, Smart Cities Mission, and Bharatmala are boosting construction activity.
This creates a multiplier effect: cement demand rises, construction companies get more projects, railway stocks gain, and PSU banks benefit by financing these projects.
2.2 Revival of PSU Banks
PSU banks, once seen as weak due to Non-Performing Assets (NPAs), have staged a dramatic recovery.
Bad loans have reduced significantly.
Credit growth is at record highs (double-digit growth in 2023–25).
PSU banks are reporting all-time high profits.
With financial health improving, investors’ confidence in PSUs has returned.
Since banks are the backbone of financing infrastructure projects, their revival further fuels the rally.
2.3 Defence & Strategic Importance
Global geopolitical tensions have increased defence spending worldwide. India, too, is focusing on self-reliance in defence (Atmanirbhar Bharat).
Companies like HAL, BEL, Mazagon Dock, Cochin Shipyard have seen massive order inflows.
Defence PSUs are reporting strong earnings and full order books for the next decade.
The export market is also opening up—India is now exporting defence equipment to friendly nations.
This has turned defence PSUs into multi-baggers in recent years.
2.4 Disinvestment & Privatisation Story
For years, the government has been trying to monetise and privatise PSU assets.
Strategic sales like Air India have boosted sentiment.
LIC IPO brought renewed attention to PSU space.
The market believes future disinvestments (BPCL, Shipping Corporation, etc.) can unlock hidden value.
This narrative has created speculative interest, which supports price rallies.
2.5 Dividend Yield Attraction
Many PSU companies offer very high dividend yields (4–8%), much higher than bank deposits.
In times of global uncertainty, foreign investors look for safe, stable income—PSUs fit this profile. When combined with growth in earnings, dividend-paying PSUs become doubly attractive.
2.6 Railways & Infra Boom
Railway-linked stocks like RVNL, IRCON, IRFC, RailTel have been some of the biggest gainers.
Indian Railways is undergoing modernization at an unprecedented scale.
Projects like Vande Bharat trains, electrification, freight corridors, and station redevelopment are attracting massive investments.
These companies are reporting record order books.
This has triggered a railways mini-rally within the broader infrastructure rally.
2.7 Global Factors
Global trends are also playing a role:
China+1 Strategy: Many global companies are diversifying away from China, boosting demand for Indian infrastructure.
Commodity Cycle: Steel, cement, and energy cycles support infra companies’ growth.
Geopolitical Risks: Investors view India as a safe growth story compared to volatile markets.
3. Investor Psychology Behind the Rally
The PSU & Infrastructure rally is not just about fundamentals—it’s also about changing perceptions.
Earlier: Investors believed PSUs = inefficient + slow-moving.
Now: Investors see them as undervalued, dividend-paying, and backed by government growth plans.
Retail investors, especially in India, have driven momentum. With railway and defence PSUs showing 10x to 20x returns in a few years, fear of missing out (FOMO) has pulled in more buyers.
4. Risks & Challenges in PSU & Infra Rally
No rally is risk-free. Investors must remain aware of challenges:
Government Interference – PSU companies may prioritize social objectives over profits.
Cyclical Nature – Infra and PSU rallies depend heavily on government spending; if budgets tighten, growth may slow.
Execution Delays – Infra projects face land acquisition, legal, and environmental delays.
Global Slowdown – If global demand weakens, exports and commodity-linked infra stocks may suffer.
Valuation Concerns – Many PSU stocks have already rallied 200–500%. At some point, valuations may look stretched.
5. Future Outlook
Despite risks, the outlook for PSU & Infrastructure remains structurally positive:
India aims to become a $5 trillion economy—this is impossible without strong infra.
The government’s focus on Make in India, Atmanirbhar Bharat, and Defence exports supports PSU companies.
Digital infrastructure (5G rollout, Smart Cities) creates new opportunities.
Renewable energy push (solar, wind, hydro) benefits power PSUs like NTPC, NHPC.
In short, this is not just a short-term rally—it is a structural growth story with long-term potential.
6. How Investors Can Approach This Rally
For investors, the key is to approach with strategy and caution:
Focus on Leaders – Instead of chasing every PSU, stick to strong companies with robust fundamentals (SBI, NTPC, BEL, HAL, RVNL, L&T).
Look for Long-Term Themes – Defence, railways, power transmission, renewable energy are structural stories.
Dividend + Growth Combo – PSUs with both high dividend yields and growth potential are safer bets.
Avoid Overvaluation – Don’t enter after massive rallies; wait for corrections.
Diversify – Mix infra PSUs with private players (like L&T, Adani Ports) to reduce risk.
7. Case Studies of Recent Winners
7.1 Hindustan Aeronautics Ltd (HAL)
Once ignored, HAL is now a defence giant with export opportunities.
Stock has given 10x returns in 5 years.
7.2 Rail Vikas Nigam Ltd (RVNL)
Benefited from railway modernization.
Stock surged over 20x from 2020–2025.
7.3 SBI & Other PSU Banks
Recovered from NPAs.
Posting record profits, stock prices doubled/tripled.
7.4 NTPC & Power Grid
Benefiting from India’s massive renewable energy targets.
Stable dividend + growth.
These examples show why the rally has captured public attention.
8. Conclusion
The PSU & Infrastructure Rally is one of the most defining themes in the Indian stock market in recent years. What began as a quiet recovery in undervalued PSU banks and infra companies has turned into a full-blown rally fueled by:
Government capex push,
Defence modernization,
Railway expansion,
Revival of PSU banks,
Strong dividend yields,
Disinvestment hopes.
The rally has redefined investor sentiment towards PSUs, turning them from neglected assets into market favorites.
That said, investors must remain mindful of risks—government policies, project delays, or global slowdowns can temporarily derail the momentum.
But structurally, the story remains strong: India’s journey to a $5 trillion economy cannot happen without PSU & infrastructure growth. For long-term investors, this space offers both stability and growth potential—a rare combination.
IPOs & SME IPOs BoomIntroduction
The world of stock markets has always fascinated investors, traders, and even common people who might not actively trade but follow financial news. One term that grabs headlines again and again is IPO (Initial Public Offering). An IPO is when a private company decides to raise money from the public by offering its shares for the first time.
In recent years, especially in India and several emerging markets, IPOs have witnessed a boom. Not just large companies, but even SMEs (Small and Medium Enterprises) are coming forward to list themselves on SME exchanges through SME IPOs.
This IPO & SME IPO boom reflects not only investor enthusiasm but also the maturity of financial markets, government policies, and the rising appetite of retail investors who now want to participate in the growth stories of businesses right from the early stage.
This article will give you a comprehensive 3000-word explanation of IPOs and SME IPOs boom, in simple yet detailed language.
Part 1: What is an IPO?
Definition
An IPO (Initial Public Offering) is the process by which a private company offers its shares to the public for the first time. After listing, the company’s shares can be traded on stock exchanges such as NSE or BSE in India, or NASDAQ and NYSE in the US.
Key Objectives of an IPO
Raising Capital – To fund expansion, repay debt, or improve working capital.
Brand Visibility – Being listed increases brand credibility.
Liquidity for Promoters – Founders and early investors can sell part of their stake.
Public Participation – Gives retail and institutional investors a chance to own part of the company.
IPO Process in Brief
Appointing Merchant Bankers (Lead Managers)
Regulatory Approval (SEBI in India, SEC in US, etc.)
Draft Red Herring Prospectus (DRHP) Filing
IPO Marketing & Roadshows
Price Band & Book-Building
IPO Subscription by Investors
Allotment & Refunds
Listing on Stock Exchange
Part 2: What is an SME IPO?
Definition
An SME IPO is an IPO specifically designed for Small and Medium Enterprises. These are businesses that may not yet have the size or turnover to list directly on the main board of the stock exchange.
India has two major SME platforms:
BSE SME Exchange
NSE EMERGE
Key Features of SME IPOs
Minimum post-issue paid-up capital: ₹3 crore.
Investors: Retail, HNIs, and institutional investors.
Lower compliance requirements compared to mainboard IPOs.
Ticket size for investment is usually smaller.
Acts as a bridge for small businesses to access capital markets.
Objectives of SME IPOs
To provide SMEs with growth capital.
To create liquidity for promoters and investors.
To give SMEs recognition and credibility.
To act as a stepping stone for listing on the main board in future.
Part 3: Why IPOs & SME IPOs are Booming
The boom in IPOs and SME IPOs can be attributed to several factors:
1. Strong Investor Participation
Retail investors have become more active in financial markets, thanks to digital trading apps, UPI-based IPO bidding, and low-cost brokerage accounts.
2. Liquidity in the Market
Post-pandemic, central banks infused liquidity into the financial system. Investors had surplus money to deploy in equity markets, fueling IPO demand.
3. India’s Economic Growth Story
India is among the fastest-growing economies. Global investors want to participate in India’s growth via IPOs.
4. Success Stories of Past IPOs
Many IPOs delivered stellar listing gains (Zomato, Nykaa, MapmyIndia, IRCTC, etc.), creating investor confidence.
5. SME Sector Growth
SMEs form the backbone of India’s economy, contributing nearly 30% to GDP and 40% to exports. SME IPOs are now seen as a lucrative way to fund this growth.
6. Regulatory Push
SEBI and exchanges have simplified rules, making IPO participation easier for retail investors and listing smoother for companies.
7. Rising Financial Awareness
Mutual funds, social media, and financial influencers have educated people about IPO investing.
Part 4: Benefits of IPOs & SME IPOs
For Companies
Access to large capital pool.
Improved brand image and trust.
Ability to attract and retain talent (ESOPs).
Liquidity for promoters.
For Investors
Opportunity to invest early in a growing company.
Potential for high listing gains.
Long-term wealth creation.
Portfolio diversification.
For the Economy
Mobilizes savings into productive assets.
Boosts entrepreneurship.
Strengthens capital markets.
Enhances corporate governance.
Part 5: Risks & Challenges
Despite the boom, IPOs and SME IPOs carry risks:
Overvaluation – Companies may come at expensive valuations.
Market Volatility – IPO success depends heavily on market sentiment.
Liquidity Risks in SME IPOs – Trading volumes are often lower.
Short-Term Speculation – Many investors enter just for listing gains.
Regulatory Burden – SMEs may struggle with compliance post-listing.
Part 6: Case Studies of IPO & SME IPO Boom
Mainboard IPOs (India)
Zomato (2021) – One of India’s most hyped IPOs, raised ₹9,375 crore.
Nykaa (2021) – Strong listing, became a household name.
LIC (2022) – India’s biggest IPO, raised ₹21,000+ crore.
SME IPOs (India)
Droneacharya Aerial Innovations (2022) – Gained over 100% on listing.
Eighty Jewellers, Global Surfaces, Infollion Research – Delivered strong returns.
Many SME IPOs in 2023–24 have been oversubscribed by 100x+.
Part 7: Global IPO Boom
It’s not just India — worldwide IPO activity has seen cycles of booms:
US Tech IPOs like Airbnb, Uber, Rivian.
China’s STAR Market fueling SME & tech IPOs.
Middle East IPOs in Saudi Arabia and UAE linked to oil & diversification plans.
This global enthusiasm for IPOs reflects investors’ hunger for growth companies.
Part 8: Future Outlook of IPOs & SME IPOs
Continued Momentum in India – With India’s strong GDP growth, IPOs and SME IPOs will remain active.
Technology & Digital Startups – More unicorns will go public.
SME Sector Expansion – With government support (Make in India, PLI schemes), SMEs will increasingly tap markets.
Global Capital Inflows – FIIs and DIIs will continue supporting IPO markets.
Regulatory Strengthening – Investor protection measures will grow, ensuring sustainable IPO growth.
Part 9: How Retail Investors Should Approach IPOs
Study DRHP carefully.
Check valuations compared to peers.
Don’t just chase listing gains – look for long-term potential.
Diversify across sectors instead of putting all money into one IPO.
Be cautious with SME IPOs – higher risk, but higher reward.
Conclusion
The boom in IPOs and SME IPOs is a reflection of the changing investment landscape. Companies are now more open to tapping markets, investors are more financially literate, and technology has made participation seamless.
While IPOs offer opportunities for wealth creation, they also carry risks. The SME IPO boom in particular highlights the democratization of capital markets, allowing small businesses to grow with public support.
As long as investors remain disciplined, regulators ensure transparency, and companies use the raised capital productively, the IPO and SME IPO boom is likely to continue shaping the future of stock markets in India and across the world.

PCR Trading StrategyHow Beginners Can Start
Learn basics of Call, Put, Strike Price.
Practice with paper trading before real money.
Start with simple strategies (like Buying Calls/Puts).
Avoid Option Writing (selling) initially — it’s risky.
Slowly learn Greeks, volatility, strategies.
Regulatory & Market Aspects (India Example)
Options in India are traded on NSE & BSE.
Lot sizes fixed by exchanges.
Weekly & Monthly expiries available.
SEBI regulates to ensure safety.
Margins required especially for Option Writing.
Famous Stories in Options Trading
Hedging by Corporates → Big companies use options to hedge currency & commodity risks.
Speculators → Many traders have made fortunes (and huge losses) in options because of leverage.
Example: Traders during COVID crash used Put Options and made huge profits.

Part 1 Support ans ResistancePayoff Diagrams (Understanding Profits & Losses)
Options are best understood with payoff diagrams.
Call Buyer → Loss limited to premium, profit unlimited.
Put Buyer → Loss limited to premium, profit grows as price falls.
Call Seller → Profit limited to premium, risk unlimited.
Put Seller → Profit limited to premium, risk high if price falls.
Common Option Strategies
Beginners usually just buy Calls or Puts. But professionals use strategies combining multiple options:
Covered Call → Hold stock + Sell Call to earn income.
Protective Put → Hold stock + Buy Put for protection.
Straddle → Buy Call + Buy Put (bet on big movement either way).
Strangle → Similar to Straddle but strikes are different.
Iron Condor → Sell both Call & Put spreads (profit if market stays flat).

Part 4 Trading Master ClassOptions Premium – How Price is Decided?
The premium (cost of option) depends on:
Intrinsic Value → The real value of option (difference between current price & strike price).
Time Value → More time till expiry = higher premium.
Volatility → If market is volatile, premium is high because chances of big move increase.
Interest Rates & Dividends → Minor effect.
👉 Example:
Reliance = ₹2,600.
Call Option 2,500 Strike = Intrinsic Value = ₹100.
Premium charged = ₹120 (extra ₹20 is time value).
Moneyness of Options
Options are classified as:
In the Money (ITM) → Option already has profit potential.
At the Money (ATM) → Option strike = Current price.
Out of the Money (OTM) → Option has no intrinsic value (only time value).
👉 Example (Stock at ₹500):
Call 480 = ITM.
Call 500 = ATM.
Call 520 = OTM.

Part 2 Trading Master ClassTypes of Options
There are only two main types of options:
(A) Call Option (Right to Buy)
A call option gives the buyer the right to buy the asset at a fixed price.
👉 Example:
Stock: Reliance is at ₹2,500 today.
You buy a Call Option at strike price ₹2,600, paying a premium of ₹50.
If Reliance goes to ₹2,700, you can buy at ₹2,600 (profit).
If Reliance stays below ₹2,600, your option expires worthless, and you lose the ₹50 premium.
(B) Put Option (Right to Sell)
A put option gives the buyer the right to sell the asset at a fixed price.
👉 Example:
Stock: Infosys is at ₹1,400.
You buy a Put Option at strike ₹1,350, paying premium ₹20.
If Infosys falls to ₹1,300, you can sell at ₹1,350 (profit).
If Infosys stays above ₹1,350, your option expires worthless, and you lose the ₹20 premium.
Why Trade Options?
Options are popular because they provide flexibility, leverage, and hedging.
1. Leverage (Small money, big exposure)
With just a small premium, you control a large quantity of shares.
Example: To buy 50 shares of Nifty (at 20,000), you need ₹10 lakhs. But an option may cost only ₹20,000 for the same exposure.
2. Hedging (Risk Protection)
Investors use options to protect portfolios. Example: If you hold Infosys shares, you can buy a Put Option to protect against price falls (like insurance).
3. Speculation (Profit from movement)
Traders use options to bet on price moves (up, down, or even staying flat).
4. Income (Option Writing)
Professional traders sell options to earn premiums regularly.

Part 1 Trading Master ClassIntroduction to Options Trading
Imagine you want to buy a house. You like one particular property, but you don’t want to commit right away. Instead, you tell the seller:
"Here’s ₹1 lakh. Keep this house reserved for me for the next 6 months. If I decide to buy, I’ll pay you the agreed price. If not, you can keep this ₹1 lakh."
That ₹1 lakh you gave is called a premium. The deal you made is an option — a contract that gives you the right but not the obligation to buy the house.
This is the core idea of options trading: you pay a small premium to get the right to buy or sell something (like stocks, indexes, commodities, etc.) at a fixed price in the future.
What is an Option?
An option is a contract between two parties:
Buyer of option (the one who pays the premium).
Seller of option (the one who receives the premium).
The buyer has the right (but not obligation) to buy or sell at a certain price. The seller has the obligation to fulfill the deal if the buyer exercises the option.
Key Terms:
Underlying Asset → The thing on which the option is based (stocks like Reliance, Infosys, indexes like Nifty, commodities, etc.).
Strike Price → The pre-decided price at which the buyer can buy or sell.
Premium → The cost of buying the option.
Expiry → The last date till which the option is valid.
Lot Size → Options are traded in fixed quantities, not single shares. Example: Nifty options lot = 50 shares.

Basics of Technical Analysis1. Philosophy Behind Technical Analysis
The foundation of technical analysis is based on three key assumptions:
a. Market Discounts Everything
This principle states that all known information—economic, political, and psychological—is already reflected in the current price of a security. Prices react immediately to news and events, so there is no need to analyze each piece of information individually. For example, if a company reports a better-than-expected quarterly result, its stock price will immediately adjust to reflect this news.
b. Prices Move in Trends
Technical analysts believe that prices follow trends, whether upward (bullish), downward (bearish), or sideways (consolidation). Recognizing these trends is crucial because “the trend is your friend.” Traders aim to align their trades with the prevailing trend rather than against it.
c. History Tends to Repeat Itself
Human psychology drives market behavior, and patterns of fear, greed, and optimism often repeat over time. Technical analysis relies on identifying these recurring patterns to predict potential price movements.
2. Core Components of Technical Analysis
Technical analysis consists of several tools and techniques. Understanding these fundamentals is essential for building an effective trading strategy.
a. Price Charts
Price charts are the most basic tool for technical analysts. They visually display the historical price movements of a security over time.
Line Chart: Shows a simple line connecting closing prices over time. Useful for spotting long-term trends.
Bar Chart: Displays open, high, low, and close (OHLC) for each period. Useful for analyzing volatility.
Candlestick Chart: Uses colored bars (candles) to indicate price movement. Highly popular due to its visual clarity and ability to display market sentiment.
Example of a Candlestick
Bullish Candle: Close is higher than open, indicating buying pressure.
Bearish Candle: Close is lower than open, showing selling pressure.
b. Support and Resistance
These are price levels where buying or selling pressure tends to prevent further movement.
Support: A level where demand exceeds supply, preventing the price from falling further.
Resistance: A level where supply exceeds demand, preventing the price from rising further.
Traders watch these levels to make entry and exit decisions. A breakout above resistance signals potential bullish momentum, while a breakdown below support indicates bearish momentum.
c. Trendlines and Channels
Trendlines connect price highs or lows to define the direction of the market. Channels are formed by drawing parallel lines above and below the trendline.
Uptrend: Higher highs and higher lows.
Downtrend: Lower highs and lower lows.
Sideways Trend: Prices fluctuate within a horizontal range.
Channels help traders identify potential reversal points or continuation of trends.
d. Technical Indicators
Indicators are mathematical calculations based on price, volume, or both. They help confirm trends, measure momentum, and identify potential reversals.
Popular Indicators:
Moving Averages: Smooth out price data to identify trends.
Simple Moving Average (SMA)
Exponential Moving Average (EMA)
Relative Strength Index (RSI): Measures the speed and change of price movements. Values above 70 indicate overbought conditions; below 30 indicate oversold.
MACD (Moving Average Convergence Divergence): Shows the relationship between two moving averages. Helps identify trend changes and momentum.
Bollinger Bands: Measure volatility by plotting upper and lower bands around a moving average. Prices touching the bands often signal potential reversals.
e. Volume Analysis
Volume indicates the number of shares or contracts traded in a given period. It confirms the strength of a trend:
Rising price with increasing volume → strong trend
Rising price with decreasing volume → weak trend, potential reversal
Falling price with increasing volume → strong bearish trend
Volume is often analyzed alongside price patterns to validate breakouts or breakdowns.
f. Chart Patterns
Chart patterns are formations created by price movements. They signal potential continuation or reversal of trends.
Common Patterns:
Head and Shoulders: Trend reversal pattern.
Double Top and Double Bottom: Indicate potential reversals.
Triangles (Ascending, Descending, Symmetrical): Represent consolidation before breakout.
Flags and Pennants: Short-term continuation patterns.
These patterns help traders predict the market’s next move based on historical price behavior.
g. Candlestick Patterns
Candlestick patterns provide insight into market sentiment over a short period.
Doji: Indicates indecision.
Hammer: Bullish reversal at the bottom of a downtrend.
Shooting Star: Bearish reversal at the top of an uptrend.
Engulfing Patterns: Strong reversal signals.
By combining candlestick patterns with support/resistance and indicators, traders enhance their decision-making accuracy.
3. Timeframes in Technical Analysis
Technical analysis can be applied across various timeframes:
Intraday: 1-minute, 5-minute, 15-minute charts.
Short-Term: Daily or weekly charts.
Long-Term: Monthly or yearly charts.
Traders choose timeframes based on their strategy:
Day Traders: Focus on intraday charts for quick trades.
Swing Traders: Use daily or weekly charts for holding positions for days or weeks.
Investors: Rely on long-term charts for position trades.
4. Combining Technical Tools
A single tool rarely provides a perfect trading signal. Successful technical analysis combines multiple tools:
Trend Identification: Determine if the market is trending or ranging.
Support/Resistance: Identify key price levels for entry or exit.
Indicators: Confirm momentum, strength, and potential reversals.
Volume Analysis: Validate the trend or breakout.
Patterns: Spot opportunities using chart or candlestick formations.
For example, a trader may buy a stock when the price breaks above a resistance level, the RSI is rising but not overbought, and the breakout is accompanied by high volume.
5. Risk Management in Technical Analysis
Even the best technical analysis cannot guarantee profits. Risk management ensures traders protect their capital.
Stop-Loss Orders: Automatically exit losing trades at a predetermined level.
Position Sizing: Adjust trade size according to risk tolerance.
Risk-Reward Ratio: Ensure potential reward is higher than potential risk (e.g., 2:1 ratio).
Diversification: Avoid concentrating all trades in one instrument or sector.
Proper risk management is critical for long-term trading success.
6. Psychological Aspect
Markets are influenced by human emotions—fear, greed, hope, and panic. Technical analysis helps traders remain objective:
Follow predefined rules for entry and exit.
Avoid trading based on emotions or news hype.
Stick to trend direction and signals.
Emotional discipline combined with technical tools improves consistency.
7. Limitations of Technical Analysis
While technical analysis is powerful, it has limitations:
No Fundamental Insight: Ignores company performance, earnings, and economic factors.
Subjectivity: Interpretation of charts and patterns can vary between analysts.
False Signals: Breakouts or reversals can fail.
Market Manipulation: Large participants can influence price temporarily.
Traders often combine technical and fundamental analysis to mitigate these limitations.
8. Practical Application: How to Start
Choose a Market: Stocks, commodities, Forex, or cryptocurrencies.
Pick a Charting Platform: TradingView, Zerodha Kite, MetaTrader, etc.
Learn Price Patterns and Indicators: Begin with support/resistance, trendlines, and moving averages.
Paper Trade: Practice without risking real money.
Develop a Strategy: Include entry/exit rules, stop-loss, and position sizing.
Analyze Performance: Keep a trading journal to track successes and failures.
9. Advanced Concepts
After mastering the basics, traders can explore:
Fibonacci Retracement: Identify potential reversal levels.
Elliott Wave Theory: Predict market cycles using waves.
Market Profile & Volume Profile: Advanced volume-based analysis.
Algorithmic Trading: Automated execution using technical indicators.
10. Summary
Technical analysis is a toolkit that allows traders to forecast market movements based on price and volume data. Its foundation lies in understanding trends, support/resistance, chart patterns, and indicators, combined with disciplined risk management and psychological control. While it does not guarantee success, a structured approach increases the probability of making profitable trades.
By consistently applying technical analysis, traders can:
Identify opportunities in trending and range-bound markets.
Time entries and exits effectively.
Minimize losses through disciplined risk management.
Improve confidence in trading decisions.

Candlestick Patterns Explained1. Introduction to Candlestick Patterns
1.1 What is a Candlestick?
A candlestick is a type of chart used to represent the price movement of an asset over a specific time period. Unlike traditional line charts that show only closing prices, candlestick charts display four crucial pieces of information:
Open price (O): The price at which the asset starts trading during the time frame.
Close price (C): The price at which the asset finishes trading.
High price (H): The highest price reached during the time frame.
Low price (L): The lowest price reached during the time frame.
Each candlestick consists of:
Body: The rectangular area between the open and close prices. A filled body (often red or black) represents a close lower than the open (bearish), while an empty or green body represents a close higher than the open (bullish).
Wicks/Shadows: The thin lines extending from the body, representing the high and low prices.
1.2 Why Candlestick Patterns Matter
Candlestick patterns reflect the psychology of the market. They show whether buyers or sellers are in control and help traders anticipate potential price movements. Patterns can indicate:
Trend continuation: The market is likely to keep moving in the same direction.
Trend reversal: The market may change direction soon.
Indecision: Neither buyers nor sellers have a clear advantage.
2. Types of Candlestick Patterns
Candlestick patterns are broadly categorized into two types:
Single-Candle Patterns: Formed by one candle, often signaling immediate market sentiment.
Multiple-Candle Patterns: Formed by two or more candles, providing stronger confirmation of trend direction or reversals.
3. Single-Candle Patterns
3.1 Doji
A Doji occurs when the open and close prices are almost equal, forming a very small body with long wicks. It signals market indecision and potential reversal.
Types of Doji:
Standard Doji: Open ≈ Close, wicks vary.
Long-Legged Doji: Long upper and lower shadows; extreme indecision.
Dragonfly Doji: Long lower shadow, little or no upper shadow; potential bullish reversal.
Gravestone Doji: Long upper shadow, little or no lower shadow; potential bearish reversal.
Example: After a strong uptrend, a Gravestone Doji may indicate the buyers are losing momentum.
3.2 Hammer and Hanging Man
Both have small bodies and long lower shadows, but their implications differ based on trend:
Hammer (Bullish Reversal): Appears after a downtrend. Shows that sellers pushed the price down, but buyers regained control.
Hanging Man (Bearish Reversal): Appears after an uptrend. Indicates sellers testing the market and potential reversal.
Tip: Always confirm with the next candle or technical indicators.
3.3 Shooting Star and Inverted Hammer
These are the opposite of Hammer and Hanging Man:
Shooting Star (Bearish Reversal): Appears after an uptrend, small body with long upper shadow. Indicates buyers tried to push prices up but failed.
Inverted Hammer (Bullish Reversal): Appears after a downtrend, small body with long upper shadow. Suggests buyers may be gaining control.
3.4 Spinning Top
A small body with long shadows on both sides. Reflects market indecision and weak trend momentum. Spinning tops often precede trend reversals if confirmed by the next candle.
4. Multiple-Candle Patterns
4.1 Engulfing Patterns
Engulfing patterns occur when one candle completely engulfs the previous candle's body, signaling strong momentum.
Bullish Engulfing: Appears after a downtrend. A large green candle engulfs a small red candle. Indicates buyers taking control.
Bearish Engulfing: Appears after an uptrend. A large red candle engulfs a small green candle. Indicates sellers gaining strength.
4.2 Harami Patterns
A Harami consists of a large candle followed by a smaller candle within the body of the first. It signals trend reversal or indecision.
Bullish Harami: Appears after a downtrend, small green candle within large red candle. Suggests buyers are entering.
Bearish Harami: Appears after an uptrend, small red candle within large green candle. Suggests selling pressure.
4.3 Tweezer Tops and Bottoms
Tweezer patterns are formed when two candles have equal highs or lows:
Tweezer Top (Bearish): Appears after an uptrend, equal highs indicate resistance.
Tweezer Bottom (Bullish): Appears after a downtrend, equal lows indicate support.
4.4 Morning Star and Evening Star
Three-candle reversal patterns:
Morning Star (Bullish Reversal): Downtrend → small-bodied candle → strong bullish candle. Indicates trend reversal upward.
Evening Star (Bearish Reversal): Uptrend → small-bodied candle → strong bearish candle. Indicates trend reversal downward.
4.5 Three White Soldiers and Three Black Crows
Strong trend continuation patterns:
Three White Soldiers (Bullish): Three consecutive green candles with higher closes, following a downtrend. Strong bullish signal.
Three Black Crows (Bearish): Three consecutive red candles with lower closes, following an uptrend. Strong bearish signal.
5. Candlestick Patterns in Trend Analysis
Candlestick patterns are more effective when combined with trend analysis:
Uptrend: Look for bullish patterns (Hammer, Bullish Engulfing, Morning Star).
Downtrend: Look for bearish patterns (Shooting Star, Bearish Engulfing, Evening Star).
Sideways Market: Look for indecision patterns (Doji, Spinning Top).
Tip: Patterns are not guarantees; they indicate probabilities. Always confirm with volume, support/resistance, or technical indicators like RSI, MACD, or moving averages.
6. Practical Trading Tips Using Candlestick Patterns
Confirm Patterns: Never trade based solely on one candlestick. Wait for confirmation from the next candle or trend indicators.
Combine with Support & Resistance: Candlestick patterns near key levels are more reliable.
Volume Matters: Patterns accompanied by high volume indicate stronger conviction.
Risk Management: Set stop-losses slightly beyond the wick extremes to protect against false signals.
Time Frames: Patterns work across all timeframes, but longer timeframes (daily/weekly) generally provide more reliable signals.
7. Common Mistakes Traders Make
Ignoring trend context: Trading reversal patterns against strong trends can lead to losses.
Over-relying on a single candle: Patterns should be confirmed with other indicators.
Misinterpreting Dojis or Spinning Tops: Context and location in the trend are critical.
Neglecting risk management: Even the strongest patterns can fail.
8. Summary
Candlestick patterns are a powerful tool for traders when used correctly. They visually depict market psychology and help forecast potential price movements. Key takeaways:
Single-Candle Patterns indicate immediate sentiment (Hammer, Doji, Shooting Star).
Multiple-Candle Patterns provide stronger signals (Engulfing, Morning Star, Three Soldiers).
Trend Confirmation increases reliability.
Support, Resistance, Volume, and Indicators enhance accuracy.
With practice, traders can read market sentiment quickly and make more informed decisions. Candlestick analysis is not a standalone solution but a vital part of a comprehensive trading strategy.
Bullish Engulfing Pattern: Spotting Reversals with Discipline🔎 Intro / Overview
Managing risk is just as important as finding an entry. The Bullish Engulfing is one of the most effective candlestick patterns to identify potential reversals. When traded with discipline, it signals a shift from seller pressure to buyer control, helping traders time their entries with confidence.
📔 Concept
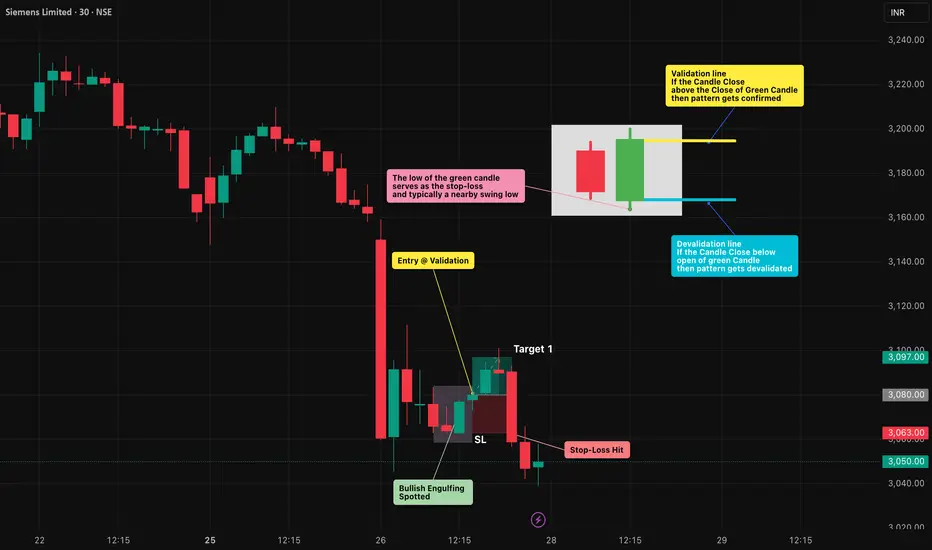
A Bullish Engulfing occurs when:
The first candle is a small red candle that continues the downtrend.
The next candle is a large green candle whose body completely engulfs the red candle’s body .
👉 This shows a clear psychological shift — sellers push lower (red candle), but buyers step in strongly (green candle) and reclaim control.
📌 How to Use
✅ Validation → The candle must close above the close of the green candle.
❌ Invalidation → If price closes below the open of the green candle before confirmation.
Trading Plan:
Entry → After confirmation of the green candle’s close.
Stop-Loss (SL) → Below the low of the green candle.
Take-Profit (TP) :
Conservative → 1R (Entry → SL distance)
Moderate → 2R
Aggressive → Book partial at 1R and trail the rest using tools like ATR, Fibonacci levels, or structure-based stops to ride any extended upside move.
📊 Chart Explanation
On the chart, the first small red candle shows sellers continuing the downtrend. The next large green candle completely engulfs the red candle’s body and closes higher — signaling that buyers have taken control.
The pattern was validated at the close of the green candle , where the long entry was taken. The low of the green candle is used as the stop-loss level, while the targets are mirrored in reverse using the same distance.
In this example, Stop-loss was quickly achieved . From there, traders can apply trailing stop methods to lock in profits and manage further upside targets.
👀 Observation
Most effective at support zones or after a prolonged downtrend .
A high-volume green candle adds conviction to the signal.
In sideways/choppy markets , it can produce false signals — always filter with structure and indicators.
❗ Why It Matters?
The red candle shows seller pressure .
The green candle shows buyer strength .
This clear shift in control creates a rule-based setup with defined entry, SL, and TP.
🎯 Conclusion
The Bullish Engulfing is a strong sign of reversal — but only when combined with structure, confirmation, and disciplined risk management.
🔥 Patterns don’t predict. Rules protect.
⚠️ Disclaimer
For educational purposes only · Not SEBI registered · Not a buy/sell recommendation · No investment advice — purely a learning resource
Bearish Engulfing Pattern: Spotting Reversals with Discipline🔎 Intro / Overview
Managing a trade after entry is just as important as finding the right setup. The Bearish Engulfing is one of the most reliable candlestick patterns to spot potential reversals. When traded with discipline, it helps you recognize momentum shifts early and manage risk objectively.
📔 Concept
A Bearish Engulfing occurs when:
The first candle is a small green candle that continues the uptrend.
The next candle is a large red candle whose body completely engulfs the green candle’s body .
👉 This shows a clear psychological shift — buyers push higher (green candle), but sellers step in aggressively (red candle) and erase those gains.
📌 How to Use
✅ Validation → The candle must close below the open of the red candle.
❌ Invalidation → If price closes above the close of the red candle before confirmation.
Trading Plan:
Entry → After confirmation of the red candle’s close.
Stop-Loss (SL) → Above the high of the red candle which is also a swing high.
Take-Profit (TP) :
Conservative → 1R (Entry → SL distance)
Moderate → 2R
Aggressive → Book partial at 1R and trail the rest using tools like ATR, Fibonacci levels, or structure-based stops to ride any extended downside move.
📊 Chart Explanation
On the chart, the first small green candle represents buyers continuing the uptrend. The next large red candle completely engulfs the green candle’s body and closes lower, signaling that sellers have taken control.
The pattern was validated at the close of the red candle , where the short entry was taken. The high of the red candle is used as the stop-loss level, while the targets are mirrored in reverse using the same distance.
In this example, Target 1 was quickly achieved . From there, traders can apply trailing stop methods to lock in profits and manage further downside targets.
👀 Observation
Works best when the pattern forms at major resistance levels or after a sustained uptrend .
A high-volume red candle strengthens the reliability of the signal.
In sideways or choppy conditions , false signals are common — always confirm with structure and indicators before acting.
❗ Why It Matters?
The green candle shows buyer optimism .
The red candle shows seller dominance .
This clear flip in control creates a rule-based setup with defined entry, SL, and TP.
🎯 Conclusion
The Bearish Engulfing is a strong sign of reversal — but it’s powerful only when combined with structure, confirmation, and disciplined risk management.
🔥 Patterns don’t predict. Rules protect.
⚠️ Disclaimer
For educational purposes only · Not SEBI registered · Not a buy/sell recommendation · No investment advice — purely a learning resource
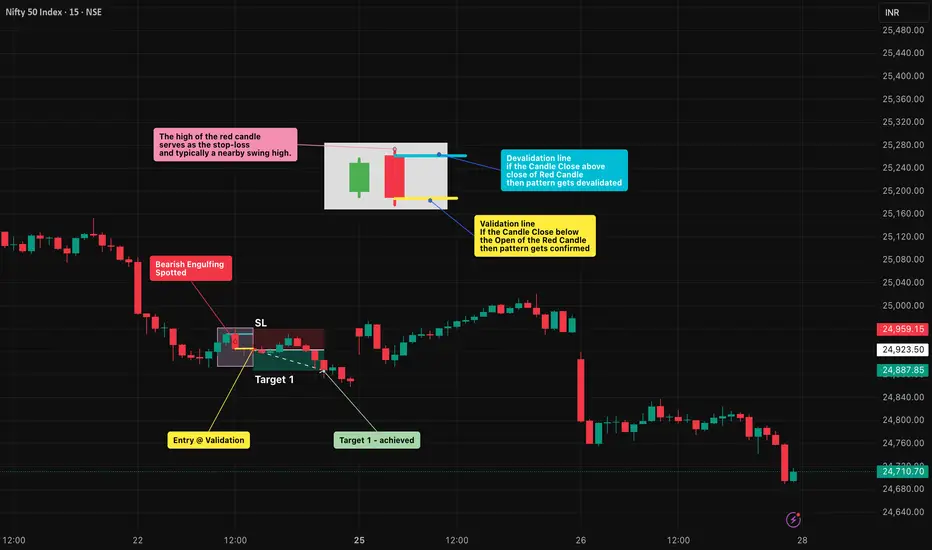
Part 2 Master Candlestick PatternDisadvantages of Options
Complexity for beginners
Time decay risk (premium can vanish)
Unlimited risk for sellers of uncovered options
Requires active monitoring for effective trading
Tips for Successful Options Trading
Understand the underlying asset thoroughly.
Start with basic strategies like long calls, puts, and covered calls.
Use proper risk management and position sizing.
Keep track of Greeks to understand sensitivity.
Avoid over-leveraging.
Monitor market volatility; high volatility can inflate premiums.
Use demo accounts or paper trading for practice.

Part 6 Learn Institutional Trading Black-Scholes Model
A widely used formula to calculate option prices using:
Stock price
Strike price
Time to expiry
Volatility
Risk-free interest rate
Greeks
Delta: Measures sensitivity of option price to underlying price changes.
Gamma: Measures delta’s rate of change.
Theta: Measures time decay of option.
Vega: Measures sensitivity to volatility.
Rho: Measures sensitivity to interest rates.
Understanding Greeks is critical for managing risk and strategy adjustments.

Part 4 Learn Institutional Trading Advanced Strategies
Straddle: Buy a call and a put at the same strike and expiry to profit from volatility.
Strangle: Buy OTM call and put for cheaper volatility bets.
Spread Strategies: Combine multiple calls or puts to limit risk and reward:
Bull Call Spread: Buy call at lower strike, sell call at higher strike.
Bear Put Spread: Buy put at higher strike, sell put at lower strike.
Iron Condor: Combine calls and puts to profit from low volatility.
Butterfly Spread: Profit from minimal movement around a central strike.
Pricing of Options
Option pricing is influenced by several factors:
Intrinsic Value
The real value if exercised today.
Call option IV = Max(Current Price – Strike, 0)
Put option IV = Max(Strike – Current Price, 0)
Time Value
Extra premium due to time until expiration.
TV = Option Premium – Intrinsic Value

Part 1 Ride The Big Moves Options trading is one of the most versatile tools in financial markets, allowing traders and investors to hedge risk, generate income, and speculate on price movements. While options can seem complex at first, understanding their structure, types, and strategies can make them an invaluable part of your trading toolkit.
What Are Options?
An option is a financial contract that gives the holder the right, but not the obligation, to buy or sell an underlying asset (like stocks, indices, or commodities) at a predetermined price within a specific period. Unlike futures or stocks, options provide flexibility and limited risk.
There are two main types of options:
Call Option: Gives the buyer the right to buy the underlying asset at a predetermined price (strike price) before or on the expiration date.
Put Option: Gives the buyer the right to sell the underlying asset at the strike price before or on expiration.
Key terms to understand:
Underlying Asset: The stock, index, commodity, or currency on which the option is based.
Strike Price: The price at which the option can be exercised.
Premium: The price paid to buy the option.
Expiration Date: The date on which the option expires.
In-the-Money (ITM): Options with intrinsic value (profitable if exercised now).
Out-of-the-Money (OTM): Options without intrinsic value (currently unprofitable).
At-the-Money (ATM): Option strike price equals the underlying asset price.

Volume Profile & Market Structure1. Introduction
If you have ever looked at a stock or index chart, you’ll notice prices move up, down, or sometimes just sideways. Traders are always trying to answer one simple question:
👉 Where is the market likely to go next?
To answer that, two powerful tools come into play:
Market Structure → tells us the story of price movement by showing how highs, lows, and trends form.
Volume Profile → shows us where the biggest battles between buyers and sellers happened by plotting traded volumes at different price levels.
Think of Market Structure as the “skeleton” of price movement, and Volume Profile as the “blood flow” that shows which areas have real strength and participation. When combined, these tools help traders understand who controls the market (buyers or sellers) and where important levels are for making decisions.
In this guide, we’ll break down these concepts step by step in simple language so you can use them in real-world trading.
2. Understanding Market Structure
Market structure simply means the framework of how price moves over time. It helps traders identify the trend, key levels, and potential reversals.
2.1 What is Market Structure?
At its core, market structure is about recognizing patterns in price:
When the market is making higher highs (HH) and higher lows (HL) → it’s in an uptrend.
When the market is making lower highs (LH) and lower lows (LL) → it’s in a downtrend.
When the market is not making new highs or lows, just bouncing within levels → it’s in a range.
📌 Example:
If Nifty goes from 19,000 → 19,200 → 19,100 → 19,400 → 19,250, we can see it’s making higher highs and higher lows, which means buyers are stronger.
2.2 Why Market Structure Matters
It shows the direction of the market.
Helps identify good entry and exit points.
Builds discipline (you trade with the trend, not against it).
2.3 Phases of Market Structure
Markets move in cycles. These are usually broken into four phases:
Accumulation Phase
Big players (institutions) quietly buy at low prices.
Price moves sideways.
Volume is steady but not explosive.
Uptrend/Advancing Phase
Price starts breaking resistance levels.
Higher highs and higher lows form.
Retail traders notice and start buying.
Distribution Phase
Big players slowly sell to latecomers.
Market looks like it’s topping out.
Price often moves sideways again.
Downtrend/Decline Phase
Price starts making lower highs and lower lows.
Panic selling happens.
Eventually, smart money will start accumulating again → cycle repeats.
2.4 Break of Structure (BOS) & Change of Character (ChoCh)
Two important concepts:
Break of Structure (BOS): when price breaks the previous high/low, signaling continuation of trend.
Change of Character (ChoCh): when price shifts from uptrend to downtrend (or vice versa). This often signals a reversal.
📌 Example:
If Bank Nifty keeps making higher highs but suddenly makes a lower low, that’s a ChoCh – trend may reverse.
2.5 Market Structure Across Timeframes
On higher timeframes (daily/weekly) → structure shows the big trend.
On lower timeframes (5-min, 15-min) → structure shows intraday opportunities.
Smart traders align both (called multi-timeframe analysis).
3. Understanding Volume Profile
Now that we understand how price moves, let’s look at the Volume Profile – the tool that shows where traders are most active.
3.1 What is Volume Profile?
Unlike the normal volume indicator (bars at the bottom of the chart showing volume per time), Volume Profile plots volume at each price level.
So instead of asking: “How much was traded at 10:30 AM?”
We ask: “How much was traded at ₹19,200, ₹19,300, ₹19,400?”
This gives a much clearer picture of where buyers and sellers are fighting hardest.
3.2 Key Elements of Volume Profile
POC (Point of Control):
The price level where the highest volume was traded.
Acts like a magnet – price often returns to this level.
Value Area (VA):
The range of prices where around 70% of the volume occurred.
Consists of:
VAH (Value Area High): top of this range.
VAL (Value Area Low): bottom of this range.
High Volume Nodes (HVN):
Price zones with heavy volume.
Represent areas of acceptance (market agrees fair value is here).
Low Volume Nodes (LVN):
Price zones with very little volume.
Represent areas of rejection (market quickly moved away).
📌 Simple Analogy:
Imagine an auction. Where people bid the most (POC), that’s the “fair price.” Places where few bids happen (LVN) are “unwanted” areas.
3.3 Why Volume Profile Matters
Shows real support & resistance (not just lines on charts).
Helps spot false breakouts (price goes above resistance but fails if volume is low).
Identifies where big players (institutions) are active.
3.4 Difference Between Volume Profile & Normal Volume
Normal Volume: tells when activity happened.
Volume Profile: tells where activity happened.
4. Combining Market Structure with Volume Profile
This is where magic happens.
Market structure tells us direction, and volume profile tells us important levels. Together, they give high-probability setups.
4.1 Example Setup: Trend Confirmation
If market is in uptrend (HH, HL structure) →
Look at POC/VAH. If price holds above these, trend is strong.
4.2 Example Setup: Reversal Spotting
If price breaks structure (ChoCh) AND rejects at an LVN, it signals strong reversal.
4.3 Example Setup: Liquidity Zones
Many traders put stop losses above resistance/below support.
Volume Profile helps spot whether these breakouts are real (with volume) or fake (low volume).
5. Trading Strategies Using Market Structure + Volume Profile
Let’s go through practical trading approaches.
5.1 Trend Trading Strategy
Identify trend with market structure (HH/HL for uptrend, LH/LL for downtrend).
Use POC/VAH/VAL as entry levels.
Enter with trend direction, place stop below VAL (for long) or above VAH (for short).
5.2 Range Trading Strategy
If market is sideways → watch Value Area.
Buy near VAL, sell near VAH.
Exit near POC.
5.3 Breakout Strategy
If market breaks resistance with high volume (confirmed by VP), enter breakout.
If breakout happens at LVN, it usually moves fast.
5.4 Reversal Strategy
Look for ChoCh in market structure.
Confirm with rejection at HVN/LVN.
Enter opposite direction.
5.5 Scalping (Intraday)
Use lower timeframes (5-min, 15-min).
Enter at POC retests.
Target small moves (20–30 points in Nifty).
5.6 Swing Trading (Positional)
Use higher timeframe VP (daily/weekly).
Identify major HVN (support) & LVN (breakout zones).
Ride bigger moves.
6. Risk Management & Psychology
Even with the best tools, without risk management you can lose money.
Stop Loss: always place stops beyond HVN/LVN levels.
Position Sizing: never risk more than 1–2% of capital per trade.
Patience: wait for price to confirm at volume profile levels, don’t jump early.
Discipline: follow your system, don’t let emotions rule.
7. Common Mistakes Traders Make
Ignoring Higher Timeframe Levels → focusing only on 5-min charts without seeing big picture.
Chasing Breakouts Without Volume Confirmation → leads to false breakout traps.
Overloading Chart with Indicators → volume profile + market structure are enough.
No Risk Management → one bad trade wipes profits.
8. Conclusion & Key Takeaways
Market Structure = Direction (trend, BOS, ChoCh, HH/HL, LH/LL).
Volume Profile = Importance (POC, VAH, VAL, HVN, LVN).
Combined → they show who controls the market and where to enter/exit safely.
📌 Golden Rule:
Trade with the structure and around the volume zones → your accuracy improves dramatically.
By using both tools together, you stop trading blindly and start trading with the footsteps of institutions.