Premium Chart Patterns Premium chart patterns are high-quality technical structures that show where big money is entering or exiting, helping you predict future moves with strong accuracy. These patterns are widely used in swing trading, intraday trading, and positional trading.
Below, you’ll find the top high-probability premium patterns, along with how to trade them.
Chart Patterns

Part 10 Trade Like Institutions Advantages of Option Trading
Low investment, high return potential
Can profit in any market condition
Great for hedging and insurance
Wide range of strategies
Lower capital requirement compared to futures
Disadvantages of Option Trading
Requires knowledge of Greeks
High risk if used incorrectly
Time decay eats into profits
Volatility can change premiums rapidly

Part 9 Trading Master Class with Experts In-the-Money, At-the-Money, Out-of-the-Money
Call Options
ITM: Market price > strike
ATM: Market price ≈ strike
OTM: Market price < strike
Put Options
ITM: Market price < strike
ATM: Market price ≈ strike
OTM: Market price > strike
OTM options are cheap but risky.
ITM options are safer but cost more.

Part 8 Trading Master Class with Experts Time Decay (Theta): The Silent Killer
Time decay works against option buyers and in favor of sellers.
As expiry approaches, the time value decreases.
Even if the price stays the same, the option loses value daily.
Weekly options lose value much faster than monthly options.
This is why many professional traders prefer option selling—because time decay works in their favor.

Part 7 Trading Master Class With Experts Option Pricing: Why Premium Changes
Premium is the price paid by the option buyer. It depends on:
1. Intrinsic Value
Value if exercised today.
2. Time Value
More time → more chances of profit → higher premium.
3. Volatility (IV – Implied Volatility)
When volatility increases, option premiums rise.
4. Supply & Demand
High demand increases option prices.
5. Interest Rates & Dividends
These have minor impact but still matter for pricing models.

Part 6 Learn Institutional Trading Why Trade Options?
Options are extremely popular because they offer:
1. Leverage
You can control a large position using a small amount of money (the premium).
Example: Buying a stock may cost ₹1,00,000, but a call option may cost only ₹3,000.
2. Hedging
Investors use options to protect their portfolios from losses during market corrections.
3. Income Generation
Option sellers generate regular income through premium collection strategies.
4. Flexibility
You can build strategies that make money in rising, falling, or sideways markets.

Part 3 Learn Institutional Trading What Are Options?
Options are derivative contracts, meaning their value is derived from an underlying asset. The underlying asset may be stocks, indices, commodities, currencies, ETFs, or even cryptocurrencies.
There are two main types of options:
Call Option – Gives the buyer the right, but not the obligation, to buy the underlying asset at a specific price before a specific date.
Put Option – Gives the buyer the right, but not the obligation, to sell the underlying asset at a specific price before a specific date.
The specific price is called the strike price, and the last day the contract is valid is the expiry date.

Smart Options Strategies1. What Makes an Options Strategy “Smart”?
A strategy becomes smart when it has:
✔ Defined Risk
You must always know the maximum loss before entering a trade. Smart strategies use spreads, hedges, and risk caps.
✔ High Probability of Profit
Instead of chasing home runs, smart traders target high-probability setups using delta, implied volatility, and data-backed levels.
✔ Edge From Volatility
Most retail traders ignore implied volatility (IV). Smart traders sell options when IV is high, and buy options when IV is low.
✔ Time Decay Advantage
Smart strategies often sell premium so theta works in your favor.
✔ Directional but Hedged
Directional trades must include some level of risk protection.
✔ Market Structure Alignment
No strategy works alone; it must match:
Trend (up, down, sideways)
Volatility environment
Support/Resistance
Momentum levels
2. Smart Strategies for Trending Markets
A. Vertical Spreads (Bull Call / Bear Put)
Vertical spreads are smart because they lower the cost, define risk, and give directional exposure with far less stress than naked options.
1. Bull Call Spread (Uptrend Strategy)
Buy ATM call
Sell OTM call
Limited risk & limited reward
Best used in steady uptrends
Why smart?: Reduces premium cost by 40–60% and controls emotions.
2. Bear Put Spread (Downtrend Strategy)
Buy ATM put
Sell OTM put
Works in controlled downtrends
Why smart?: Cheaper than naked puts and gives clear risk-reward structure.
B. Covered Call
If you own stocks and expect slow upward movement, sell OTM calls and earn a consistent income.
Why smart?:
Generates passive premium
Reduces cost basis
Safer than naked options
Ideal for long-term investors who want side income.
C. Cash-Secured Put
Selling a put at a support level
You collect premium
If assigned, you buy stock at a discount
Why smart?:
High-probability income strategy
Great for undervalued stocks
Safer than buying at market price
3. Smart Strategies for Sideways Markets
Most markets are range-bound for 60–70% of the time. Professional traders make money even in flat markets using credit spreads and range strategies.
A. Iron Condor
This is one of the smartest non-directional strategies.
Structure:
Sell OTM call spread
Sell OTM put spread
Collect premium from both sides
Your view: Market stays inside a range.
Why smart?:
High probability (70%–85%)
Neutral strategy
Benefits from theta decay
Risk is defined
Smart traders use Iron Condors in:
Low-volatility phases
Consolidation zones
Before stable events (not before major announcements)
B. Iron Butterfly
A more aggressive version of condor.
Structure:
Sell ATM straddle (call + put)
Hedge with OTM wings
Why smart?:
High premium
Tight risk box
Ideal for strong consolidations
4. Smart Strategies for High-Volatility Markets
During events like Fed meetings, India budget, RBI policy, earnings, or global chaos, IV increases sharply. Smart traders sell expensive options to exploit this.
A. Straddle Sell (Advanced)
Sell ATM call & ATM put
Best used:
Only by skilled traders during extremely stable markets or right after volatility spikes.
Why smart:
Maximum theta advantage
Profits from volatility crush
But needs:
Strict risk management
Adjustment rules
Exit discipline
B. Strangle Sell
Sell OTM call
Sell OTM put
Less risky than a straddle. Suitable when you expect market to stay within a broader range.
Why smart:
Wider profit zone
Higher probability
Uses IV crush effectively
5. Smart Strategies for Low-IV Markets
When implied volatility is very low, option premiums are cheap. Smart traders buy options or debit spreads.
A. Long Straddle
Buy ATM call
Buy ATM put
Used when you expect a big move but uncertain direction.
B. Long Strangle
Buy OTM call
Buy OTM put
Lower cost than a straddle.
Why smart?:
Best for breakout traders
Profits from volatility expansion
6. Smart Adjustments (The Secret Behind Profitable Option Traders)
Strategies alone are not smart—adjustments make them powerful.
✔ Rolling
Move options to a later expiry or better strike if wrong direction.
✔ Converting spreads
Convert naked options → spreads
Convert condor → butterfly
Convert straddle → strangle
✔ Locking gains
When one side of the trade is fully profitable, close it and keep the other side running.
✔ Hedging with futures
Smart traders hedge using Nifty/BankNifty futures when market moves aggressively.
7. Smart Strategy Selection Based on Market Conditions
Market Condition Smart Strategy
Strong Uptrend Bull Call Spread · Covered Calls · Cash Puts
Strong Downtrend Bear Put Spread · Ratio Put Spread
Sideways Market Iron Condor · Calendar Spread · Short Strangle
Volatile Market Straddle/Strangle Sell · Iron Fly · Debit Spreads
Breakouts Long Straddle · Strangle · Vertical Spreads
This is the rulebook professional traders follow.
8. Smart Greeks-Based Trading
Smart traders analyze the Greeks before executing a trade:
✔ Delta – Directional risk
Use delta to position trades according to trend.
✔ Theta – Time decay
Sell premium when theta is in your favor.
✔ Vega – Volatility sensitivity
Sell options when IV is high
Buy options when IV is low
✔ Gamma – Sensitivity to big moves
High gamma helps in long straddle/strangle during breakout phases.
9. Smart Position Sizing
Even the best strategies fail without proper money management.
Smart rules:
Risk only 1–2% of capital per trade
Avoid naked options unless experienced
Prefer spreads for controlled risk
Avoid overtrading during volatile news days
10. Smart Psychology in Options Trading
Your strategy is only 30% of success; psychology is 70%.
Smart traders:
Avoid emotional entries
Don’t chase runaway options
Close losing trades early
Avoid revenge trades
Stick to predefined rules
They understand that options trading is not about prediction—it’s about probability + discipline.
Conclusion
Smart options strategies are structured, risk-defined, volatility-aware tactics used by professional traders to maximize profits while minimizing risk. Whether you are trading trending markets, sideways markets, breakout phases, or volatile conditions, selecting the right strategy gives you a huge edge over random directional betting.
By combining:
Proper strategy selection
Volatility analysis
Greeks
Market structure
Adjustments
Psychology
you transform from a guess-based trader to a smart, systematic options trader.
Candle Patterns Risk Management in Options
While options offer opportunities, they also carry risks:
Selling naked options can lead to unlimited losses
High leverage can magnify mistakes
Emotional trading during volatility can destroy capital
Ignoring Greeks can cause unexpected losses
Disciplined traders use:
Stop loss
Position sizing
Hedging
Proper strategy selection
Options should always be traded with clear logic, not hope or fear.

Part 1 Ride The Big Moves Why Traders Use Options
Options offer several unique advantages:
1. Leverage
With a small premium, you can control a much larger position.
2. Hedging
Investors can protect portfolios from downside risk using puts.
3. Income Generation
Selling options—especially covered calls—creates consistent passive income.
4. Flexibility
You can profit in:
Upward markets
Downward markets
Sideways markets
High or low volatility environments
This flexibility gives options an edge over simple stock trading.

PCR Trading Strategies The Role of Premium
The premium is the price you pay to buy the option.
Premium is influenced by:
Underlying price
Strike price
Time to expiry (more time = higher premium)
Volatility (higher volatility = higher premium)
Interest rates
Market demand
The buyer’s maximum loss is limited to the premium paid, but the seller’s risk can be much higher—sometimes unlimited.

Part 2 Support and Resistance Straddle – Big Move Expected (Either Side)
Market View: Highly volatile ±10%
How it Works:
Buy ATM Call + ATM Put
If stock shoots up or crashes, you earn big
Used During:
Results day
Budget announcement
Major news event
Strangle – Cheaper Version of Straddle
Market View: High volatility expected
How it Works:
Buy OTM Call + OTM Put
Cheaper than straddle
Requires bigger move to profit

Part 1 Support and Resistance Bear Put Spread – Low Cost Bearish Trade
Market View: Moderately bearish
How it Works:
Buy ATM/ITM put
Sell lower strike put
Cheap alternative to buying a naked put
Iron Condor – Sideways Market Strategy
Market View: Neutral/Range-bound
How it Works:
Sell OTM call spread
Sell OTM put spread
Collect premium from both sides
Profit in a non-trending market
Best For:
Market consolidation
Expiry day premium decay

Option Trading Strategies Covered Call – Income Strategy
Market View: Moderately bullish
How it Works:
You hold shares of a stock.
You sell a call option on those shares.
You earn premium as profit.
Best For:
Generating fixed income in a sideways/bullish market.
Low-risk traders.
Risk: Stock may get “assigned” if it crosses strike price.

Part 2 Master Candlestick PatternBull Call Spread – Low Cost Bullish Trade
Market View: Moderately bullish
How it Works:
Buy ATM/ITM call
Sell higher strike call
Reduces cost + reduces risk
Best For:
Controlled bullish trades
Trending markets
Bear Put Spread – Low Cost Bearish Trade
Market View: Moderately bearish
How it Works:
Buy ATM/ITM put
Sell lower strike put
Cheap alternative to buying a naked put

Part 1 Master Candlestick PatternCash-Secured Put – Buying Stock at Discount
Market View: Moderately bearish
How it Works:
You sell a put option by keeping cash aside.
If stock falls, you buy it at lower (strike) price.
If stock stays above strike, you keep the premium.
Best For:
Investors wanting stock at a discount.
Very safe strategy.

Sector Rotation StrategiesWhat Is Sector Rotation?
Sector rotation refers to the practice of shifting investments from one sector of the economy to another based on changing market conditions, economic cycles, and investor sentiment. Markets do not move uniformly—some areas outperform during economic expansion, others during contraction. For example:
When the economy is booming, cyclical sectors like automobiles, metals, real estate, and banks outperform.
When the economy slows, investors prefer defensive sectors like FMCG, healthcare, utilities, and IT services.
The core idea is: follow where the money is flowing, not where prices have already rallied.
Why Sector Rotation Works
Sector rotation is rooted in behavioral finance and macroeconomics. Institutional investors—mutual funds, FIIs, pension funds—allocate capital to sectors depending on their outlook for earnings growth, interest rates, inflation, and liquidity. As they rotate capital:
Strong sectors get stronger due to inflows.
Weak sectors remain weak or lag behind.
Retail traders often enter at the end of a rally, but sector rotation strategies allow you to anticipate moves earlier because sector performance leads stock performance.
The Business Cycle & Sector Rotation
To understand sector rotation, you must understand the economic cycle, which typically moves through five stages:
1. Early Recovery Phase
Interest rates remain low.
Liquidity is high.
Consumer and business spending picks up.
Outperforming sectors:
Automobiles
Banks & Financials
Real Estate
Capital Goods
Reason: These sectors are sensitive to credit, growth, and consumer spending.
2. Mid-Cycle Expansion
Economy grows at a stable pace.
Corporate earnings rise.
Market sentiment is positive.
Winning sectors:
Metals & Mining
Industrials
Technology
Infrastructure
Mid-cap and small-cap stocks
Reason: Companies expand operations and capex increases.
3. Late Cycle
Inflation increases.
Interest rates begin rising.
Market becomes volatile.
Strong performers:
Energy (Oil & Gas)
Commodities
Power
PSU sectors
Reason: Prices of energy and commodities improve due to inflation and supply constraints.
4. Recession / Slowdown
GDP weakens.
Spending slows.
Markets correct sharply.
Defensive sectors shine:
FMCG
Healthcare / Pharma
Utilities (Power, Gas Distribution)
Consumer Staples
Reason: Demand for essentials remains stable even in downturns.
5. Early Recovery Again
Cycle starts again as central banks cut rates and liquidity returns.
Indian Market Examples
Sector rotation plays out very visibly in India:
When RBI cuts rates → Banks, Realty, Autos rally first.
When inflation rises → FMCG, Pharma outperform.
When global commodity prices spike → Metals, Oil & Gas surge.
During IT outsourcing demand booms → Nifty IT becomes a leader.
When the government pushes capex → Infrastructure & PSU stocks take off.
For example:
In 2020-21, IT and Pharma led the rally after COVID.
In 2022, Metals and PSU banks outperformed due to global inflation.
In 2023-24, Railways and Defence were the strongest due to government spending.
In 2024-25, Financials and Energy gained leadership.
Sector rotation keeps happening because no sector leads forever.
Tools Used for Sector Rotation Analysis
1. Relative Strength (RS)
Compare performance of one sector vs Nifty 50.
If RS > 0 → sector outperforming
If RS < 0 → sector lagging
Traders often use:
Ratio charts (NIFTYSECTOR / NIFTY50)
RRG charts (Relative Rotation Graphs)
2. Price Action & Breakouts
Sectors forming:
Higher highs–higher lows
Breakouts on weekly charts
Often start outperforming for months.
3. Volume Profile
You track:
Institutional accumulation zones
High volume nodes
Breakout volumes
Sector rotation shows up as big volume shifts from one sector to another.
4. Market Breadth
Number of advancing stocks vs declining stocks in a sector helps identify internal strength before price rally starts.
Top Practical Sector Rotation Strategies
Strategy 1: Follow Market Cycles
Identify if India is in:
Expansion
Peak
Slowdown
Recovery
Then pick sectors accordingly.
This is the classic macro-driven approach.
Strategy 2: Follow Institutional Flows
Monitor:
FII sectoral holdings
Mutual fund monthly fact sheets
Volume increase in sectoral indices
If institutions are buying a sector for 3–4 months continuously, a long-term trend is beginning.
Strategy 3: Ratio Chart Method
Daily or weekly ratio charts give very clear guidance.
Example:
NIFTYBANK / NIFTY50 rising → banks leading
CNXIT / NIFTY50 rising → IT leadership pattern
If the ratio chart breaks out → shift capital to that sector.
Strategy 4: Top-Down Approach
A professional hedge-fund style method:
Analyze global macro trends
Identify strong Indian sectors
Select top stocks inside those sectors
Enter on pullbacks or breakouts
This avoids random stock picking and aligns you with the strongest flows.
Strategy 5: Rotation Within the Cycle
Within major rotations, micro rotations happen too.
Example:
Inside defensive rotation:
First FMCG moves
Then Pharma
Then Utilities
Inside growth rotation:
First Banks
Then Autos
Then Realty
Each mini-rotation gives trading opportunities.
Strategy 6: Quarterly Earnings Based Rotation
Before and after results, money flows into sectors expected to report strong earnings.
For example:
IT moves during Q1
Banks move during Q3
FMCG moves during Q4
Earnings cycles and sector cycles often overlap and strengthen each other.
Strategy 7: Event-Driven Rotation
Based on news, policy or global events:
Crude oil rising → Energy & refining sector improves
Govt budget focus on capex → Infra & PSU rally
Rupee weakening → IT & Pharma benefit
Fed rate cuts → Financials & Realty boom
Events accelerate sector rotation speed.
Common Mistakes in Sector Rotation Trading
1. Entering After the Rally Is Over
If a sector has already given:
20–30% weekly move
4–5 months leadership
It may soon rotate out.
2. Ignoring Macro Signals
Traders who only watch charts miss the bigger picture. Macro trends drive rotations.
3. Chasing Too Many Sectors
Focus on 2–3 sectors at a time. Too many sectors dilute capital and attention.
4. Confusing Short-Term Noise With Rotation
Rotation is visible on weekly time frames, not intraday.
Benefits of Sector Rotation
Helps avoid underperforming areas
Aligns with institutional money
Reduces risk as you stay with strong sectors
Improves probability of capturing long-swing trends
Eliminates guesswork in stock picking
Provides a structured approach
In short: sector rotation keeps you on the right side of the market.
Final Thoughts
Sector rotation is not a prediction strategy—it is an observation strategy. You observe where money is flowing and position yourself accordingly. In Indian markets, sector leadership changes every 3–12 months, creating repeated opportunities for informed traders. By combining macro analysis, volume profile, price action, and ratio charts, you can build a robust rotation-based trading framework that works across market cycles.
India’s Market Surge1. Strong Domestic Economic Growth
The backbone of India’s market rally is its robust and consistent economic growth. India remains the fastest-growing major economy, with GDP growth often staying in the 6–7.5% range, even when global economies struggle with recession fears.
Key factors boosting economic momentum include:
High domestic consumption (India is a consumption-driven economy)
Strong government capital expenditure, especially in infrastructure
Rising manufacturing activity, supported by PLI schemes
Improving rural demand and financial inclusion
This economy-market alignment builds investor confidence that the expansion is backed by real economic progress, not just speculative money flow.
2. Consistent FII and Strong DII Participation
In previous market cycles, India heavily depended on Foreign Institutional Investors (FIIs). But the recent surge shows the strength of domestic investors:
Domestic Institutional Investors (DIIs)
Mutual funds, SIPs, and pension funds are investing record amounts every month.
Monthly SIP inflows crossing new highs build a stable, continuous support for equities.
Foreign Institutional Investors (FIIs)
FIIs have returned strongly due to India’s improving macro stability.
Compared to China, many FIIs see India as a safer, higher-growth, long-term bet.
This dual inflow dynamic creates a powerful liquidity engine that keeps markets supported even during short-term corrections.
3. Corporate Profit Boom
One of the most underestimated drivers is India’s corporate profit cycle.
Corporate profits as a percentage of GDP have hit multi-year highs.
Banks and financials are reporting record profits due to low NPAs and higher credit growth.
Manufacturing, IT, auto, and capital goods sectors are showing both volume growth and margin improvement.
When earnings grow consistently, markets rise not just because of sentiment—but because fundamentals justify higher valuations.
4. Government’s Long-Term Policy Stability
Policy continuity has played a major role in boosting investor confidence.
Important policy drivers:
GST stabilizing over time
Digitization and UPI-driven fintech boom
PLI schemes encouraging manufacturing expansion
Infrastructure push: roads, railways, logistics corridors
Make-in-India & Atmanirbhar Bharat initiatives
Clear, predictable policy frameworks attract both domestic and global investors who prefer stable emerging markets.
5. India’s Rising Global Preference vs China
A major geopolitical shift is happening:
Global investors are rebalancing away from China and moving to India.
Reasons include:
Better political stability
Fewer regulatory uncertainties
High-quality corporate governance
Massive demographic advantage
A growing middle-class consumption engine
India is being viewed as the next global growth leader, not just an emerging market. This perception shift alone adds premium valuations to Indian equities.
6. Middle-Class Expansion and Financialization of Savings
India’s middle class is growing rapidly, and with it, the financialization trend:
More people opening Demat accounts
SIP participation rising steadily
Increasing awareness of equity markets
Young investors entering trading and investing
This broad-based participation provides long-term depth and resilience to the markets—even during global volatility.
7. Sectoral Supercycles Fueling the Rally
Several sectors are experiencing their own mini supercycles:
a) Banking & Financials
Strong credit growth
Lower NPAs
Improved capital adequacy
Better provisioning
b) Capital Goods & Infrastructure
High order books
Massive government capex
Private capex revival
c) Auto & EV-related industries
Strong sales across passenger/2-wheeler/commercial vehicles
EV ecosystem development
d) Defence & PSU Stocks
Higher orders
Strategic focus on self-reliance
Market sentiment turning positive towards PSUs
e) New-Age & Tech Companies
Improved profitability
Better cash flows
More mature valuations
This multi-sector momentum gives the market a broader base, making the rally durable.
8. Stability in Inflation and Interest Rates
India has managed to maintain relatively stable inflation compared to many countries hit by energy crises, geopolitical tensions, or currency volatility.
RBI’s strict monetary policy helped keep inflation in control.
Rupee stability protects India from imported inflation.
Lower commodity prices benefit India’s manufacturing base.
Stable inflation and controlled borrowing costs help companies expand without pressure on margins.
9. Strong Global Positioning and Favourable Demographics
India’s demographic advantages will drive its markets for decades:
Average age around 29 years
Growing skilled workforce
Urbanization increasing yearly
Digital adoption growing at the fastest pace worldwide
Investors see India as a long-term compounding story rather than a short-term trade.
10. The Sentiment Factor: Confidence is at a Multi-Year High
Market cycles are also influenced by emotions—fear, greed, confidence, uncertainty.
Right now, India is riding on:
High confidence in government
Strong consumer sentiment
Optimistic business outlook
Healthy global reputation
This sentiment acts as the fuel that keeps the rally alive even during global shocks.
Is the Surge Sustainable?
While short corrections will always come, the long-term structure of India’s market rally remains strong due to:
Strong macroeconomic foundation
Corporate earnings visibility
Global capital preference
Domestic investor strength
Multi-sector growth
However, investors should be aware of valuations, especially in midcaps and smallcaps, which may see periodic cooling-off phases.
Conclusion
India’s market surge is not a temporary excitement—it is the result of strong fundamentals, stable policies, global shifts, and rising domestic participation. As the country transitions into a global economic powerhouse, its stock markets are reflecting this journey through steady, multi-layered growth. The next decade is expected to be one of the most promising periods for Indian equities, supported by structural transformation, digitization, manufacturing expansion, and a confident investor base.

AI Trading Secrets and the Indian Psychology Trading Era1. The Rise of AI Trading: Invisible Machines Behind Every Move
AI trading refers to the use of machine learning models, predictive algorithms, neural networks, and automation to make trading decisions. These systems process data far beyond human capability — from price movements and volatility to sentiment and macro signals. The real secret of AI trading is that it doesn’t just “see data”; it learns from historical patterns and adapts to real-time conditions.
AI Trading Secret #1: Feature Engineering Is More Important Than Models
Most people think AI magic lies in fancy models. But in reality, the quality of input data (“features”) determines how good the prediction is. Smart AI traders know how to extract features like:
Volume clusters
Volatility squeeze signals
Order book buildup
High-frequency momentum micro-patterns
These allow AI systems to predict not the “future market”, but the probability of short-term moves.
AI Trading Secret #2: AI Does Not Predict — It Works on Probability Mapping
AI systems calculate probability zones. For example:
68% probability: NIFTY may stay within a certain band
55% probability: a breakout may occur
72% probability: volume expansion confirms momentum
This probabilistic thinking makes AI far more disciplined and emotion-free compared to human traders.
AI Trading Secret #3: Alternative Data Is the True Edge
Modern AI traders are not limited to charts. They read “unseen data,” including:
Social media sentiment
Google Trends
WhatsApp retail buzz
FII/DII trading micro-behaviour
Global ETF flow patterns
Options chain clustering
This alternative data gives AI a big advantage — early detection of shifts that humans take hours or days to notice.
AI Trading Secret #4: Automation Protects You From Human Weakness
AI never:
Overtrades
Gets greedy
Averages blindly
Seeks revenge trades
Breaks rules
This discipline alone gives AI traders a massive edge.
AI Trading Secret #5: AI’s Final Power — Backtesting + Optimization
AI systems test thousands of scenarios:
Different stop losses
Different entries/exits
Different indicators
Different position sizing rules
This creates strategies that are mathematically optimized rather than emotionally guessed.
2. Indian Psychology Trading Era: A New Mindset Born After 2020
India has seen a trading revolution after COVID. Nearly 10+ crore retail traders entered the market. But what makes Indian trading psychology unique?
2A. India’s Retail Trader Behaviour: Emotional Yet Evolving
Indian traders historically operated on:
Tips
WhatsApp calls
Penny stocks
Rumours
Overconfidence
But after 2020, a shift began — more awareness, YouTube learning, Algo tools, and community learning transformed the mindset.
Psychology Trend #1: Hope-Based Trading to Data-Based Trading
Earlier:
People traded based on “feeling Nifty will go up.”
Now:
People analyse:
OI data
PCR
Volume profile
Institutional flow
This marks the birth of the Indian Data-Driven Retail Era.
Psychology Trend #2: From Heroic Trading to Systematic Trading
Earlier:
“Bhai, full margin laga do, kal upper circuit jayega!”
Now:
Traders prefer:
Swing + risk-reward
Stop-loss
Algo automation
Hedged option strategies
The ego of “catching tops and bottoms” is slowly dying.
Psychology Trend #3: Options Mania Changed Behaviour
Indians love leverage. Options gave them:
Low capital
High ROI possibility
Fast trading cycles
This created both growth and chaos. But now traders are learning:
Sell-side edges
Premium decay
IV crush
Weekly expiry psychology
This learning curve is transforming the Indian retail community into a more sophisticated force.
3. Blending AI With Indian Psychology: The New Era of Smart Retail
This is where the magic happens. When AI meets Indian trading psychology, three powerful shifts occur:
Shift #1: AI Reduces Emotional Mistakes of Indian Traders
Indian traders struggle with:
Fear of missing out (FOMO)
Holding losers
Exiting winners early
Overtrading for “thrill”
AI solves these with:
Rule-based systems
Automatic execution
Pre-fixed risk management
Objective signals
Disciplined execution removes 80% emotional damage.
Shift #2: Indian Traders Bring Intuition AI Cannot See
AI understands data, but not “political sentiment,” budget buzz, or Indian-style retail behaviour. Indian traders understand:
Election season moves
Dubbed “operator activity”
Midcap burst cycles
Sectoral rotations
Market mood swings
This intuition plus AI’s objectivity creates the perfect trading duo.
Shift #3: The Rise of Hybrid Systems in India
This is the future:
A blend of human analysis + AI execution.
Example workflow:
Trader analyses volume profile + market structure
AI system generates probability zones
Human selects scenario
AI trades automatically
This hybrid edge will dominate the Indian markets in coming years.
4. Biggest Psychological Barriers Indian Traders Must Break
To fully enter the AI + psychology era, Indian traders must overcome:
Barrier 1: Overconfidence Bias
Thinking “I know the market” instead of “market can do anything.”
Barrier 2: Tip Addiction
Relying on outside voices instead of system-based confidence.
Barrier 3: Quick-Rich Fantasy
Expecting to make 50,000/day with 10,000 capital.
Barrier 4: Revenge Trading
Trying to “win back” lost money emotionally.
Barrier 5: Impulse Trading
Taking a trade because the candle “looked good.”
AI erases most of these — if traders let the system work.
5. What the Future Looks Like
India is entering a very powerful trading era:
AI will handle execution
Humans will handle market structure
Psychology will be increasingly coded into systems
More retail traders will use algos
Market will become more competitive
Only disciplined + data-driven traders will survive
The ones who stay in the game the longest will be those who embrace AI discipline + Indian intuition.

Order Blocks Simplified — How Institutions Control Price🔥 Order Blocks Simplified — How Institutions Control Price
Order Blocks are one of the most important concepts in modern trading — because they show where institutions place REAL positions, not where retail traders guess. 🏦📊
When you understand Order Blocks, you stop chasing random candles and start reading the footprints of smart money. Let’s simplify it. 👇✨
📌 What Is an Order Block? 🧱💰
An Order Block (OB) is a price zone where big institutions (banks, hedge funds, market makers) place massive orders.
These zones often appear before strong market moves — because that’s where smart money builds positions.
Think of an Order Block as:
🔹 The origin of a powerful move
🔹 A zone where price reacts repeatedly
🔹 A region that creates imbalance and momentum
🔹 A point where institutional orders remain unfilled
Once price returns to that zone, institutions fill the rest of their orders, causing another strong reaction. ⚡📈📉
📌 Why Do Order Blocks Matter? 🧠🔥
Because institutions control 80%+ of market volume — not retail.
So when they accumulate or distribute positions:
📈 Trends are born
📉 Reversals appear
🌊 Momentum shifts
💥 Big candles print
Order Blocks give you insight into:
✔️ Where big players enter
✔️ Where real support/resistance exists
✔️ Why price reverses at specific zones
✔️ Where high-probability trades form
It’s the closest thing to tracking the “big money blueprint.”
📌 How Order Blocks Form 🛠️📊
Order Blocks are created during periods of:
🔸 Accumulation (smart money buys quietly)
🔸 Distribution (smart money sells quietly)
Then price explodes away from that zone, showing that a major order cluster was executed.
This explosive move creates:
🔥 Imbalance (FVG)
🔥 Break of structure (BOS)
🔥 A directional trend
These are all signs of institutional activity.
📌 Types of Order Blocks 🟥🟩
🟥 Bearish Order Block (B-OB)
The last bullish candle before a strong bearish move.
It marks institutional selling.
🟩 Bullish Order Block (B-OB)
The last bearish candle before a strong bullish move.
It marks institutional buying.
Both act as high-probability reaction zones.
📌 How Institutions Use Order Blocks 🎯🏦
Institutions don’t enter all at once — their orders are too large.
So they:
1️⃣ Place part of their order
2️⃣ Push price away
3️⃣ Wait for retracement
4️⃣ Fill the rest at the same zone
That zone = the Order Block.
Price returning to an OB is not random — it’s smart money completing their business. 💼✨
📌 How You Trade Order Blocks 🧘♂️📈
✔️ Identify the strong move
Big displacement = institutional interest. 🚀
✔️ Mark the Order Block candle
The last opposite candle before the move. 🔍
✔️ Wait for price to return
Smart money loves to rebalance orders. 🔁
✔️ Enter with confirmation
Candles + structure + reaction = high probability. 🎯
Order Blocks are not predictions — they are reaction zones with a smart-money edge.
📌 Why Order Blocks Work So Well 🌟
Because they are built on:
💧 Liquidity
🧠 Smart Money Behavior
📊 Market Structure
⚡ Supply & Demand
🔥 Institutional Order Flow
This is why OBs outperform classic support/resistance.
They show institutional reality, not retail imagination.
✨ Final Thoughts: The Power of Order Blocks 🚀
Once you learn Order Blocks, everything becomes clearer:
✔️ You know where big money enters
✔️ You know where to wait for price
✔️ You stop chasing bad trades
✔️ You trade WITH smart money
✔️ You catch cleaner, stronger moves
Order Blocks are the foundation of modern price action — simple, powerful, and deeply effective. 🔥📈
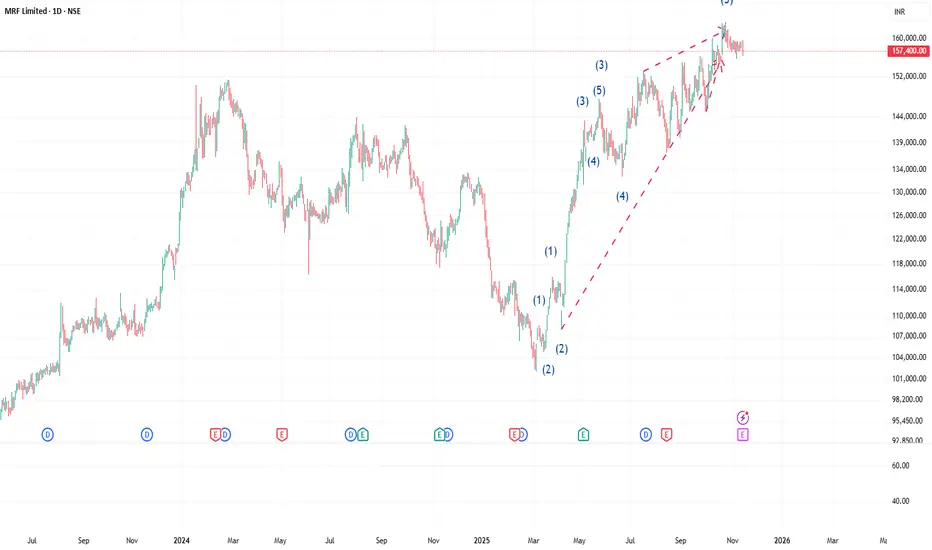
classic example of Ending Diognal Triangle in MRF Dear Trader this is classic case of ending diagonal triangle
this is daily chart of MRF starting from 5th march to 26th may 2025 is five wave which is the third wave and after than up to 4th June 2025 is 4th wave and after that it move up in to three wave which is indicating that this is diagonals triangle
Divergence Secrets What Are Options?
An option is a financial contract that gives the buyer the right, but not the obligation, to buy or sell an underlying asset at a fixed price (called the strike price) on or before a certain date (called expiry). There are two types of options:
Call Option – gives the right to buy.
Put Option – gives the right to sell.
The person who buys an option pays a fee known as the premium. The seller (also called the option writer) receives this premium and has the obligation to carry out the contract if the buyer chooses to exercise it.

Part 2 Intraday Trading Master ClassWhy Option Trading Is Growing Rapidly in India
In recent years, India has seen an explosive rise in options trading due to:
Weekly expiries (more opportunity)
Low entry capital
High liquidity in BankNifty and Nifty options
Rise of online brokerages
Wide availability of market data and tools
Social media awareness
Because of the leverage and excitement options offer, many new traders are drawn to them—though disciplined ones survive longer.
