Part 1 Support And ResistanceIntroduction to Options
Financial markets offer multiple instruments to trade: equities, futures, commodities, currencies, bonds, and derivatives. Among derivatives, options stand out as one of the most flexible and powerful tools available to traders and investors.
An option is not just a bet on direction. It’s a structured contract that can protect a portfolio, generate income, or speculate on volatility. Unlike buying stocks, where profits are straightforward (stock goes up, you gain; stock goes down, you lose), option trading allows for non-linear payoffs. This means you can design trades where:
You profit if the market goes up, down, or even stays flat.
You control large exposure with limited capital.
You cap your risk but keep unlimited potential reward.
Because of this flexibility, options have become an essential part of modern trading strategies across the world, from Wall Street hedge funds to Indian retail investors trading on NSE’s F&O segment.
What are Options? Basic Concepts
At its core, an option is a contract between two parties:
Buyer of the option → Pays a premium for rights.
Seller (writer) of the option → Receives the premium but takes on obligations.
Definition
An option is a financial derivative that gives the buyer the right, but not the obligation, to buy or sell an underlying asset at a predetermined price (called strike price) on or before a certain date (expiry date).
Underlying assets can be:
Stocks (Infosys, Reliance, Apple, Tesla)
Indices (Nifty, Bank Nifty, S&P 500)
Commodities (Gold, Crude oil)
Currencies (USD/INR, EUR/USD)
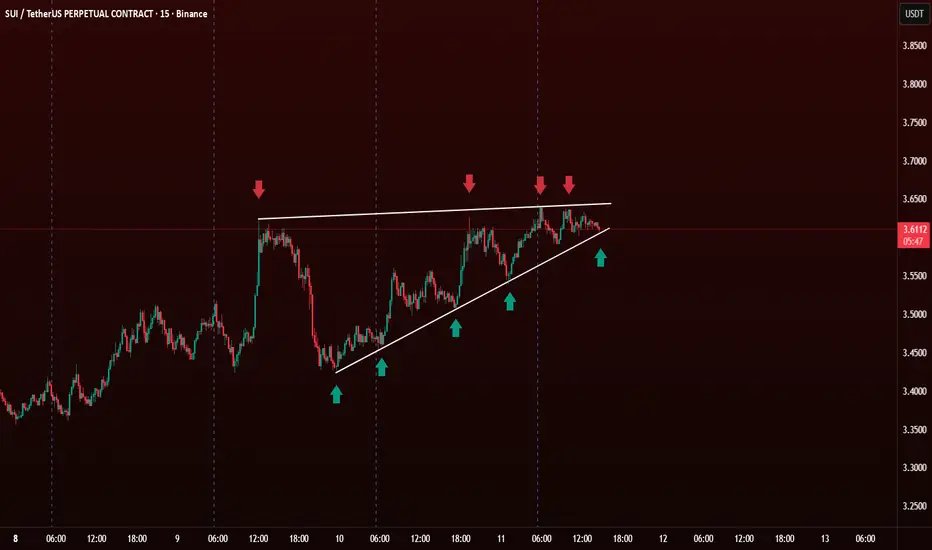
Chart Patterns

Futures and Options (F&O) Trading:1. The Origins of Derivatives and F&O Trading
Derivatives are not new inventions. Their history can be traced back centuries:
Ancient Mesopotamia (2000 BC): Farmers and merchants used contracts to lock in prices of crops to avoid uncertainties.
Japan (17th century): The Dojima Rice Exchange in Osaka became one of the first organized futures markets.
Chicago Board of Trade (1848): The U.S. developed standardized futures contracts for agricultural commodities.
Over time, derivatives expanded beyond commodities into financial assets such as stocks, indices, and currencies. India entered the derivatives market in 2000, when the National Stock Exchange (NSE) introduced index futures on the Nifty 50. Soon after, single-stock futures and options followed. Today, India is one of the largest F&O markets in the world by trading volume.
2. Understanding the Basics of F&O
2.1 What are Futures?
A futures contract is a legal agreement to buy or sell an asset at a predetermined price on a specified future date.
Key points:
Futures are standardized contracts traded on exchanges.
They require margin money (a fraction of the total value) instead of full payment upfront.
Settlement can be in cash or delivery (depending on the market).
Futures are used both for hedging (risk management) and speculation (profit opportunities).
Example:
If a trader expects Reliance stock (currently ₹2,500) to rise, they may buy a futures contract at ₹2,520 expiring in one month. If Reliance rises to ₹2,700, the trader profits ₹180 per share without owning the stock.
2.2 What are Options?
An option is a contract that gives the buyer the right (but not the obligation) to buy or sell an asset at a predetermined price before or on expiry.
Call Option: Right to buy the asset.
Put Option: Right to sell the asset.
The buyer pays a premium to the seller (also called the option writer).
Example:
Nifty is at 20,000. A trader buys a 20,100 Call Option for a premium of ₹100. If Nifty rises to 20,400, the call is worth ₹300, giving a net profit of ₹200. If Nifty falls, the trader loses only the premium (₹100).
2.3 Futures vs. Options
Aspect Futures Options
Obligation Both parties obligated Buyer has right, not obligation
Upfront cost Margin (5–15% of contract) Premium (non-refundable)
Risk Unlimited Limited to premium (for buyer)
Popularity Hedging, arbitrage, speculation Speculation, hedging, income strategies
3. Structure of F&O Trading in India
3.1 Market Segments
Index Derivatives: Nifty 50, Bank Nifty, Sensex.
Stock Derivatives: Futures and options on large-cap and liquid stocks.
Currency Derivatives: USD/INR, EUR/INR, GBP/INR, JPY/INR.
Commodity Derivatives: Gold, silver, crude oil, agricultural products (on MCX/NCDEX).
3.2 Contract Specifications
Lot Size: Minimum quantity per contract (e.g., 25 shares for Reliance).
Expiry Date: Typically last Thursday of every month.
Margin Requirements: Initial margin, mark-to-market margin.
Settlement: Cash settlement is common in India for stock futures/options.
4. The Purpose of F&O Trading
Hedging: Protects against adverse price movements.
Example: An airline hedges fuel cost via crude oil futures.
Speculation: Traders bet on price direction for profit.
Example: Buying Nifty calls expecting a rally.
Arbitrage: Exploiting price differences between cash and derivative markets.
Example: Buying stock in cash market and selling futures at higher price.
Leverage: Allows trading larger positions with limited capital.
5. Advantages of F&O Trading
Risk Management: Ideal tool for hedging.
Leverage: High return potential with limited capital.
Liquidity: High volumes, especially in index derivatives.
Diverse Strategies: Flexibility to design risk-return profiles.
Price Discovery: Derivatives reflect collective market expectations.
6. Risks and Challenges
Leverage Risk: Amplifies both profits and losses.
Complexity: Requires advanced knowledge of pricing, strategies, and Greeks.
Time Decay (for options): Premium erodes as expiry approaches.
Volatility Risk: Sudden swings can wipe out capital.
Emotional Discipline: Traders often fail due to fear and greed.
7. Option Greeks – The Core of Options Trading
Options pricing is influenced by several factors called the Greeks:
Delta: Sensitivity to price changes in the underlying.
Gamma: Rate of change of delta.
Theta: Time decay of option premium.
Vega: Sensitivity to volatility.
Rho: Sensitivity to interest rates.
A successful options trader must understand and apply these Greeks in strategy building.
8. Popular Strategies in F&O Trading
8.1 Futures Strategies
Long Futures: Buy futures when expecting rise.
Short Futures: Sell futures when expecting fall.
Spread Trading: Buy one futures contract, sell another.
8.2 Options Strategies
Covered Call: Hold stock + sell call for income.
Protective Put: Buy put to hedge stock position.
Straddle: Buy call + put at same strike for volatility.
Strangle: Buy out-of-money call + put for cheaper volatility play.
Iron Condor: Sell OTM call and put, buy further OTM options to limit risk.
Conclusion
F&O trading is both an art and a science. It blends mathematics, psychology, and market dynamics into one of the most exciting areas of modern finance. For some, it is a tool of risk management; for others, it is a vehicle for wealth creation.
While futures and options provide unmatched flexibility, their leverage and complexity make them double-edged swords. Success requires education, discipline, strategy, and risk management.
In India and worldwide, F&O markets will continue to evolve, powered by technology, globalization, and growing investor participation. For traders and investors willing to learn, adapt, and respect risk, F&O trading can be an incredibly powerful journey.

Smart Money Secrets in Trading1. What Is Smart Money?
The term “smart money” refers to capital controlled by investors with the most knowledge, resources, and influence in the market. Unlike retail traders who rely on news headlines, gut feelings, or basic technical indicators, smart money entities often have:
Advanced Research – Access to data analytics, machine learning models, and macroeconomic reports that retail traders can’t afford.
Liquidity Power – Ability to move billions of dollars into or out of markets.
Insider Insights – Not illegal insider trading, but a network of analysts, lobbyists, and industry connections that help them anticipate shifts earlier.
Sophisticated Tools – Proprietary algorithms, HFT (High-Frequency Trading) systems, and volume analysis.
When smart money flows into an asset, it often precedes strong trends. Conversely, when it exits, the trend weakens. Spotting these shifts is the cornerstone of trading like institutions.
2. Why Following Smart Money Matters
Most retail traders face three challenges:
They are late. By the time news is published, smart money has already acted.
They are emotional. Fear and greed drive poor decisions.
They are undercapitalized. Limited funds mean smaller risk tolerance and forced exits.
Smart money, on the other hand, has time, patience, and size on its side. They often accumulate positions when the market is quiet and distribute them when hype peaks. If retail traders learn to read footprints left by institutions, they can avoid being trapped and instead ride the waves created by these giants.
3. Smart Money Psychology
Before diving into strategies, it’s crucial to understand how smart money thinks differently:
Accumulation vs. Distribution: Institutions quietly build positions (accumulation) when prices are low and sentiment is negative. Later, they sell (distribution) when retail enthusiasm is high.
Liquidity Hunting: Big players need liquidity to enter and exit. They often push prices into zones where retail traders place stop-loss orders, triggering forced selling or buying, which provides liquidity for institutions.
Contrarian Nature: Smart money often takes positions opposite to the crowd. If everyone is bullish on a stock, institutions might be preparing to sell.
This mindset explains why retail traders often feel “the market is against them.” In reality, they are just on the wrong side of institutional strategies.
4. Smart Money Strategies in Action
a) Wyckoff Method
Richard Wyckoff’s market theory is one of the earliest frameworks for analyzing smart money moves. It breaks market cycles into accumulation, markup, distribution, and markdown.
Accumulation: Institutions quietly buy. Prices stay in a range.
Markup: Price breaks out as buying accelerates.
Distribution: Institutions sell to latecomers.
Markdown: Prices collapse as supply overwhelms demand.
Recognizing these phases helps traders align with institutional activity instead of being victims of it.
b) Volume Profile and Order Flow
Smart money activity often shows up in volume spikes at key price levels.
High Volume Nodes: Suggest accumulation/distribution zones.
Low Volume Nodes: Indicate areas where price moves quickly (little resistance).
Using tools like Volume Profile, Order Flow Charts, or Footprint Charts allows traders to identify where institutions are active.
c) Stop-Loss Hunting
Ever noticed your trade gets stopped out before the price reverses in your favor? That’s not coincidence. Institutions deliberately push prices into stop-loss zones to trigger retail exits, giving them the liquidity to enter positions. Recognizing liquidity pools (clusters of retail stops) helps traders anticipate these moves.
d) Options and Derivatives
Smart money often uses options to hedge or accumulate exposure without moving the underlying asset visibly. For example, unusual options activity (UOA) often precedes big stock moves. Tracking options volume and open interest provides clues about institutional expectations.
e) Dark Pools
Institutions often trade in “dark pools”—private exchanges where large orders are hidden from the public order book. While retail traders can’t see these trades in real time, monitoring dark pool data feeds can reveal where institutions are accumulating or unloading.
5. Indicators of Smart Money Activity
How can a retail trader detect smart money flow? Here are practical signals:
Unusual Volume – Sharp spikes in trading volume without corresponding news often signal institutional activity.
Price Action at Key Levels – Repeated defense of support/resistance zones often shows accumulation or distribution.
Commitment of Traders (COT) Reports – For commodities and forex, COT reports reveal institutional positions.
Options Activity – Large trades in far-dated contracts signal expectations of future moves.
Insider Buying/Selling – Public filings (like Form 4 in the US) show what company executives are doing with their shares.
Market Breadth Divergence – If a few large-cap stocks push indices higher while the majority lag, smart money may be distributing.
6. Smart Money Secrets Retail Traders Overlook
Secret 1: News Is Noise
By the time retail traders act on CNBC headlines, smart money has already positioned. Institutions often use news events to exit positions while retail crowds rush in.
Secret 2: Patience Pays
Smart money is not chasing quick profits—they wait weeks or months to build positions. Retail traders who overtrade often lose by being too impatient.
Secret 3: Fake Moves Before Real Moves
Markets often create false breakouts or sharp wicks to trick retail traders into the wrong direction. These are engineered by big players to grab liquidity.
Secret 4: Scaling In and Out
Institutions never place all their capital at once. They accumulate in layers to avoid moving the market. Retail traders often go “all in” and get wiped out.
Secret 5: Risk Management Is Non-Negotiable
The true secret of smart money isn’t just knowing where to trade—it’s knowing how much to risk. They survive losing streaks by controlling position size and leverage.
Conclusion
Smart money isn’t a mysterious cabal manipulating markets—it’s simply capital managed by those with deeper knowledge, bigger resources, and stronger discipline. Their secrets are not inaccessible; they’re patterns and behaviors visible to those who know where to look.
By understanding accumulation/distribution, liquidity hunting, volume footprints, options flow, and institutional psychology, retail traders can stop fighting the market and instead surf the waves created by the giants.
The real secret, however, is not in any single indicator—it’s in the mindset: patience, discipline, risk management, and the ability to think like an institution rather than a gambler. Once traders internalize this, they transition from being part of the crowd to moving in sync with the real power behind the markets.
Step-by-Step Guide to Crafting a Winning Trading PlanStep 1: Define Your Trading Goals
The foundation of any trading plan begins with clarity. What do you want to achieve?
Financial Goals: Are you trading to build long-term wealth, generate short-term income, or diversify your portfolio?
Return Expectations: Do you expect 10–15% yearly returns like a conservative investor, or are you aiming for aggressive 50–100% gains with higher risk?
Lifestyle Goals: Do you want trading to be a full-time career, a side hustle, or just a way to grow savings?
👉 Example:
Rohit, a part-time trader, sets a goal to earn 15% annually by swing trading stocks. His focus is on consistency, not hitting lottery-style wins. This goal shapes his strategy and risk limits.
Key takeaway: Be realistic. Setting unattainable goals leads to frustration and reckless decisions.
Step 2: Choose Your Trading Style
Your lifestyle, time availability, and personality should define your trading style. The main types are:
Scalping: Ultra-short-term trades, lasting seconds or minutes. Requires speed, focus, and advanced tools.
Day Trading: Multiple trades within a day, no overnight positions. Best for those who can monitor markets closely.
Swing Trading: Positions held for days to weeks. Suitable for part-timers.
Position Trading/Investing: Long-term trades based on fundamentals and macro trends.
👉 Example:
If you have a full-time job, swing trading or position trading may suit you. If you can dedicate 6–8 hours daily, day trading could work.
Key takeaway: Don’t copy someone else’s style. Align your trading style with your time and personality.
Step 3: Select Your Market and Instruments
Markets are vast. A winning plan focuses on a specific set of instruments:
Stocks/Equities – Suitable for both beginners and professionals.
Futures & Options – For leverage and hedging, but carry higher risks.
Forex – Highly liquid, global 24/5 market.
Commodities – Gold, silver, crude oil for diversification.
Cryptocurrencies – Highly volatile, but opportunities exist for skilled traders.
👉 Example:
Meera decides to specialize in Indian equities and Nifty50 futures instead of spreading across forex and crypto. This sharp focus makes her more skilled in her chosen area.
Key takeaway: Specialization beats generalization in trading.
Step 4: Risk Management Rules
No trading plan is complete without risk management. This protects your capital and ensures longevity.
Risk per Trade: Never risk more than 1–2% of your total capital in one trade.
Position Sizing: Adjust trade size based on account size and stop-loss distance.
Stop-Loss: Predetermine exit levels to prevent catastrophic losses.
Diversification: Don’t put all your capital in a single stock or sector.
Drawdown Limits: Decide how much of your capital you’re willing to lose before stopping trading (e.g., 10–15%).
👉 Example:
If you have ₹5,00,000 capital, risking 1% means you can lose only ₹5,000 per trade. If your stop-loss is ₹50 away, your position size should be 100 shares (₹5,000 ÷ ₹50).
Key takeaway: Risk management ensures survival—the #1 rule in trading.
Step 5: Develop Entry and Exit Strategies
A trading plan must clearly define when to enter and exit trades.
Entry Criteria
Technical indicators (RSI, MACD, Moving Averages, Volume Profile).
Chart patterns (Head & Shoulders, Breakouts, Pullbacks).
Fundamental triggers (earnings reports, economic data).
Exit Criteria
Profit targets (e.g., 2:1 risk-reward ratio).
Trailing stop-loss to lock in profits.
Time-based exit (close trade if target not hit in X days).
👉 Example:
Raj trades breakouts. His plan: Enter above resistance with 2:1 risk-reward. Stop-loss below support. Exit if the stock fails to break in 3 days.
Key takeaway: A defined strategy prevents emotional, random decisions.
Step 6: Trading Psychology and Discipline
Even the best plan fails if you lack emotional control.
Stick to the Plan: Don’t override your rules based on gut feelings.
Avoid Overtrading: More trades ≠ more profits. Quality over quantity.
Detach from Money: Think in terms of percentages, not rupees/dollars.
Accept Losses: Losses are part of the game. Don’t chase revenge trades.
👉 Example:
Anita sets 3 trades per day as her maximum. Even if she feels she can take more, she respects her limit to avoid overtrading.
Key takeaway: Discipline is the bridge between planning and profits.
Step 7: Record Keeping and Journaling
A trading plan is incomplete without a trading journal.
Record:
Entry/exit prices
Reason for trade
Outcome (profit/loss)
Emotions felt during trade
👉 Example:
Over 3 months, a trader notices most of his losses come from trades taken outside his strategy. Journaling reveals weak spots.
Key takeaway: Journaling turns mistakes into lessons.
Step 8: Review and Improve the Plan
Markets evolve—so should your plan.
Weekly Reviews: Check if trades followed your rules.
Monthly Reviews: Analyze win rate, risk-reward, and profits.
Quarterly Adjustments: Update strategies if market conditions change.
👉 Example:
A trader’s breakout strategy worked in trending markets but failed in sideways markets. Reviewing allowed him to add a range-trading method.
Key takeaway: Flexibility ensures your plan stays relevant.
Common Mistakes Traders Make When Planning
Overcomplicating the plan with too many indicators.
Ignoring risk management while chasing profits.
Copying another trader’s plan without customization.
Setting unrealistic expectations.
Not reviewing performance regularly.
Conclusion: Turning Your Plan into Profit
A trading plan is more than a document—it’s your personal trading compass. It defines your goals, trading style, risk tolerance, and strategy. More importantly, it keeps emotions in check and brings consistency.
The steps are simple but powerful:
Define goals.
Choose style.
Select instruments.
Manage risk.
Build entry/exit rules.
Control emotions.
Keep records.
Review and improve.
Every professional trader has a plan. Every failed trader ignores one. If you want long-term success, commit to your trading plan, refine it with experience, and let it guide every move.
Sub Brokers in India1. Introduction
The Indian stock market has witnessed remarkable growth in the last two decades, driven by rising investor participation, technological advancements, regulatory reforms, and growing awareness of financial instruments. With millions of new investors opening demat accounts every year, the need for intermediaries who can help bridge the gap between stock exchanges, brokers, and retail clients has become stronger.
While full-service brokers and discount brokers have taken center stage, another critical segment—sub brokers—continues to play a vital role in expanding the reach of capital markets, particularly in semi-urban and rural areas. Sub brokers serve as connectors between brokers and investors, making financial markets more inclusive and accessible.
This essay provides a comprehensive description of sub brokers in India trading, exploring their role, responsibilities, evolution, regulatory framework, benefits, challenges, and future prospects.
2. Who is a Sub Broker?
Definition
A sub broker is an intermediary who is not a direct trading member of stock exchanges like NSE (National Stock Exchange) or BSE (Bombay Stock Exchange) but acts on behalf of a registered stockbroker to assist investors in trading and investing activities.
They essentially work as franchise partners or authorized representatives of larger brokers, helping clients open demat accounts, execute trades, and access investment products.
Key Features
They are agents of main brokers but deal directly with clients.
They help with trading in equities, derivatives, commodities, mutual funds, IPOs, and other products.
They earn a commission on the brokerage generated by their clients.
Sub brokers are particularly active in tier-2 and tier-3 cities, expanding the market penetration of stockbrokers.
3. Evolution of Sub Brokers in India
The sub-broker concept has evolved significantly over time:
1990s – Early Expansion
With economic liberalization, stock market participation began to rise.
Sub brokers emerged as local representatives for brokers, connecting investors to exchanges.
2000s – Rapid Growth
Technological platforms (like ODIN) allowed sub brokers to service clients better.
Franchisee models gained traction, with brokers like Sharekhan, Angel Broking, and India Infoline expanding aggressively through sub brokers.
2010s – SEBI Regulations Tighten
SEBI increased oversight to curb malpractices.
Online brokers emerged, reducing dependency on physical sub brokers.
2020s – Digital Era & Decline in Traditional Sub Brokers
Discount brokers like Zerodha, Upstox, and Groww disrupted the industry with low brokerage and direct online platforms.
Many sub brokers shifted to becoming Authorized Persons (APs) under SEBI regulations.
4. Regulatory Framework
Sub brokers in India are governed by SEBI (Securities and Exchange Board of India) and stock exchanges like NSE, BSE, and MCX.
Key Regulations
Registration Requirement
Sub brokers had to register with SEBI earlier.
Post-2018, SEBI discontinued fresh sub broker registrations, and all were migrated to the Authorized Person (AP) model.
Authorized Person (AP) Model
Sub brokers now operate as APs under a stockbroker’s license.
APs need approval from the stock exchanges (not SEBI directly).
Eligibility Criteria
Minimum age: 18 years.
Must be a citizen of India.
Educational qualification: Preferably 12th pass.
Clean financial background (no defaults or fraud cases).
Compliance & Code of Conduct
Sub brokers must follow KYC (Know Your Customer) norms.
They cannot misrepresent investment opportunities.
They must act in clients’ best interests.
5. Roles and Responsibilities of Sub Brokers
Sub brokers perform multiple critical roles in India’s trading ecosystem:
1. Client Acquisition
Introduce new clients to the stock market.
Build trust and long-term relationships with investors.
2. Account Opening Support
Assist clients in opening demat and trading accounts.
Help with documentation, KYC compliance, and onboarding.
3. Trade Execution
Place buy and sell orders on behalf of clients through the broker’s platform.
Guide clients about different market segments (equity, derivatives, commodities).
4. Advisory Services
Provide insights on stocks, IPOs, and mutual funds.
Educate investors about risks and opportunities.
Although they are not registered advisors, many sub brokers act as informal guides.
5. Local Market Expansion
Brokers leverage sub brokers to penetrate smaller towns.
Sub brokers act as brand ambassadors for the broker in their region.
6. Customer Support
Resolve client issues regarding trading platforms, fund transfers, and settlements.
Offer personalized service that online-only brokers often lack.
6. Business Model of Sub Brokers
The sub-broker model is essentially a revenue-sharing partnership between the stockbroker and the sub broker.
Revenue Generation
Sub brokers earn commissions on brokerage fees charged to clients.
Typical sharing ratio: 60:40 or 70:30, where sub brokers keep 60–70% of the brokerage revenue.
Cost Structure
Initial franchise fees to the broker (₹50,000 – ₹3,00,000 depending on brand).
Infrastructure setup (office, computers, internet, staff).
Ongoing operational costs.
Example
If a client generates brokerage of ₹10,000 in a month:
Sub broker share (70%) = ₹7,000
Broker share (30%) = ₹3,000
7. Advantages of Being a Sub Broker
Low Entry Barrier – Compared to becoming a full-fledged broker, the cost and compliance burden is lower.
Established Brand Support – Sub brokers leverage the brand, technology, and research of large brokers.
High Earning Potential – With a good client base, sub brokers can earn substantial monthly income.
Flexibility – Can operate in chosen geographical regions.
Growing Market – Rising financial literacy ensures continued demand for intermediaries.
8. Challenges Faced by Sub Brokers
Competition from Discount Brokers
Low-cost platforms like Zerodha and Groww reduce reliance on intermediaries.
Regulatory Shifts
Migration from sub broker to AP model created uncertainty.
Technology Upgradation
Need to continuously invest in digital platforms and stay updated.
Client Expectations
Investors expect real-time service and accurate advice.
Misguiding clients can lead to loss of reputation.
Margin Pressure
With declining brokerage rates, earning potential is squeezed.
Famous Brokers and Sub Broker Networks in India
Some leading brokerage houses with large sub broker/authorized person networks include:
Angel One (Angel Broking) – One of the largest franchise networks.
Sharekhan – Known for its strong sub broker model.
ICICI Direct – Leverages bank branches and APs.
Motilal Oswal – Strong research-backed franchise business.
IIFL Securities – Popular in tier-2 and tier-3 towns.
Conclusion
Sub brokers in India have been the backbone of stock market penetration for decades. From being local representatives of big brokers in the 1990s to evolving as Authorized Persons in today’s digital era, they continue to play a vital role in democratizing market access.
While competition from discount brokers and regulatory changes have reshaped their landscape, sub brokers who embrace technology, diversify into multiple financial products, and focus on personalized advisory will thrive in the future.
The Indian capital market is still in its growth phase, and sub brokers will remain a bridge between financial institutions and retail investors, particularly in untapped regions.
Relative Strength Index (RSI) in Trading1. Introduction to RSI
The financial markets operate on the constant tug-of-war between buyers and sellers. Traders have long sought tools to identify when markets are likely to reverse or continue trending. Among the most widely used technical indicators is the Relative Strength Index (RSI), a momentum oscillator developed to measure the speed and magnitude of recent price movements.
The RSI is not just a number; it’s a psychological mirror of the market, showing when traders may be overenthusiastic (overbought) or overly fearful (oversold). Since its introduction in 1978 by J. Welles Wilder Jr., RSI has become a cornerstone of technical analysis, used by retail traders, institutional investors, and even algorithmic systems across stocks, forex, commodities, and crypto.
2. History & Origin of RSI
RSI was introduced in Wilder’s famous book “New Concepts in Technical Trading Systems” (1978), alongside other indicators like the Average True Range (ATR) and Parabolic SAR. Wilder, a mechanical engineer turned trader, believed in quantifying market psychology.
Before RSI, momentum indicators existed, but they lacked a standardized scale. Wilder’s breakthrough was normalizing momentum into a range between 0 and 100, making it universally applicable and easier to interpret. Over time, RSI’s simplicity and adaptability allowed it to transcend asset classes, from Dow Jones stocks in the 80s to Bitcoin and Ethereum today.
3. Mathematical Formula & Calculation
The RSI formula is:
𝑅
𝑆
𝐼
=
100
−
(
100
1
+
𝑅
𝑆
)
RSI=100−(
1+RS
100
)
Where:
RS (Relative Strength) = Average Gain / Average Loss (over a set period, usually 14)
Steps:
Calculate the average of “up closes” and “down closes” for 14 periods.
Divide average gain by average loss = RS.
Plug RS into the RSI formula to scale between 0–100.
Example:
Average Gain = 1.5%
Average Loss = 0.75%
RS = 1.5 / 0.75 = 2
RSI = 100 – = 66.6
Thus, RSI = 67 indicates bullish momentum but not yet overbought.
4. Understanding RSI Levels
Above 70 → Overbought (possible correction)
Below 30 → Oversold (possible rebound)
Around 50 → Neutral (balance between buyers & sellers)
Some traders adjust:
80/20 levels for stronger trends
60/40 levels in trending markets (RSI may not touch extremes often)
RSI levels act as zones of probability, not absolute buy/sell signals.
5. RSI in Different Market Conditions
Trending Markets: RSI can remain overbought (>70) or oversold (<30) for extended periods. For example, in strong bull runs, RSI may hover around 70–80.
Ranging Markets: RSI oscillates smoothly between 30 and 70, making it excellent for mean-reversion strategies.
Volatile Markets: RSI signals can be whipsawed, requiring filters like moving averages or multiple timeframe confirmations.
6. RSI Trading Strategies
a) Overbought & Oversold Strategy
Buy when RSI < 30 (oversold) and price shows reversal.
Sell when RSI > 70 (overbought) and reversal signs appear.
Works best in sideways markets.
b) Divergence Strategy
Bullish Divergence: Price makes lower lows, RSI makes higher lows → reversal likely upward.
Bearish Divergence: Price makes higher highs, RSI makes lower highs → reversal likely downward.
c) RSI Swing Rejections
A method Wilder emphasized:
Bullish: RSI goes below 30, bounces back, rejects a second drop, then crosses above previous high.
Bearish: RSI goes above 70, falls, rejects second rise, then breaks lower.
d) RSI Trendlines & Breakouts
Traders draw trendlines on RSI itself, treating it like a price chart. Breakouts often lead price action.
e) RSI + Moving Averages
Use RSI to confirm MA crossovers. Example: RSI > 50 when 50-day MA crosses above 200-day MA strengthens bullish trend.
7. RSI for Different Timeframes
Intraday/Scalping (1–5 min): RSI is very sensitive. Traders use shorter settings (7-period RSI).
Swing Trading (1D–1W): Classic 14-period RSI works well. Divergences are powerful.
Long-Term Investing (1M): RSI identifies market cycles; buying when RSI < 30 on monthly charts often captures generational opportunities.
8. Combining RSI with Other Indicators
a) RSI + MACD
MACD confirms trend direction; RSI signals entry/exit.
Example: MACD bullish crossover + RSI near 40–50 = strong buy signal.
b) RSI + Bollinger Bands
RSI overbought + price at upper band → higher reversal probability.
RSI oversold + price at lower band → bounce likely.
c) RSI + Volume Profile
High volume at RSI extremes confirms stronger reversals.
d) RSI + Moving Averages
RSI trending above 50 while price is above MA = bullish confirmation.
Conclusion
The Relative Strength Index (RSI) remains one of the most effective momentum oscillators in trading history. From J. Welles Wilder’s manual calculations in the 70s to modern-day algorithmic applications, RSI has proven its adaptability.
Its power lies not in blindly buying at 30 or selling at 70, but in understanding context, divergences, swing rejections, and market psychology. While it has limitations in trending markets, when combined with other tools, RSI becomes a formidable ally.
For traders, RSI is more than a number. It’s a window into collective human behavior, showing how emotion, momentum, and probability interact to move markets. Whether you’re day-trading forex, swing-trading stocks, or investing in crypto, RSI remains a timeless guide to navigating uncertainty.
Part 9 Trading Master ClassHow Options Work in Practice
Option buyers have limited risk (premium paid) but unlimited profit potential (in calls if stock rises, in puts if stock falls).
Option sellers have limited profit (premium received) but potentially unlimited risk.
This asymmetric payoff structure creates a market where traders, hedgers, and institutions interact.
Key Concepts
Intrinsic Value: Real profit if exercised immediately.
Time Value: Premium paid for potential future movement.
In-the-Money (ITM): Option already profitable if exercised.
Out-of-the-Money (OTM): Option has no intrinsic value, only time value.
At-the-Money (ATM): Strike = current market price.
Why Traders Use Options
Hedging – Protect portfolio against price swings.
Speculation – Bet on future price movements with smaller capital.
Income Generation – Sell options and earn premiums.
Arbitrage – Exploit mispricing between spot and derivatives.
Options Pricing Models
Two main models:
Black-Scholes Model: Uses volatility, strike, expiry, and interest rates to price options.
Binomial Model: Breaks time into steps, considering probability of price moves.
Factors affecting option prices:
Spot price of underlying
Strike price
Time to expiry
Volatility
Interest rates
Dividends

Part 8 Trading Master ClassIntroduction to Options
Financial markets provide several instruments to trade and invest. Among equities, futures, commodities, and currencies, options trading has gained significant popularity worldwide, including India. Options are not just speculative tools; they are also powerful instruments for hedging, income generation, and risk management.
An option is essentially a derivative contract—its value is derived from an underlying asset like a stock, index, commodity, or currency. Unlike direct stock ownership, an option gives the buyer rights but not obligations. This unique feature makes them versatile but also complex for beginners.
To truly master options, one must understand not only the basic definitions but also pricing, market psychology, and strategies.
Basic Terminology
Before diving deeper, let’s go through the essential terms:
Option Contract: Agreement between buyer and seller based on an underlying asset.
Underlying Asset: Stock, index, commodity, or currency.
Strike Price: Pre-decided price at which the option can be exercised.
Expiry Date: The last date on which the option can be exercised.
Premium: Price paid by the buyer to acquire the option.
Lot Size: Minimum quantity for which an option can be traded.
European vs. American Options: European can be exercised only on expiry; American anytime before expiry.
Call & Put Options Explained
At the heart of option trading are two instruments: Calls and Puts.
Call Option: Gives the buyer the right (not obligation) to buy the asset at the strike price.
Buyers expect prices to rise.
Sellers (writers) expect prices to stay flat or fall.
Put Option: Gives the buyer the right (not obligation) to sell the asset at the strike price.
Buyers expect prices to fall.
Sellers expect prices to stay flat or rise.
📌 Example:
If Reliance stock trades at ₹2500:
A ₹2600 call may cost ₹50 premium. If the stock rises to ₹2700, profit = (2700-2600-50) = ₹50 per share.
A ₹2400 put may cost ₹40. If stock falls to ₹2200, profit = (2400-2200-40) = ₹160 per share.

Part 7 Trading Master Class Why Traders Use Options
Hedging – Protect portfolio against price swings.
Speculation – Bet on future price movements with smaller capital.
Income Generation – Sell options and earn premiums.
Arbitrage – Exploit mispricing between spot and derivatives.
Options Pricing Models
Two main models:
Black-Scholes Model: Uses volatility, strike, expiry, and interest rates to price options.
Binomial Model: Breaks time into steps, considering probability of price moves.
Factors affecting option prices:
Spot price of underlying
Strike price
Time to expiry
Volatility
Interest rates
Dividends
Strategies in Option Trading
Options allow creation of custom payoff structures. Strategies are classified as:
A. Protective Strategies
Protective Put – Holding stock + buying put (like insurance).
Covered Call – Holding stock + selling call.
B. Income Strategies
Iron Condor – Selling OTM call & put, buying further OTM options.
Strangle/Straddle Selling – Profit from time decay when market is range-bound.
C. Speculative Strategies
Long Straddle – Buy ATM call + put, profit from big moves.
Bull Call Spread – Buy lower strike call, sell higher strike call.
Bear Put Spread – Buy higher strike put, sell lower strike put.
📊 Each strategy has its risk/reward profile. Professional traders combine them depending on market conditions.

Part 4 Learn Institutional Trading Introduction to Options
Financial markets provide several instruments to trade and invest. Among equities, futures, commodities, and currencies, options trading has gained significant popularity worldwide, including India. Options are not just speculative tools; they are also powerful instruments for hedging, income generation, and risk management.
An option is essentially a derivative contract—its value is derived from an underlying asset like a stock, index, commodity, or currency. Unlike direct stock ownership, an option gives the buyer rights but not obligations. This unique feature makes them versatile but also complex for beginners.
To truly master options, one must understand not only the basic definitions but also pricing, market psychology, and strategies.
Basic Terminology
Before diving deeper, let’s go through the essential terms:
Option Contract: Agreement between buyer and seller based on an underlying asset.
Underlying Asset: Stock, index, commodity, or currency.
Strike Price: Pre-decided price at which the option can be exercised.
Expiry Date: The last date on which the option can be exercised.
Premium: Price paid by the buyer to acquire the option.
Lot Size: Minimum quantity for which an option can be traded.
European vs. American Options: European can be exercised only on expiry; American anytime before expiry.
How Options Work in Practice
Option buyers have limited risk (premium paid) but unlimited profit potential (in calls if stock rises, in puts if stock falls).
Option sellers have limited profit (premium received) but potentially unlimited risk.
This asymmetric payoff structure creates a market where traders, hedgers, and institutions interact.

Part 3 Learn Institutional Trading Understanding Options
An option is a financial contract that gives the holder the right, but not the obligation, to buy or sell an underlying asset at a specified price, called the strike price, before or on a specific date known as the expiry date. Options are derivatives, meaning their value is derived from an underlying asset like stocks, indices, commodities, or currencies.
Types of Options
Call Option
A call option gives the buyer the right to buy the underlying asset at the strike price. Buyers expect the price to rise.
Example: If Infosys stock trades at ₹1500 and a trader buys a call with a strike price of ₹1550 for ₹30, they can purchase the stock at ₹1550, even if it rises to ₹1600.
Put Option
A put option gives the buyer the right to sell the underlying asset at the strike price. Buyers expect the price to fall.
Example: If Infosys stock trades at ₹1500 and a trader buys a put with a strike price of ₹1450 for ₹25, they can sell the stock at ₹1450, even if it drops to ₹1400.
Option Pricing and Factors Affecting Value
Option pricing is influenced by several variables, known as the Option Greeks:
Delta (Δ): Measures how much the option price moves with a ₹1 change in the underlying asset.
Call options have positive delta; put options have negative delta.
Gamma (Γ): Measures how delta changes as the underlying asset moves.
Theta (Θ): Represents time decay – the rate at which an option loses value as expiry approaches.
Vega (V): Sensitivity to volatility in the underlying asset. High volatility increases option premiums.
Rho (ρ): Sensitivity to interest rate changes.
Other factors include:
Underlying asset price
Strike price relative to market price
Time to expiry
Market volatility
Understanding these factors is crucial for effective trading and risk management.

Part 2 Ride The Big MovesBasic Option Strategies
For Beginners
Long Call – Buy call, profit if price rises.
Long Put – Buy put, profit if price falls.
Covered Call – Own stock and sell call, earn premium.
Protective Put – Own stock and buy put to protect against downside.
Intermediate Strategies
Straddle – Buy call + put at same strike, profit from volatility.
Strangle – Buy OTM call + put, cheaper than straddle.
Bull Call Spread – Buy lower strike call, sell higher strike call.
Bear Put Spread – Buy higher strike put, sell lower strike put.
Advanced Strategies
Iron Condor, Butterfly Spread, Calendar Spread – mainly for experienced traders looking for defined risk/reward.
Advantages of Option Trading
Leverage: Small investment controls large position.
Hedging: Protect stock portfolios.
Flexibility: Profit in rising, falling, or sideways markets.
Limited Loss: Buyers lose only the premium paid.
Risks in Option Trading
Premium Loss: 100% loss if option expires worthless.
Time Decay: OTM options lose value fast near expiry.
Complexity: Advanced strategies require precise planning.
Unlimited Risk: Selling naked calls can be disastrous.

Part 1 Ride The Big MovesWhat is an Option?
An option is a financial contract that gives the buyer the right, but not the obligation, to buy or sell an underlying asset at a predetermined price (called the strike price) on or before a specific date (called the expiry date).
There are two main types of options:
Call Option – Gives the buyer the right to buy the underlying asset.
Put Option – Gives the buyer the right to sell the underlying asset.
Example:
If you buy a call option on stock XYZ with a strike price of ₹500, you can buy the stock at ₹500 even if the market price rises to ₹600.
If you buy a put option on stock XYZ at ₹500, you can sell it at ₹500 even if the market price falls to ₹400.
How Options Work
Call Option Buyer: Expects the price to rise. Pays a premium upfront. Profit = Unlimited (price can rise indefinitely) – Premium paid. Loss = Premium paid (if price falls below strike).
Put Option Buyer: Expects the price to fall. Pays a premium upfront. Profit = Strike – Price (max is strike – 0) – Premium paid. Loss = Premium paid.
Option Seller (Writer): Receives the premium. Takes obligation to buy/sell if the buyer exercises. Risk = Can be unlimited for call sellers.
Factors Affecting Option Prices (Option Greeks)
Option price is influenced by:
Delta (Δ) – How much the option price moves with a 1-point move in underlying.
Gamma (Γ) – How fast delta changes with underlying price.
Theta (Θ) – Time decay; how much value the option loses each day.
Vega (V) – Sensitivity to volatility in the underlying asset.
Rho (ρ) – Sensitivity to interest rates.
Tip: Time decay is crucial – options lose value as expiry approaches if the underlying doesn’t move favorably.

Institutional Trading Strategies1. Understanding Institutional Trading
Institutional trading refers to trading executed by large organizations, which can move millions or billions of dollars in assets. Unlike retail traders, institutions face unique challenges:
Liquidity impact: Large trades can move markets significantly.
Market timing: Buying or selling at the wrong time can trigger price slippage.
Regulatory considerations: Compliance with SEC or SEBI regulations, insider trading rules, and disclosure requirements.
Information asymmetry: Institutions often have access to research and proprietary data unavailable to retail traders.
Because of these factors, institutions adopt strategies designed to minimize risk and market impact while maximizing returns.
2. Core Institutional Trading Strategies
A. Algorithmic & Quantitative Strategies
Institutions often use advanced algorithms to automate trading and exploit tiny inefficiencies.
VWAP (Volume Weighted Average Price)
Objective: Buy or sell close to the day’s average price.
Mechanics: Break large orders into smaller chunks executed over time.
Benefit: Minimizes market impact and slippage.
TWAP (Time Weighted Average Price)
Objective: Spread trades evenly over a set time.
Ideal for: Illiquid stocks or executing predictable, steady flows.
Liquidity-Seeking Algorithms
Scan multiple venues for the best prices.
Avoids pushing prices against themselves when trading large volumes.
Statistical Arbitrage
Exploits small price discrepancies between correlated securities.
Typically high-frequency, requires strong computing power.
B. Execution-Based Strategies
Focus on how to enter and exit positions efficiently without alerting the market.
Iceberg Orders
Only a small portion of the total order is visible.
Reduces market reaction while enabling execution of large trades.
Dark Pool Trading
Off-exchange venues where large trades can happen anonymously.
Reduces market impact but may have slightly less favorable pricing.
Block Trades
Very large trades negotiated privately.
Often used for institutional rebalancing, mergers, or index adjustments.
C. Directional / Market Bias Strategies
These involve taking a view on price direction but with institutional tools.
Momentum Trading
Buy assets trending up, sell assets trending down.
Often combined with quant signals to detect strong, persistent moves.
Mean Reversion
Exploit temporary price swings away from average value.
Requires sophisticated risk management for stop-losses.
Pairs Trading
Go long on one stock and short a correlated one.
Goal: Profit from relative moves while minimizing market exposure.
D. Fundamental & Event-Driven Strategies
Institutions often trade based on macro, company-specific, or event-driven catalysts.
Merger Arbitrage
Buy target stock and sell acquirer’s stock in announced mergers.
Profits from narrowing spread between deal price and market price.
Earnings Plays
Long/short positions around earnings announcements.
Often uses options for asymmetric risk-reward.
Macro Strategies
Trade based on interest rates, currency movements, commodities, or geopolitical events.
Hedge funds excel here, often using derivatives to leverage insights.
E. Index and ETF Strategies
Institutions moving large money often track or hedge index exposure.
Index Arbitrage
Exploit differences between index futures and underlying stocks.
Requires precise timing and low-latency systems.
ETF Creation/Redemption
Institutions can create or redeem ETF shares to capitalize on pricing inefficiencies.
Minimizes market exposure while arbitraging between ETF price and underlying assets.
F. Portfolio Rebalancing
Large institutions must rebalance periodically:
Quarterly/annual adjustments to match benchmarks.
Use program trading to spread trades over multiple sessions.
Incorporate risk management rules to avoid unwanted exposure.
3. Risk Management in Institutional Trading
Institutions manage risk carefully because a single trade can move millions in losses:
Position Sizing: Limit exposure per trade relative to portfolio.
Stop-Loss & Hedging: Use options, futures, or inverse ETFs.
Diversification: Across sectors, geographies, and instruments.
Liquidity Risk Control: Avoid positions that can’t be exited quickly.
4. Advantages of Institutional Trading
Access to capital for bulk trades.
Information edge through research teams.
Reduced transaction costs via negotiated fees and algorithmic efficiency.
Ability to influence market structure for advantageous execution.
5. Key Challenges
Slippage and Market Impact: Large trades can shift prices.
Regulatory Scrutiny: Must comply with reporting and trading rules.
Technology Dependency: Relies heavily on algorithms and low-latency infrastructure.
Competition: Other institutions using similar strategies can reduce alpha.
6. Examples of Institutional Trading in Practice
Mutual Funds:
Execute index rebalancing using VWAP/TWAP algorithms.
Hedge Funds:
Exploit statistical arbitrage, pairs trading, and macro events.
Investment Banks:
Facilitate block trades and ETF arbitrage for clients.
Pension Funds:
Focus on long-term rebalancing and risk-controlled investments.
In summary: Institutional trading is about strategically moving large amounts of capital while controlling risk, minimizing market impact, and exploiting both structural and event-driven opportunities. Their success lies in technology, research, execution discipline, and risk management rather than guessing market direction.
Stock Market Gains: A Comprehensive Analysis1. Introduction
The stock market is a reflection of the economic and financial health of a nation. It serves as a platform where investors trade ownership shares in publicly listed companies. Stock market gains represent the increase in the value of investments over time and are a key measure of financial success for both individual and institutional investors. These gains can be realized in the form of capital appreciation, dividends, or a combination of both.
Understanding stock market gains requires examining not only market mechanics but also broader economic, psychological, and geopolitical factors. They are influenced by a complex interplay of microeconomic and macroeconomic forces, corporate performance, investor sentiment, and global market dynamics.
2. Types of Stock Market Gains
Stock market gains generally fall into two broad categories:
2.1 Capital Gains
Capital gains occur when the price of a stock increases from the time it was purchased. For instance, if an investor buys a stock at ₹100 and sells it at ₹150, the capital gain is ₹50 per share. Capital gains can be:
Short-term: Gains on assets held for less than a year. Typically, these are taxed at higher rates in many countries.
Long-term: Gains on assets held for more than a year, often benefiting from lower tax rates.
Capital gains are highly influenced by market volatility, investor sentiment, and company performance.
2.2 Dividend Gains
Dividends are periodic payments made by companies to shareholders from their profits. They provide passive income and can significantly contribute to long-term wealth creation. For example, an investor holding 100 shares of a company paying ₹5 per share annually will earn ₹500 per year in dividends. Dividend gains are particularly attractive in defensive and high-growth sectors, where companies distribute consistent dividends while maintaining growth.
2.3 Total Returns
A comprehensive view of stock market gains combines capital gains and dividends, which together form the total return. Total returns are crucial for understanding the real profitability of investments over time.
3. Factors Driving Stock Market Gains
3.1 Economic Indicators
Stock market performance is closely tied to economic conditions:
GDP Growth: Higher economic growth often translates into better corporate earnings, boosting stock prices.
Inflation: Moderate inflation is generally positive for stock markets, while hyperinflation erodes gains.
Interest Rates: Lower interest rates reduce the cost of borrowing, stimulate economic activity, and often drive stock market gains. Conversely, rising rates may dampen gains.
3.2 Corporate Performance
Individual companies’ financial health directly affects their stock prices:
Revenue and Profit Growth: Companies with consistent earnings growth attract investors, pushing stock prices higher.
Innovation and Market Leadership: Firms that innovate or dominate their sectors tend to deliver superior gains.
Efficient Management: Strong corporate governance and effective management strategies often lead to sustainable gains.
3.3 Market Sentiment
Investor behavior and psychology play a significant role:
Bullish Sentiment: Optimism about future growth drives buying pressure, increasing stock prices.
Fear and Panic: Negative news or global uncertainty can trigger sell-offs, temporarily reducing gains.
Herd Behavior: Investors often follow trends, amplifying market movements and influencing gains.
3.4 Geopolitical Factors
Global events can have an outsized impact on stock market gains:
Trade wars and tariffs can affect corporate profits.
Political instability may deter foreign investment.
Geopolitical tensions in energy-producing regions can drive energy stock gains.
3.5 Technological and Sectoral Trends
Emerging industries often generate substantial gains for early investors:
Tech and AI Sectors: Companies in artificial intelligence, cloud computing, and semiconductors have shown explosive stock market gains.
Renewable Energy: Growth in solar, wind, and battery technology stocks is contributing to modern market gains.
Healthcare and Biotechnology: Innovations in pharmaceuticals and biotech often lead to rapid capital appreciation.
4. Measuring Stock Market Gains
4.1 Index Performance
Stock market gains are often measured using market indices like the Nifty 50, S&P 500, or Dow Jones Industrial Average. Indices aggregate individual stock performances to provide a snapshot of overall market trends.
Absolute Gains: The simple increase in index value over time.
Percentage Gains: Provides a normalized view of growth, making it easier to compare different periods.
4.2 Individual Stock Performance
Investors track gains at the individual stock level:
Price-to-Earnings (P/E) Ratio: A valuation metric indicating whether a stock is priced reasonably relative to earnings.
Return on Equity (ROE): Measures profitability and efficiency in generating gains for shareholders.
Earnings Per Share (EPS) Growth: Predicts future potential gains based on historical performance.
4.3 Risk-Adjusted Returns
Not all gains are equally valuable. Sharpe ratio, beta, and alpha are used to measure gains relative to risk, helping investors identify whether they are being adequately compensated for taking on market risk.
5. Strategies to Maximize Stock Market Gains
Investors employ a variety of strategies to maximize gains:
5.1 Long-Term Investing
Buy-and-hold strategies capitalize on compounding gains over time.
Focus on fundamentally strong companies with consistent revenue and profit growth.
Dividend reinvestment enhances long-term total returns.
5.2 Value Investing
Identify undervalued stocks trading below their intrinsic value.
Purchase during market corrections to maximize potential gains when the market recognizes their true worth.
5.3 Growth Investing
Focus on companies with above-average growth potential.
Higher risk but the potential for extraordinary capital gains exists.
5.4 Technical Analysis
Use price charts, moving averages, volume, and other indicators to time entry and exit points.
Helps traders capture short-term gains in volatile markets.
5.5 Diversification
Spread investments across sectors, geographies, and asset classes.
Mitigates risk while maintaining potential for gains.
5.6 Leveraging Derivatives
Options, futures, and other derivatives can magnify gains, but also increase risk.
Requires careful strategy and risk management.
6. Market Cycles and Gains
Stock market gains are not linear; they fluctuate according to market cycles:
6.1 Bull Markets
Characterized by optimism, rising stock prices, and strong gains.
Investors often see high capital gains during these periods.
6.2 Bear Markets
Stock prices decline, eroding gains temporarily.
Savvy investors may find opportunities to accumulate quality stocks at lower prices.
6.3 Sideways Markets
Periods of consolidation or minimal growth.
Dividend gains and strategic trading can still provide meaningful returns.
7. Psychological Aspects of Gains
Investor psychology significantly impacts the realization of gains:
Fear of Missing Out (FOMO) can drive impulsive purchases.
Overconfidence may lead to excessive risk-taking.
Loss Aversion can prevent selling winning stocks, reducing potential gains.
Patience and Discipline are essential for consistent long-term gains.
8. Risks and Challenges
Stock market gains are not guaranteed. Several factors can limit or reverse gains:
Market Volatility: Rapid price swings can erode capital gains.
Economic Downturns: Recessions can reduce corporate earnings and stock prices.
Inflation and Currency Risk: Erode real returns, particularly for international investments.
Regulatory Changes: Sudden policy shifts can impact entire sectors.
Fraud and Mismanagement: Corporate scandals or governance failures can wipe out gains.
Technology, AI, and the Future of Gains
Technology is reshaping how gains are generated and tracked:
Algorithmic Trading: Uses AI to capture short-term gains at scale.
Robo-Advisors: Offer automated portfolio management to maximize long-term gains.
Big Data and Analytics: Help investors identify trends and make data-driven decisions.
The future of stock market gains will likely be influenced by these technological advances, increasing efficiency and access to opportunities globally.
Conclusion
Stock market gains are multifaceted, driven by economic fundamentals, corporate performance, investor psychology, and global events. Understanding the types of gains, factors influencing them, and strategies to maximize returns is essential for both individual and institutional investors. While the potential for extraordinary returns exists, risks and volatility are inherent, necessitating careful analysis, discipline, and a long-term perspective.
In essence, achieving meaningful stock market gains requires a balance of knowledge, strategy, patience, and adaptability to market conditions. Investors who combine analytical insight with disciplined execution are best positioned to navigate the complexities of the financial markets and capitalize on growth opportunities.

Inflation Nightmare ContinuesHistorical Background of Inflation Crises
To understand why current inflation feels like a nightmare, it is important to examine historical episodes where inflation destroyed economies and societies:
Weimar Germany (1920s) – After World War I, Germany printed money to pay reparations and fund government expenses. Prices doubled every few days, bread became unaffordable, and savings were wiped out. This hyperinflation destroyed the middle class and sowed political instability, eventually contributing to the rise of extremism.
Latin America (1980s–90s) – Countries like Argentina, Brazil, and Peru faced chronic inflation and hyperinflation due to poor fiscal discipline, currency devaluations, and external debt crises. Entire generations learned to spend salaries within hours of being paid, knowing that prices would rise dramatically by the next day.
Zimbabwe (2000s) – Perhaps one of the most extreme cases of hyperinflation, Zimbabwe experienced annual inflation in the billions of percent. Currency became worthless, and barter trade replaced the monetary system.
Global Stagflation (1970s) – Triggered by oil shocks and loose monetary policy, the developed world faced both high inflation and high unemployment. It was a nightmare scenario for policymakers, since raising interest rates to curb inflation also deepened unemployment, while stimulating growth further fueled inflation.
These examples highlight a crucial point: inflation is not simply about rising prices; it is about the breakdown of trust in money itself. Once the population loses confidence that their currency holds value, the entire economic and social order comes under threat.
Causes of the Current Inflation Nightmare
The ongoing global inflation wave is different from past episodes in its complexity. It is not caused by a single factor, but rather a convergence of multiple structural issues:
1. Post-Pandemic Demand Surge
When COVID-19 restrictions were lifted, pent-up demand for goods, travel, housing, and entertainment surged. Households that had saved during lockdowns spent aggressively. The sudden imbalance between strong demand and limited supply triggered price spikes.
2. Supply Chain Disruptions
Even though demand came back quickly, global supply chains took years to recover. Shipping costs skyrocketed, raw material shortages became common, and semiconductor shortages crippled industries from automobiles to electronics.
3. Energy Price Shocks
Geopolitical tensions, including the Russia–Ukraine war, severely disrupted oil and natural gas supplies. Europe in particular faced skyrocketing energy bills, which filtered into the cost of everything from heating to fertilizer.
4. Food Inflation
Climate change events such as droughts, floods, and heatwaves reduced agricultural productivity. Coupled with disrupted fertilizer supply chains, global food prices surged, creating a humanitarian as well as an economic crisis.
5. Loose Monetary Policy Legacy
For over a decade, central banks in the U.S., Europe, Japan, and other advanced economies pursued ultra-low interest rates and quantitative easing to stimulate growth. This cheap money created asset bubbles and an expectation of endless liquidity. When inflation surged, central banks had to pivot sharply, but the lag effect meant prices had already spiraled.
6. Labor Market Shifts
In many countries, post-pandemic labor shortages emerged due to early retirements, changes in work preferences, or immigration restrictions. Employers raised wages to attract workers, fueling wage-price spirals.
7. Geopolitical Fragmentation
The shift toward deglobalization, reshoring, and protectionism has added to costs. When supply chains are localized for security reasons, they often become less efficient and more expensive, driving structural inflation.
How Inflation Impacts Households
For ordinary families, inflation is not an abstract economic term—it is felt in daily struggles.
Erosion of Purchasing Power: Salaries often do not keep pace with rising prices, meaning households can afford less with the same income. Groceries, fuel, school fees, and healthcare eat up larger portions of budgets.
Savings Destruction: Fixed deposits and bank savings accounts yield little compared to inflation. A 6% annual return is meaningless when inflation is 8%. This pushes households into riskier investments.
Housing Stress: Rising interest rates make mortgages costlier. Rent also rises as landlords pass on higher costs.
Psychological Toll: The constant stress of managing finances in an inflationary environment reduces consumer confidence and long-term planning. Families delay weddings, education, and retirement investments.
Impact on Businesses
Rising Input Costs: Raw materials, energy, and transportation become more expensive, squeezing margins.
Unstable Pricing: Companies face difficulties in setting long-term contracts when costs are volatile.
Debt Burden: Higher interest rates increase borrowing costs, particularly painful for small businesses.
Investment Delays: Businesses often delay expansion projects due to uncertain demand and financing conditions.
Wage Pressures: To retain talent, companies must raise wages, further driving costs upward.
This environment often results in a vicious cycle where businesses either pass on costs to consumers, fueling further inflation, or cut back on production, worsening economic stagnation.
Policy Dilemmas
Central banks and governments face a unique challenge: how to curb inflation without destroying growth.
Central Bank Tightening – Raising interest rates helps reduce demand, but also risks triggering recessions.
Fiscal Policy – Governments can subsidize food, fuel, or housing, but that adds to fiscal deficits and sometimes worsens inflation.
Supply-Side Reforms – Long-term solutions like improving infrastructure, energy independence, or agricultural productivity take time.
Communication Crisis – Policymakers struggle to maintain credibility. If the public believes central banks cannot control inflation, expectations of rising prices become self-fulfilling.
This is the nightmare scenario: monetary tools are blunt, fiscal tools are politically constrained, and structural reforms are slow.
Global Perspective
United States: Persistent wage inflation, strong consumer demand, and housing shortages make it difficult for the Federal Reserve to achieve its 2% inflation target.
Europe: Energy dependence and fragmented fiscal policies complicate the European Central Bank’s task.
Emerging Markets: Countries like India and Brazil face imported inflation through higher oil and food prices. Weaker currencies exacerbate the problem.
Developing Nations: Many African and South Asian countries face “stagflation” – high inflation with weak growth, often worsened by debt crises.
Social and Political Fallout
Inflation is not just an economic issue; it destabilizes societies:
Rising Inequality: Wealthier households with assets like real estate or equities can hedge against inflation, while the poor, who spend most income on essentials, suffer disproportionately.
Erosion of Trust in Institutions: When inflation persists, people lose faith in central banks, governments, and financial systems.
Political Populism: Inflation often fuels populist movements promising subsidies, wage increases, or price controls—measures that may worsen long-term stability.
Unrest and Protests: History shows that food and fuel inflation often sparks protests, riots, and even revolutions.
The Nightmare if Inflation Persists
If the inflation nightmare continues unchecked, the world could face:
Currency Crises in weaker economies.
Debt Defaults by heavily indebted nations unable to finance rising borrowing costs.
Global Recession triggered by aggressive rate hikes.
Social Instability as unemployment and inequality rise.
Shift in Global Power – countries that manage inflation better may emerge as new economic leaders, while others fall behind.
Possible Pathways Out
While the nightmare seems relentless, there are strategies to stabilize the situation:
Technology and Productivity Growth: Innovation can reduce costs, offsetting inflationary pressures.
Energy Transition: Moving toward renewable energy reduces vulnerability to oil and gas shocks.
Global Cooperation: Trade agreements and supply chain resilience can bring stability.
Credible Monetary Policy: Central banks must maintain independence and act decisively to anchor expectations.
Targeted Fiscal Support: Protecting vulnerable households while maintaining overall fiscal discipline.
Conclusion
Inflation is more than rising prices—it is an erosion of stability, trust, and prosperity. When it becomes entrenched, it threatens not just economies but the very fabric of societies. Today’s inflationary pressures are unique in their complexity, fueled by supply shocks, geopolitical tensions, and structural economic changes. The nightmare continues because solutions are neither simple nor immediate.
Yet, history also shows that inflationary crises can be overcome with credible policies, innovation, and resilience. The real challenge lies in balancing short-term sacrifices with long-term stability. If policymakers and societies fail to rise to this challenge, the inflation nightmare will not just continue—it may define the economic future of an entire generation.
5 Defensive & Growth Sectors Perfect for Dip Buying1. Pharmaceuticals & Healthcare
Why It’s Defensive
Healthcare is a necessity, not a luxury. People need medicines, hospitals, and diagnostic services regardless of economic conditions. That’s why pharma and healthcare stocks are considered defensive – they remain resilient even during recessions, global slowdowns, or financial crises.
For example, during the COVID-19 crash of March 2020, while many sectors collapsed, pharma stocks quickly recovered and even surged due to global demand for medicines, vaccines, and hospital services.
Why It’s Growth-Oriented
Rising global healthcare spending: Aging populations in developed countries and increasing middle-class income in emerging markets boost demand.
Innovation in biotech & generics: Indian pharma companies are global leaders in generic drugs and are expanding into biosimilars, CRAMS (Contract Research and Manufacturing Services), and specialty medicines.
Telemedicine & digital health: Healthcare is undergoing digital transformation, creating new growth avenues.
Dip Buying Opportunities
Pharma stocks often face sharp corrections due to regulatory concerns, USFDA observations, or temporary pricing pressures. These dips are usually opportunities because:
Core demand for healthcare doesn’t vanish.
Once regulatory issues are resolved, stocks bounce back strongly.
Defensive nature ensures limited downside risk.
Example: Sun Pharma, Dr. Reddy’s, and Cipla often correct 15–20% due to quarterly margin pressures, but these are great accumulation zones for long-term investors.
Investment Strategy
Focus on large-cap pharma for stability and mid-cap specialty companies for higher growth.
Accumulate in phases during 10–20% marketwide corrections.
Diversify across hospitals, diagnostics, and pharma manufacturing for balanced exposure.
2. FMCG (Fast-Moving Consumer Goods)
Why It’s Defensive
FMCG companies sell essentials – food, beverages, personal care, and household products. Even in recessions, people continue buying soaps, biscuits, and packaged goods. This makes FMCG stocks highly resilient.
Historically, FMCG stocks like Hindustan Unilever (HUL), Nestlé, and Dabur have delivered steady returns regardless of market cycles. Their low volatility and strong brand loyalty make them classic defensive plays.
Why It’s Growth-Oriented
Rural consumption growth: Government spending on infrastructure and rising rural incomes increase demand for everyday goods.
Premiumization: Consumers are upgrading from basic to premium products.
Export opportunities: Many Indian FMCG firms are expanding into Southeast Asia, Africa, and the Middle East.
E-commerce & D2C channels: Online retail is boosting FMCG distribution and margins.
Dip Buying Opportunities
FMCG stocks rarely see sharp falls, but when markets correct heavily, they too trade at attractive valuations. These dips are perfect to accumulate:
High dividend yields add to returns.
Sector is less affected by inflation and currency swings.
Low-beta nature reduces portfolio volatility.
Example: ITC was ignored for years due to regulatory risks in its cigarette business, but patient investors who accumulated during dips saw multi-fold returns once FMCG growth kicked in.
Investment Strategy
Look for market leaders with strong distribution networks.
FMCG works best for long-term compounding, so use SIP-style accumulation.
Mix large brands (HUL, Nestlé) with emerging challengers (Marico, Emami).
3. Information Technology (IT) & Digital Services
Why It’s Defensive
At first glance, IT may not seem defensive, but global outsourcing and digitization trends provide resilience. Indian IT companies like TCS, Infosys, and HCL Tech derive a majority of revenues from recurring service contracts with global clients, ensuring steady cash flows.
Even during global slowdowns, IT spending often shifts from discretionary projects to cost-saving digital initiatives – keeping demand steady.
Why It’s Growth-Oriented
Digital transformation: Cloud computing, AI, data analytics, and cybersecurity are high-growth areas.
Global outsourcing demand: Companies worldwide seek cost efficiency, benefiting Indian IT firms.
New-age verticals: FinTech, healthtech, and e-commerce drive additional IT services demand.
High free cash flow: IT majors regularly return cash to shareholders through buybacks and dividends.
Dip Buying Opportunities
IT is cyclical and often corrects sharply when:
The US or Europe signals a slowdown.
Clients cut IT budgets temporarily.
Currency fluctuations impact quarterly results.
But these dips are ideal for accumulation because long-term demand for digitization is irreversible.
Example: During 2022, IT stocks corrected 30–40% due to global slowdown fears. Investors who accumulated Infosys and TCS during the correction are sitting on solid gains as digital spending picked up again.
Investment Strategy
Large-caps for stability (TCS, Infosys).
Mid-cap IT for higher growth (LTIMindtree, Persistent Systems).
Accumulate during 20–30% corrections in IT index.
Avoid chasing small-cap IT unless fundamentals are strong.
4. Banking & Financial Services
Why It’s Defensive
Banking is the backbone of any economy. Regardless of cycles, credit, deposits, and payments continue. In India, the financialization of savings and increasing credit penetration make banking a structural growth story.
Defensive elements include:
Strong regulatory framework by RBI.
Essential role in supporting all other industries.
Diversification across retail, corporate, and digital lending.
Why It’s Growth-Oriented
Credit expansion: India’s credit-to-GDP ratio is still low compared to global averages, leaving massive room for growth.
Digital finance: UPI, fintech partnerships, and mobile banking expand customer reach.
Insurance & asset management: BFSI sector is diversifying into wealth management and insurance.
Consolidation: Strong banks gain market share when weaker NBFCs or PSU banks face stress.
Dip Buying Opportunities
Banking stocks are volatile due to:
Rising interest rate cycles.
NPA concerns.
Global macroeconomic risks.
But dips often reverse quickly because banking demand is long-term.
Example: In 2020, HDFC Bank corrected sharply due to lockdown fears, but within a year, it made new highs as loan growth revived. Similarly, SBI’s turnaround post-2018 NPA cycle rewarded patient investors.
Investment Strategy
Private banks (HDFC Bank, ICICI Bank) for stability.
Select PSU banks (SBI, Bank of Baroda) during dip cycles.
NBFCs like Bajaj Finance for higher growth.
Accumulate gradually since BFSI can be volatile.
5. Energy & Power (with Renewable Focus)
Why It’s Defensive
Energy is a basic necessity. Industries, households, and transportation all rely on it. Demand for electricity, fuel, and energy infrastructure rarely collapses, making this sector defensive.
Why It’s Growth-Oriented
Renewable revolution: Solar, wind, and green hydrogen are the future, creating massive growth opportunities.
Government push: India targets net-zero emissions by 2070, meaning long-term policy support.
Rising demand: India’s power consumption grows consistently with urbanization and industrialization.
Energy diversification: Companies are shifting from traditional coal-based power to renewables, ensuring sustainability.
Dip Buying Opportunities
Energy and power stocks often correct due to:
Regulatory tariff changes.
Fuel cost fluctuations.
Global crude oil price swings.
But long-term demand remains intact, making dips valuable entry points.
Example: NTPC and Tata Power corrected during coal price hikes but bounced back as renewable capacity additions boosted valuations.
Investment Strategy
Balance between traditional leaders (NTPC, Power Grid) and renewable-focused players (Adani Green, Tata Power).
Accumulate during dips linked to global crude swings.
Long-term horizon needed, as renewable projects take time to scale.
How to Approach Dip Buying in These Sectors
Phased Buying: Don’t invest all at once. Break your investment into tranches and buy during market-wide or sector-specific corrections.
Valuation Discipline: Even defensive sectors can be overvalued. Wait for P/E multiples to come back to reasonable levels.
Diversification: Spread investments across all five sectors to balance risk and growth.
Use ETFs/Mutual Funds: If stock-picking is tough, sectoral ETFs or actively managed funds provide easier access.
Stay Patient: Dip buying works when you hold through recovery cycles. Avoid panic selling.
Conclusion
Market dips are uncomfortable but essential for building wealth. Instead of fearing corrections, smart investors use them to accumulate quality sectors. The five sectors we discussed – Pharma & Healthcare, FMCG, IT & Digital Services, Banking & Financials, and Energy with Renewables – combine the best of both worlds: resilience during downturns and strong growth potential during expansions.
By adopting a disciplined dip-buying approach, investors can build a portfolio that not only weathers volatility but also compounds steadily over time. Remember, corrections are temporary, but the growth stories of these defensive sectors are structural and long-term.
If you position yourself well, every market dip can become your wealth-building opportunity.

Trading Errors That Separate Winners from Losers1. Lack of a Trading Plan
One of the most glaring differences between winning and losing traders is the presence—or absence—of a clear trading plan.
Winners: Enter the market with a plan that covers entry criteria, exit points, risk tolerance, and position sizing. They know exactly why they are entering a trade and under what conditions they will exit, win or lose.
Losers: Trade impulsively, often chasing tips, reacting to news, or “winging it” based on emotions. Without predefined rules, they rely on hope and gut feelings, which are inconsistent and unreliable.
Think of it like driving without a destination or map—you may move, but you’re likely to get lost. Trading without a plan is essentially gambling.
2. Ignoring Risk Management
Risk management is often called the “holy grail” of trading. It is not glamorous, but it determines survival.
Winners: Risk only a small portion of their capital on each trade (often 1–2%). They use stop-loss orders, hedge positions, and understand the risk-reward ratio before entering a trade. They think in probabilities and know that protecting capital is more important than chasing quick gains.
Losers: Risk far too much on a single trade, sometimes even their entire account. They move stop-loss levels farther to avoid taking a small loss, only to suffer a devastating one later. A few bad trades can wipe out months or years of effort.
A classic rule says: “Take care of the downside, and the upside will take care of itself.” Winners live by this; losers ignore it.
3. Overtrading
Overtrading is one of the most common traps for beginners.
Winners: Understand that patience pays. They wait for high-probability setups, sometimes taking just a handful of trades in a week or month. They trade less, but smarter.
Losers: Feel the need to be in the market constantly. They confuse activity with productivity, opening positions based on boredom, fear of missing out (FOMO), or the illusion that “more trades = more profit.”
Overtrading not only increases transaction costs but also magnifies exposure to emotional mistakes.
4. Emotional Decision-Making
Markets are emotional arenas, and controlling psychology is as important as technical skill.
Winners: Maintain discipline and detach emotionally from trades. They accept losses as part of the business and move on without revenge-trading.
Losers: Allow fear, greed, hope, or frustration to dictate their moves. A small loss triggers panic. A big win creates overconfidence, leading to reckless bets. They chase losses, double down, or refuse to cut losers, turning manageable mistakes into disasters.
The famous trader Paul Tudor Jones once said: “Losers average losers.” This reflects the emotional trap of holding on to bad trades instead of accepting defeat.
5. Lack of Education and Preparation
Trading looks deceptively simple. Charts, news, and platforms are accessible to anyone. But without a strong foundation, losses are inevitable.
Winners: Invest time in education, study market structure, read books, analyze charts, and even backtest strategies. They treat trading as a profession, not a hobby.
Losers: Jump into markets unprepared, lured by promises of quick riches. They copy strategies without understanding them, rely on social media tips, or trade based on rumors.
In any competitive field—sports, medicine, law—training is essential. Trading is no different. Lack of preparation ensures failure.
6. Failure to Adapt
Markets are dynamic. What works today may not work tomorrow.
Winners: Adapt strategies to evolving conditions. If volatility rises, they adjust position sizing. If market structure changes, they reevaluate systems. They are flexible, constantly learning and evolving.
Losers: Stick rigidly to outdated methods or strategies, even when evidence shows they no longer work. They resist change, hoping markets will return to conditions where their strategy worked.
Adaptability is survival. Dinosaurs didn’t adapt and went extinct. Traders who fail to adapt face the same fate.
7. Neglecting the Importance of Psychology
Many traders focus only on technical indicators or news but ignore the psychology of trading.
Winners: Develop strong mental frameworks—discipline, patience, resilience. They understand cognitive biases like loss aversion, confirmation bias, and recency bias, and work to minimize their impact.
Losers: Are controlled by psychological traps. They believe they’re always right, seek only confirming evidence, and fear taking losses. This mindset sabotages even good strategies.
Trading is 80% psychology and 20% technique. Those who underestimate this imbalance often lose.
8. Unrealistic Expectations
Another error that separates losers from winners is expectation management.
Winners: Aim for consistent returns, not overnight riches. They understand compounding and set achievable goals. For them, trading is a marathon, not a sprint.
Losers: Expect to double their money every week, quit jobs overnight, or become millionaires in months. Such expectations lead to overleveraging, impulsive trades, and eventual ruin.
The harsh truth: trading is not a get-rich-quick scheme. Those who see it that way rarely last.
9. Ignoring Journal Keeping and Review
One of the simplest but most powerful tools in trading is a trading journal.
Winners: Keep detailed records of trades, including entry/exit, reasoning, emotions, and outcomes. They review mistakes, identify patterns, and refine strategies.
Losers: Don’t track trades. They forget mistakes, repeat them, and fail to see patterns of error.
Reviewing a journal is like a coach analyzing a game replay—it highlights strengths and weaknesses that cannot be seen in the heat of the moment.
10. Misuse of Leverage
Leverage magnifies both gains and losses.
Winners: Use leverage cautiously, only when setups are highly favorable. They ensure their accounts can handle drawdowns without panic.
Losers: Abuse leverage, turning small moves against them into catastrophic losses. They view leverage as a shortcut to quick profits, forgetting it’s a double-edged sword.
Many traders don’t fail because they are wrong, but because they are overleveraged when wrong.
11. Blindly Following Others
In today’s world, tips, social media, and chat groups flood traders with “advice.”
Winners: May listen to others but always do their own research before acting. They know that ultimately, their money is their responsibility.
Losers: Follow every tip or influencer without analysis. They jump on hype-driven moves, often buying at tops and selling at bottoms.
The herd mentality is strong in markets, but as Warren Buffett says: “Be fearful when others are greedy, and greedy when others are fearful.”
12. Lack of Patience and Discipline
Trading rewards patience and punishes impatience.
Winners: Can wait days or weeks for a setup that matches their rules. They avoid shortcuts and stick to discipline.
Losers: Want instant results. They break rules, enter trades prematurely, and exit too early out of fear.
Impatience turns strategy into chaos. Discipline turns chaos into consistency.
Conclusion: Turning Errors into Edges
The line between winning and losing traders isn’t about intelligence, luck, or even access to capital. It’s about behavior, discipline, and error management. Winners aren’t error-free—they simply make fewer critical mistakes and learn from every one. Losers repeat the same destructive errors until their capital or confidence runs out.
To move from losing to winning:
Create and follow a trading plan.
Prioritize risk management over profit.
Develop patience, discipline, and emotional control.
Treat trading as a profession—study, practice, and adapt.
Journal and review trades consistently.
The markets will always test you. But by avoiding these errors, you’ll stand among the minority who consistently extract profits rather than donate them.
Part 4 Institutional TradingAdvantages of Option Trading
Leverage: Small premium controls large exposure.
Flexibility: Can profit in any market—up, down, or sideways.
Risk Management: Limited risk for buyers.
Income Generation: Option writing provides steady cash flow.
Risks of Option Trading
Despite advantages, options carry risks:
Time Decay: Options lose value as expiry approaches.
Volatility Risk: Changes in implied volatility can hurt positions.
Liquidity Risk: Some options may not have enough buyers/sellers.
Unlimited Risk for Writers: Option sellers face theoretically unlimited losses.
Options vs Futures
Many confuse options with futures. Key differences:
Futures: Obligation to buy/sell at expiry.
Options: Right, not obligation.
Futures: Unlimited risk both ways.
Options: Buyers’ risk limited to premium.

Part 4 Trading Master ClassParticipants in Option Markets
There are four key participants in option trading:
Buyers of Calls – Bullish traders.
Sellers of Calls (Writers) – Bearish or neutral traders, earning premium.
Buyers of Puts – Bearish traders.
Sellers of Puts (Writers) – Bullish or neutral traders, earning premium.
Each of these participants plays a role in keeping the options market liquid.
Option Pricing: The Greeks
Option pricing is not random—it is influenced by multiple factors, commonly represented by the Greeks:
Delta: Measures how much the option price changes when the underlying asset moves ₹1.
Gamma: Measures how much Delta itself changes when the underlying moves.
Theta: Measures time decay—how much the option loses value daily as expiration approaches.
Vega: Measures sensitivity to volatility changes.
Rho: Sensitivity to interest rate changes.
For traders, Theta and Vega are the most crucial, since time decay and volatility play massive roles in profits and losses.

Part 2 Trading Master ClassKey Terms in Option Trading
Before diving deeper, let’s understand the language of option traders.
Premium: The price paid to buy an option.
Strike Price: The price at which the option holder can buy (call) or sell (put) the asset.
Expiration Date: The last date on which the option can be exercised.
In-the-Money (ITM): When exercising the option would be profitable.
Out-of-the-Money (OTM): When exercising the option would not be profitable.
At-the-Money (ATM): When the underlying price equals the strike price.
Intrinsic Value: The amount of profit if the option were exercised immediately.
Time Value: The portion of the option premium that reflects the time left until expiration.
Example: If a stock is trading at ₹100 and you buy a call option with a strike price of ₹90 for ₹15 premium, the intrinsic value is ₹10 (100 – 90), and the remaining ₹5 is time value.
How Option Trading Works
Let’s look at a simple example:
Stock XYZ is trading at ₹200.
You buy a call option with a strike price of ₹210 for ₹5 premium.
The option expires in one month.
Scenario 1: Stock rises to ₹230
Intrinsic Value = ₹20 (230 – 210).
Profit = ₹20 – ₹5 (premium) = ₹15 per share.
Scenario 2: Stock stays at ₹200
Intrinsic Value = 0.
Loss = ₹5 (premium paid).
This shows the beauty of options: limited risk (premium paid) but unlimited upside in case of calls.

Part 1 Trading Master ClassIntroduction
In the world of financial markets, traders and investors have many instruments to express their views, manage risks, or speculate on price movements. One of the most fascinating and versatile instruments is the option contract. Options trading, when understood deeply, opens the door to countless strategies—ranging from conservative income generation to high-risk speculative plays with massive upside.
Unlike traditional stock trading, which is relatively straightforward (buy low, sell high), option trading introduces multiple layers of complexity: time decay, volatility, strike prices, premiums, and Greeks. Because of this, beginners often feel intimidated, while experienced traders consider options an art form—something that requires both science and psychology.
This guide will take you step by step into the world of option trading, covering what options are, how they work, key terminology, strategies, risks, advantages, and real-life use cases. By the end, you’ll have a full 360-degree view of this powerful trading instrument.
What Are Options?
An option is a type of financial derivative contract. Its value is derived from an underlying asset such as a stock, index, currency, or commodity.
An option gives the buyer the right, but not the obligation, to buy or sell the underlying asset at a predetermined price (called the strike price) before or on a specified date (called the expiration date).
There are two basic types of options:
Call Option – Gives the buyer the right to buy the underlying asset at the strike price.
Put Option – Gives the buyer the right to sell the underlying asset at the strike price.
So, if you think the price of a stock will rise, you might buy a call option. If you think it will fall, you might buy a put option.

Ascending Triangle Pattern in Technical Analysis The Ascending Triangle is a bullish continuation pattern. It forms when the price creates higher lows (🔼) while facing consistent resistance at the same horizontal level (🔴).
🧐 How to Identify It
Flat Resistance Line 🔴
Price hits the same level multiple times and gets rejected.
This creates a horizontal line on top.
Rising Support Trendline 🔼
Each dip forms a higher low, indicating buying pressure.
Connect the swing lows with a rising trendline 📈.
📊 How to Trade It
Entry : Breakout Entry: Enter when price breaks and closes above the resistance line with high volume 💥.Conservative traders wait for a retest of the breakout zone (resistance becomes support).
Target : Measure the height of the triangle and project it upward from the breakout point.
Example: If triangle height = $0.30, add $0.30 above breakout.
Stop Loss : Below the last higher low 🔽 Or slightly below the triangle support trendline 📉
BINANCE:SUIUSDT.P