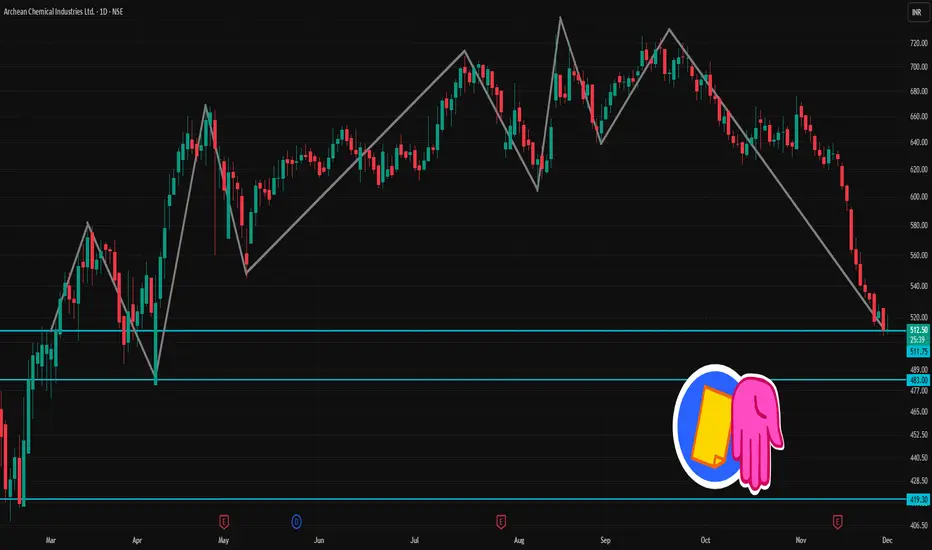
ACI 1 Day Time Frame 📊 Latest snapshot
Recent price ~ ₹ 512 – ₹ 513
52-week range: ~ ₹ 408 (low) to ~ ₹ 730 (high)
Recent technical-analysis summary: Mixed/Neutral to bearish — some moving averages give bullish bias but oscillators appear weak.
⚠️ Technical Signals (Short-Term)
According to one technical summary, short-term trend is marked as “sell”.
Oscillators (e.g. RSI/Stochastic) recently suggest weak or bearish momentum.
✅ What to Watch / Trading Cautions
Momentum is weak; oscillators don’t suggest a strong bullish bounce yet.
If price drops below support (~₹ 508), downside risk increases; need close stop-loss discipline.
Volume & broader market/sector conditions could swing price sharply — stay alert for volatility.
On a bounce, watch if resistance zones get challenged — a breakout may change short-term trend.
Chartpatternstrading
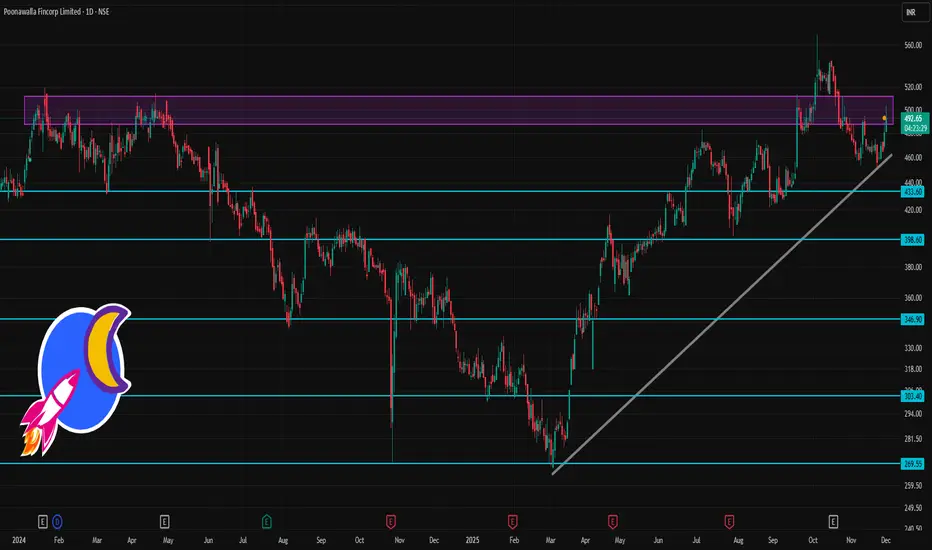
POONAWALLA 1 Day Time Frame 📌 Latest price & context
On one of the latest snapshots, the share price was ~ ₹ 492.65 (as per a public chart)
The stock remains among relatively volatile mid-cap / NBFC counters, with a fairly high beta (i.e. sensitivity to market swings).
✅ Technical Momentum & Risk Profile
Technical sources currently signal a “bullish / buy-leaning” bias based on moving averages (from short-term to long-term) for Poonawalla.
But high volatility & elevated beta mean risk — sharp swings are possible in either direction depending on market sentiment, NBFC-sector news, and macro cues.
⚠️ What to watch out for
The pivot-based levels assume relatively normal volatility — big sector-wide moves, news, or NBFC-specific developments can render them less reliable.
As an NBFC / mid-cap, the stock remains sensitive to interest-rate outlook, credit-sector sentiment, and macroeconomic conditions — not just its own chart.
The “buy bias” from moving averages doesn’t guarantee a smooth upward path — you should watch volume, daily chart pattern, and broader market context.
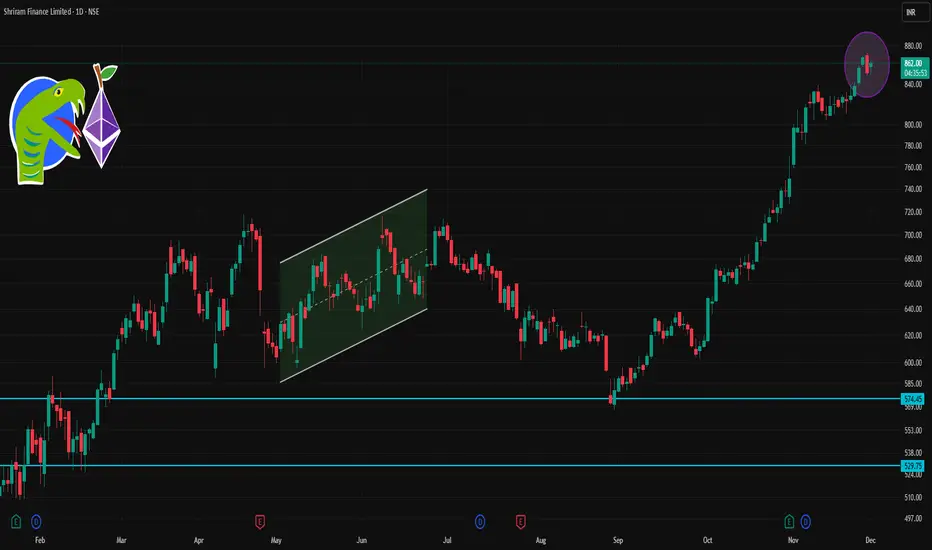
SHRIRAMFIN 1 Day Time Frame 📊 Current Snapshot
Latest live price: ~ ₹852–857 (depending on trade moment).
Today’s high / low range: ~ ₹861.95 high / ~ ₹850.40 low.
52-week range: ₹493.35 (low) ↔ ₹872.00 (high).
✅ What This Means for Intraday / Next Sessions
If price stays above ~₹857–858 (pivot) — bias remains bullish → could target ₹866 → ₹880–881.
If price dips but finds support near ₹842–843, watch for bounce (possible buying opportunity).
A break below ₹834 → ₹820 downward zone might signal risk of further downside — monitor overall market and sector trend.
Use stop-loss (if trading) near support zones to manage risk, given volatility and sensitivity to overall market moves.
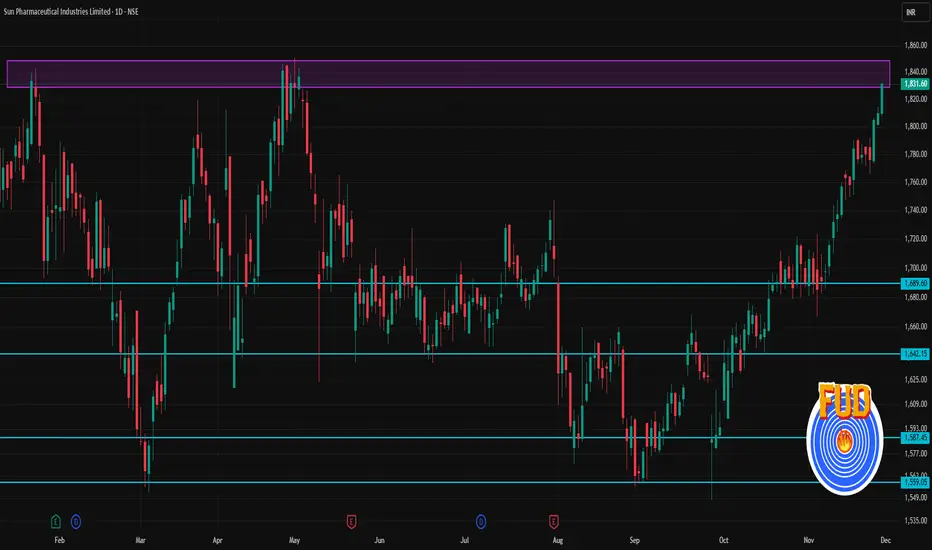
SUNPHARMA 1 Day Time Frame 📈 Key numbers & technical indicators
Last close: ~₹ 1,831.60
Pivot point: ~₹ 1,824.03
Immediate resistance (R1‑R3): ~₹ 1,840.6 → ₹ 1,849.5 → ₹ 1,866.1
Immediate support (S1‑S3): ~₹ 1,815.1 → ₹ 1,798.5 → ₹ 1,789.6
Moving averages: 20‑day ~₹ 1,758.6, 50‑day ~₹ 1,711.7, 100‑day ~₹ 1,690.8, 200‑day ~₹ 1,686.6 — stock is comfortably above all, indicating overall bullishness.
✅ What this suggests now (1‑day / short‑term view)
As long as price stays above pivot (~₹ 1,824), the near‑term bias remains mildly bullish.
If price breaks and sustains above first resistance levels (~₹ 1,840–1,850), next resistance zone near ~₹ 1,865 may come into play.
On downside, if price slips below support zone (~₹ 1,815–₹ 1,798), watch for further weakness toward ~₹ 1,789–₹ 1,775.
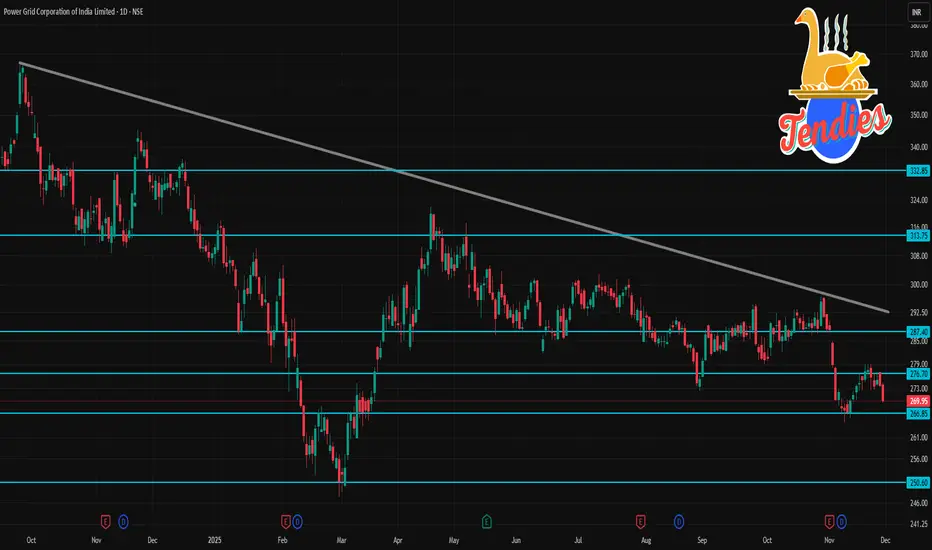
POWERGRID 1 Day Time Frame 📊 POWERGRID — Current snapshot (daily timeframe)
As of last close, POWERGRID was trading around ₹ 269.95.
The 52-week trading range is roughly ₹ 247.30 (low) to ₹ 336.25 (high).
Over the past week, the share price is down about 2.76%, and over the last 6 months, down about 7.3%.
📈 Technical Indicators (Daily Chart)
According to a technical-analysis summary, moving averages and oscillators on daily timeframe show a “Strong Sell” signal for POWERGRID.
The 14-day RSI is near 31, which is close to oversold territory — indicating potential weakness or risk of a further drop.
Some charting platforms show mixed signals (some “sell”, some “neutral”), but overall bias remains bearish to weak, not bullish.
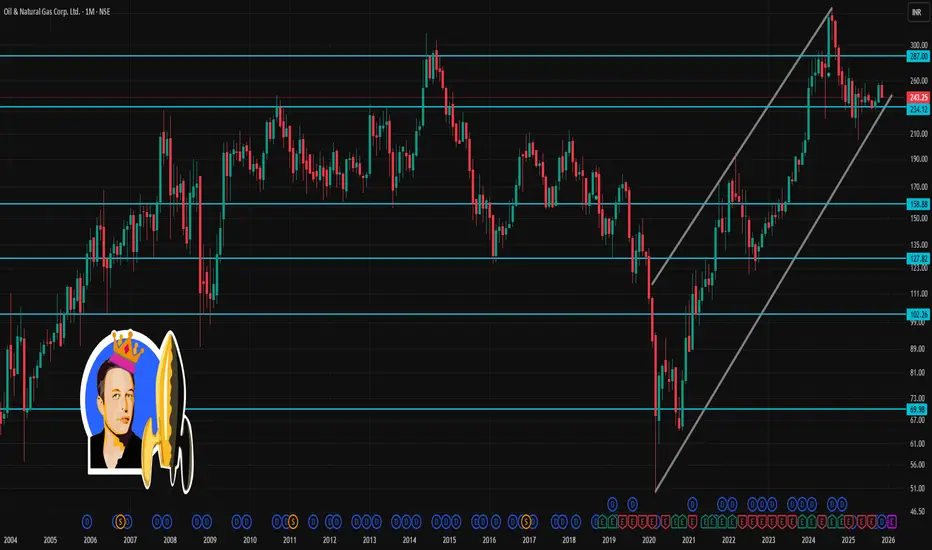
ONGC 1 Month Time Frame 📌 Current snapshot
ONGC last traded around ₹243–₹244.
Over the past month, the stock has dropped ~3–4%.
📈 What could happen in next month
Bearish scenario: If price slips below ₹241 and sentiment (oil prices, global energy demand, investor flows) remains weak — ONGC could test the lower support zone around ₹238–₹240.
Neutral / range-bound: The stock could hover between ₹241–₹251, especially if crude/oil-sector news remains mixed, or broader market is choppy.
Bullish scenario: If ONGC closes above ~₹251 with supportive macro (oil prices, global demand, corporate news) — next leg could push it towards ₹255–₹257 (near-term target).
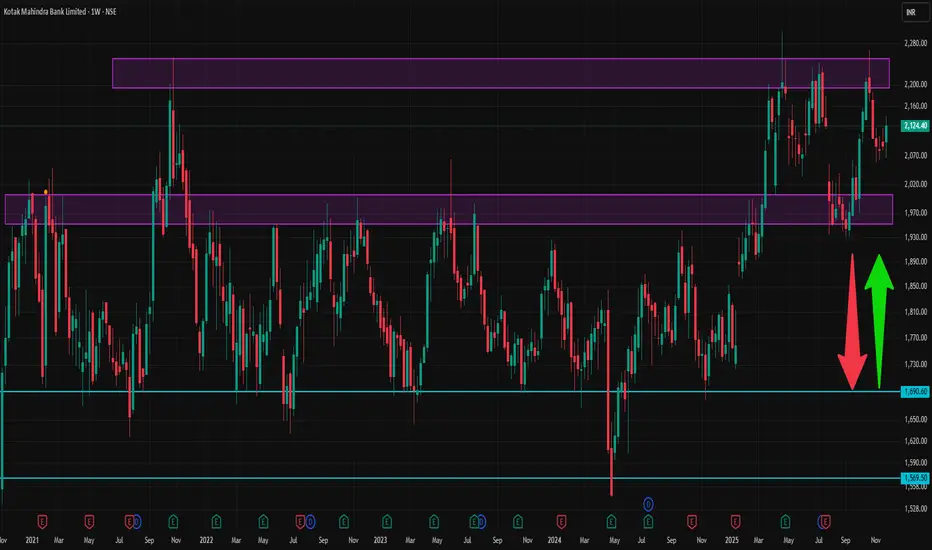
KOTAKBANK 1 Week Time Frame ✅ Current snapshot
Latest share price ≈ ₹ 2,124.40 on NSE/BSE
52-week high ~ ₹ 2,301.90, 52-week low ~ ₹ 1,723.75.
Key fundamentals: P/E ~ 22–23, Book Value ~ ₹ 844, PB ~ 2.5–2.7, dividend yield modest.
⚠️ What could upset the short-term view
Broader market weakness (macro-economic, interest-rate moves, global cues) could drag down banking stocks including Kotak.
Negative corporate/asset-quality news or sector-specific headwinds could hamper even good fundamentals.
Volatility: as with any financial-sector stock, sentiment can swing quickly based on news flow (regulatory announcements, RBI policies, etc.).
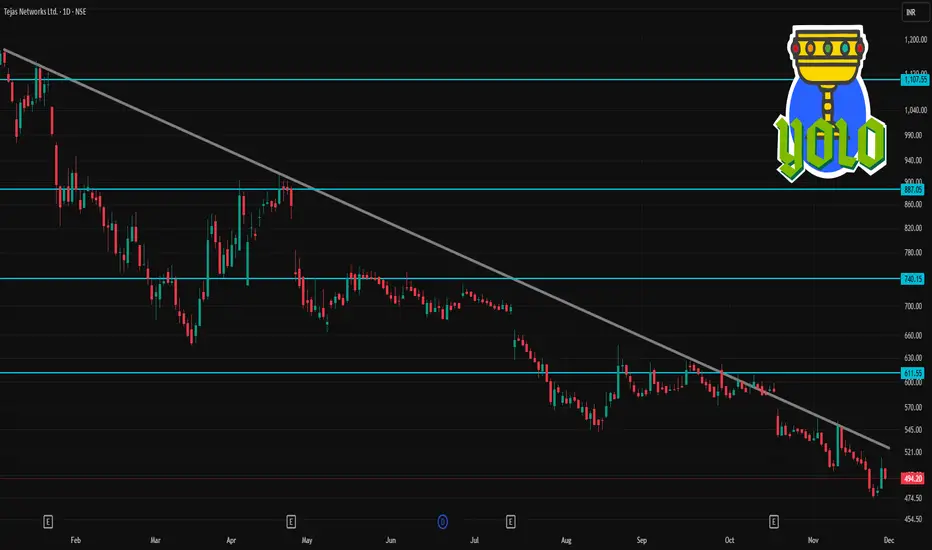
TEJASNET 1 Day Time Frame 📌 Current Price & Context
Recent data shows TEJASNET trading around ₹494–₹496.
52-week range: Low ~ ₹474.45, High ~ ₹1,402.70.
On 1-day/short-term technicals: the consensus remains “Sell / Strong Sell”.
So — the stock is near its lower end of the 52-week range, but short-term momentum is weak.
✅ What This Means for Traders (1-Day / Intraday)
As of now, bias on 1-day timeframe remains bearish / neutral. Unless there is a strong positive catalyst, further downside or consolidation is more likely than a sustained bounce.
The zone around ₹484–₹486 (and possibly down to ₹471–₹475) is critical support — a breakdown below could open a bigger downside swing.
On the upside, watch ₹511–₹512 and then ₹520–₹525 for any meaningful resistance breaks — only a close above these may suggest short-term relief.
Because moving averages are well above current price, any upside rally may remain limited unless volume and market-wide sentiment improve.
NUVAMA 1 Day Time Frame 📈 Current Price & Setup
NUVAMA is trading around ₹7,480–7,550 lately.
Over the past 52 weeks the stock’s range is roughly ₹4,735 (low) to ₹8,508 (high).
🔎 Technical Outlook (1‑day timeframe)
On daily chart indicators (moving averages + oscillators), many third‑party sources mark NUVAMA as a “Strong Buy” today.
Short‑term technical bias appears bullish, with recent momentum favouring upside over downside.
⚠️ Important Considerations & Fundamentals
The company’s valuations appear relatively rich: the price‑to‑book (P/B) ratio is elevated.
Promoter pledge status is non‑trivial — as per recent data, a significant portion of promoter holding is pledged.
As always: on a 1‑day timeframe the stock can be volatile — technical signals are strong, but broader market conditions (macro, sector sentiment, news, flows) will matter a lot.

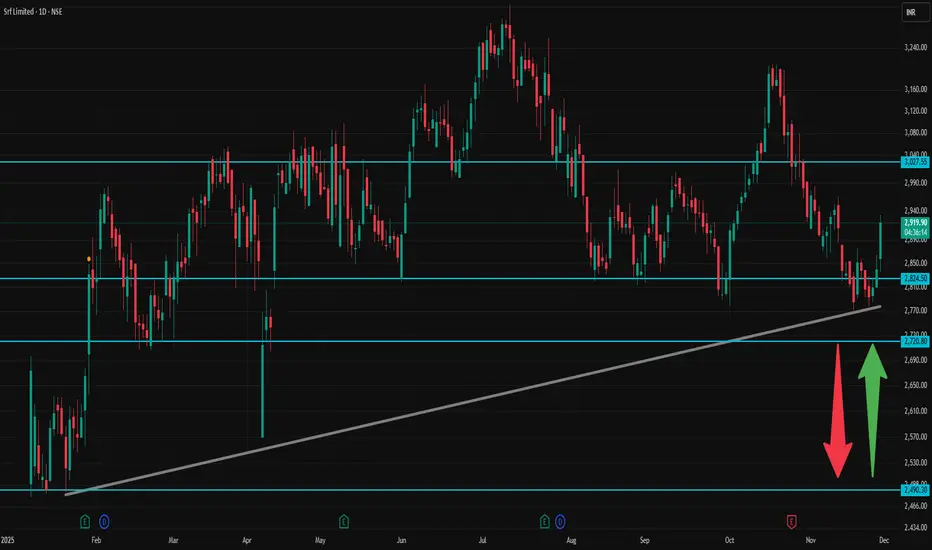
SRF 1 Day Time Frame ✅ Current context
According to public price data, SRF’s recent high for the day is ~ ₹ 2,933, low ~ ₹ 2,836.80.
As per a technical‑analysis summary: moving averages (short-to-medium term) and oscillators on daily timeframe show a bullish bias (Strong Buy on many signals).
🎯 How to interpret / trade with these levels
As long as price stays above Pivot (~₹ 2,866), bias remains mildly bullish — look for R1 → R2 → R3 as possible targets.
If momentum is strong (volume + positive broader market), a break above R2 (~₹ 2,920) could push toward R3 (~₹ 2,933–2,937+).
On downside, supports at ₹ 2,811.93 → ₹ 2,783.87 → ₹ 2,757.73 are key — loss of S1 may open S2/S3.
For conservative traders: good entry or add-on zones could be near S1 or pivot, with stop‑loss a little below S2/S3 depending on risk tolerance.
⚠️ Important caveats
These are static pivot-based levels, and real market moves may overshoot or not respect them depending on news, volume, macro‑market sentiment.
Given volatility (as seen in day’s high-low range), levels above R2 or below S2 can get tested — intraday discipline (stop-loss, position sizing) is crucial.
Always watch volume, overall index trend (Nifty/Sensex), sector news — technical levels work better when confirmed by context.
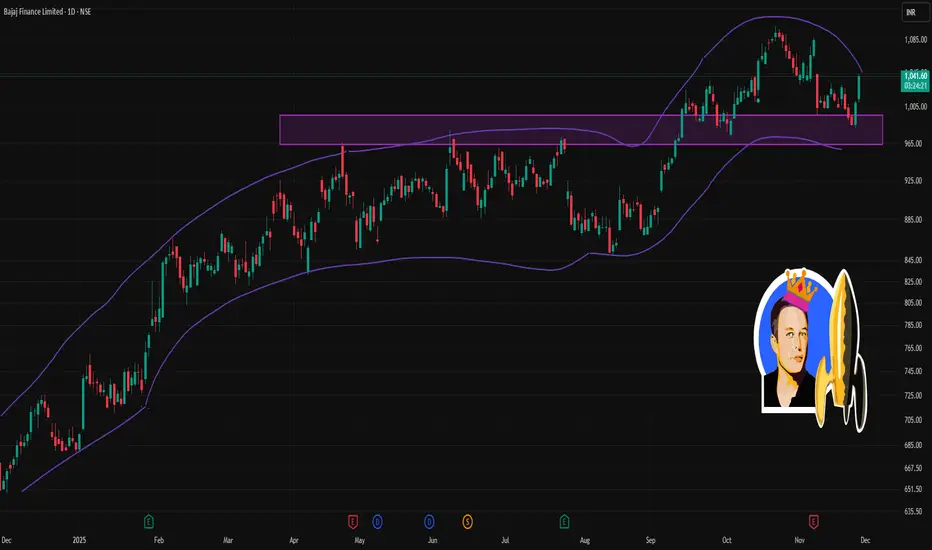
BAJFINANCE 1 Day Time Frame ✅ What we know now (as of latest available data)
1. The latest publicly quoted price for Bajaj Finance is ~ ₹1,042 – ₹1,044.
2. According to a recent report, the stock touched an intraday high of ₹1,042.20.
3. The stock is above its short‑ and long‑term moving averages, which suggests current bullish momentum.
⚠️ Important Notes / Context
These are technical levels derived using standard pivot‑point / support‑resistance calculation methods. They are not guaranteed — markets may overshoot or violently gap.
Always consider fundamentals (company news, sector, broader market sentiment) along with technicals before acting.
Use stop‑loss / risk management because intraday volatility can cause swings beyond these levels.
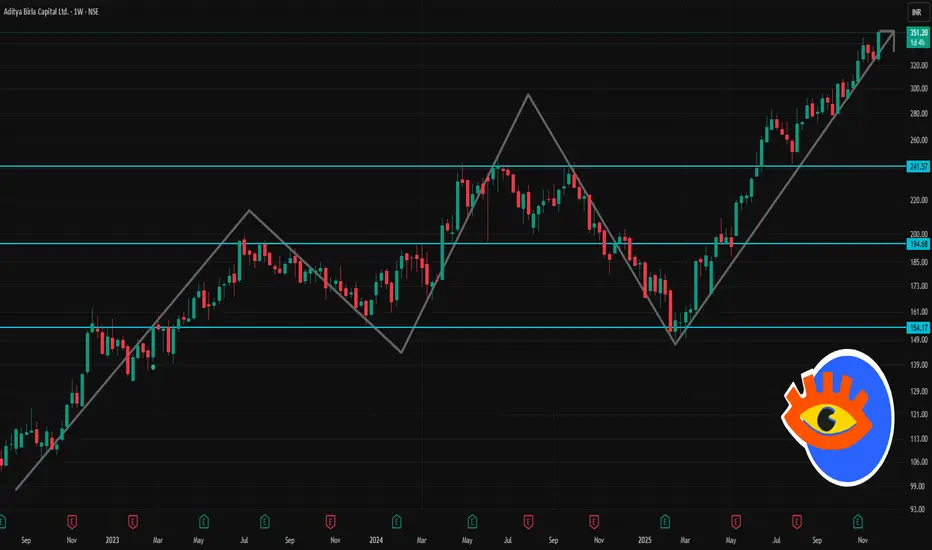
ABCAPITAL 1 Week Time Frame 📊 Key recent data & context
1. The stock recently closed around ₹349.80.
2. Over the past week it has delivered a positive return (roughly +6–7 %).
3. According to a recent technical outlook, immediate support is seen at ≈ ₹320.87, and major support at ≈ ₹316.08. On the upside, immediate resistance is around ≈ ₹333.77, with major resistance at ≈ ₹341.88.
✅ What to Watch — Possible Scenarios
Bullish scenario: If price stays above ~₹333.8 and market sentiment holds up, stock could attempt a move toward ~₹341–342.
Sideways / consolidation: Price may oscillate between ~₹320–₹335 if broader market remains neutral — could be a choppy week.
Bearish scenario: A decisive break below ~₹320.9 (with volume) could drag price toward ~₹316 or lower — a risk point for short‑term holders.
⚠️ Other Technical Notes & Volatility
The stock shows fairly significant volatility: 5‑week range typically ~5.85% for ABCAPITAL.
Broader trend appears positive: moving averages and momentum indicators have been showing strength lately.
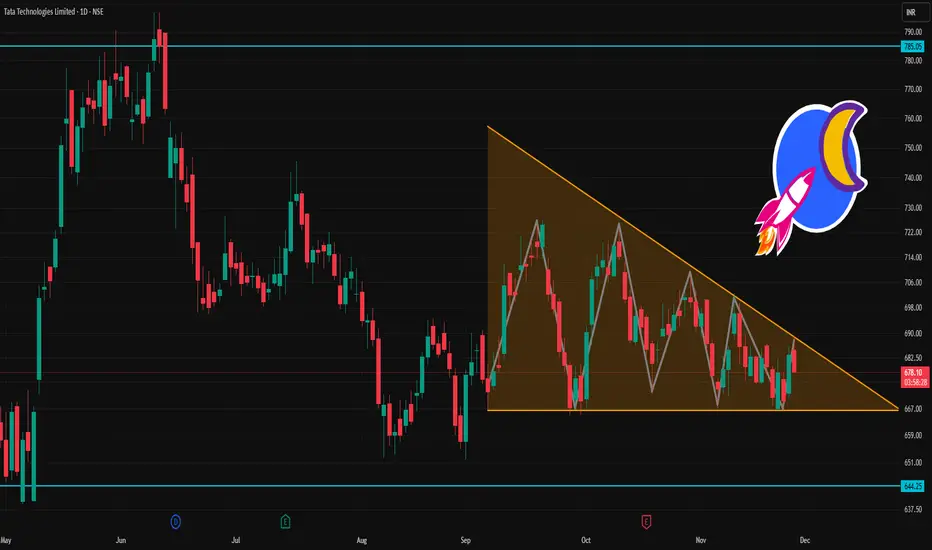
TATATECH 1 Day Time Frame 📌 Key recent data (approx as of last close):
Last traded price: ~ ₹676.75.
Day high / low: ~ ₹679 / ₹670.25.
52‑week high: ~ ₹973.85; 52‑week low: ~ ₹597.
🧮 What this suggests for today (intraday / short‑term only):
If Tata Tech trades above ₹672.7, it could aim for ₹677–684 as short‑term resistance.
A fall below ₹672.7 might push price toward ₹665–661 as support.
₹684–696 could act as a more extended intraday upside zone, if there’s bullish momentum.
🔎 Context & What to Watch Out For
The 52‑week high is still much higher — so in a broader sense, the stock remains far off prior highs.
On short‑term charts, some indicators (e.g. moving‑average crossovers / candle‑pattern heuristics) recently gave bearish / neutral signals.
Volatility and broader market sentiment (especially in the auto / engineering‑services / global tech outsourcing space) can swing prices significantly — so these levels are very approximate.
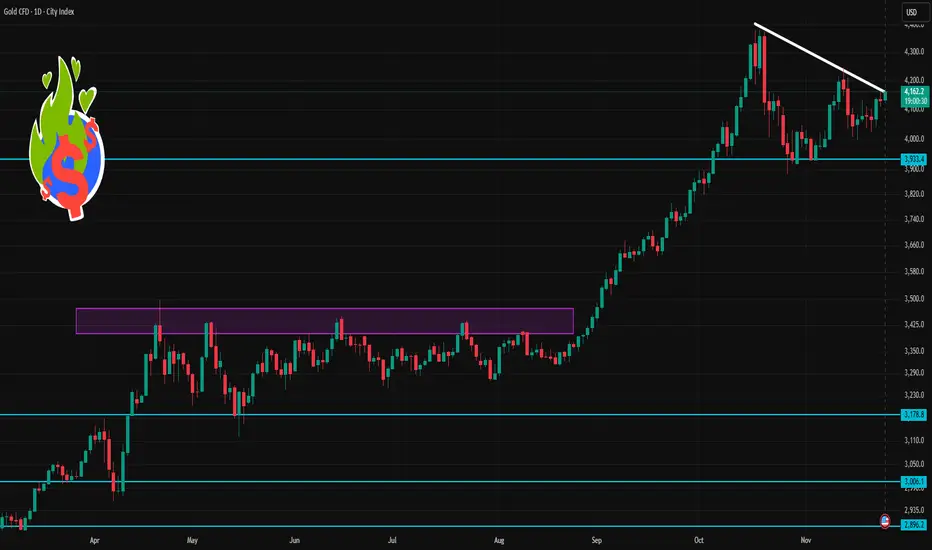
Gold 1 Day Time Frame 🔎 Current Context
1. Gold currently trades around US $4,160–4,165/oz.
2. Many technical-analysis services show daily momentum as bullish: moving averages, RSI/MACD and other indicators point toward a positive bias.
3. But macro factors (strong USD, Fed policy, global risk sentiment) remain important and may cause sharp swings.
⚠️ What to Watch Out For
Volatility: Gold remains sensitive to macro events — USD strength, rate expectations, major economic data — so price can easily break support/resistance zones.
False Breakouts: Even if price crosses a level, it may revert quickly. Combine with other indicators (volume, price action, confirmations) before acting.
Trend Shifts: A major change in global risk sentiment or central-bank moves can rapidly change trend direction, invalidating technical levels.
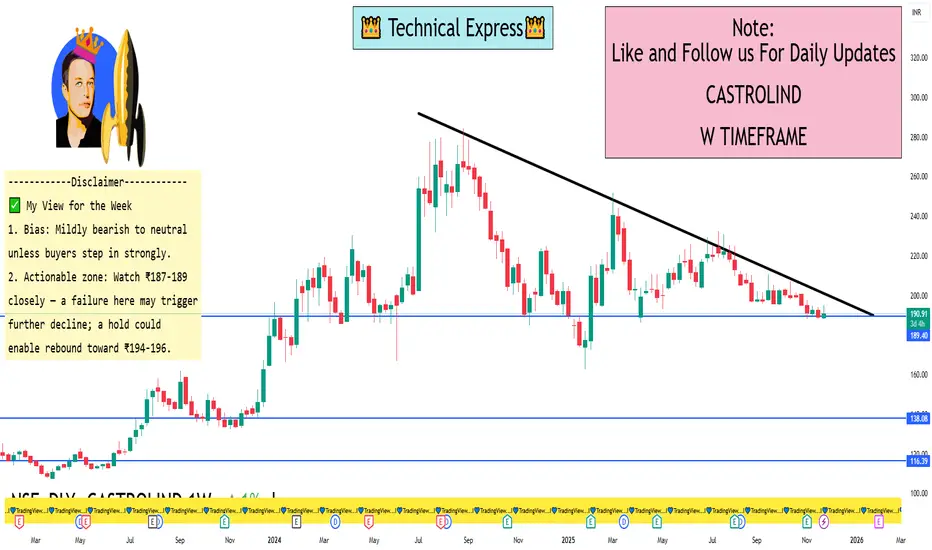
CASTROLIND 1 Week View 🔍 Key Levels
Based on recent technical data:
Support zone: ~ ₹187 – ₹189 (ET Money shows S3 ≈ ₹185.42, S2 ≈ ₹186.71)
Pivot / near-term equilibrium: ~ ₹190 – ₹191 (Weekly central pivot ~₹190.42)
Upside resistance: ~ ₹194 - ₹196 (Weekly R1 ~₹192.83, R2 ~₹196.64)
📈 Short-Term Bias & Likely Scenarios
The momentum indicators (RSI ~33, CCI negative) show the stock is under downward pressure/weak momentum.
If the price stays above ₹187-189, one could anticipate a bounce up into the ₹194-196 zone this week.
If it breaks below ~₹187-189 decisively, support further down could be ~₹183-185 (based on extension levels)
✅ My View for the Week
Bias: Mildly bearish to neutral unless buyers step in strongly.
Actionable zone: Watch ₹187-189 closely — a failure here may trigger further decline; a hold could enable rebound toward ₹194-196.
If you want a more aggressive trade setup (with stop-loss, reward ratio), I can map that too.
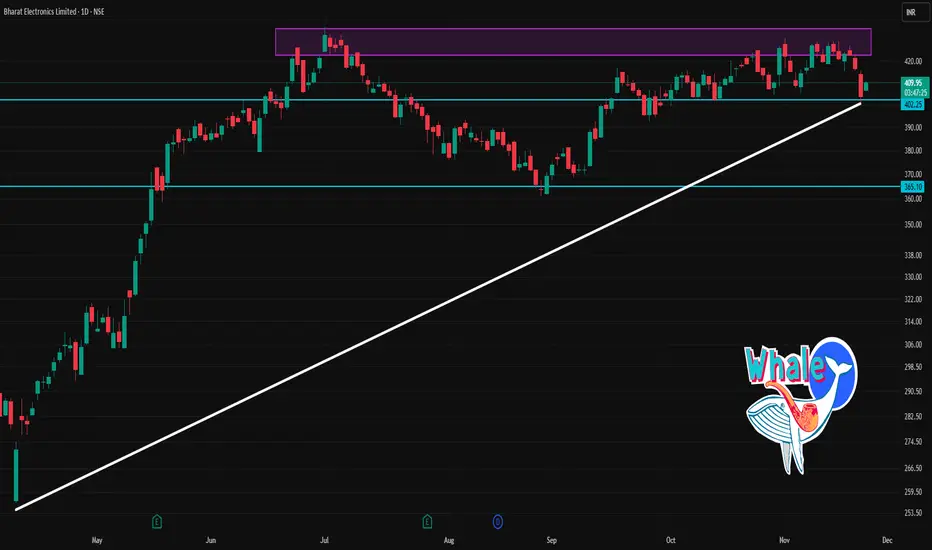
BEL 1 Day Time Frame✅ Current Status
Latest price around ₹407 – ₹410 on the NSE/BSE.
Technical indicators (daily time frame) are leaning bearish/weak: e.g., daily moving averages show more “sell” signals than “buy”.
📌 Key Levels to Watch (Daily Chart)
Based on available pivot/level data and recent price action, here are approximate levels:
Support levels:
S1 ~ ₹407–₹408
S2 ~ ₹405–₹406
A deeper support zone if this breaks might be ₹400-₹404.
Resistance levels:
Pivot ~ ₹413-₹414
R2 ~ ₹416-₹417
R3 ~ ₹419-₹420+
🔍 Short-Term Outlook
Because the stock is hovering just above support (~₹407-₹408), holding above this zone is important to maintain near-term structure.
If price breaks below ~₹405, risk of further weakness increases.
On the upside, a successful breakout above ~₹416-₹417 could open space towards ~₹419-₹420.
The current momentum is weak/negative, so any upside will likely need a catalyst (volume, news) to gain strength.
LICHSGFIN 1 Day Time Frame 📍 Key Current Levels
The stock is trading around ₹ 550 (recent quotes ~₹ 548-550) on the NSE.
Pivot & major levels (from one source) on the daily:
Classic pivot: ~₹ 550.32
Support levels: ≈ ₹ 547.39 (S1), ≈ ₹ 542.02 (S2)
Resistance levels: ≈ ₹ 555.69 (R1), ≈ ₹ 558.62 (R2)
Longer-term moving averages: 50-day MA ≈ ₹ 559.47; 200-day MA ≈ ₹ 570.32 — both above current price, indicating downward pressure.
RSI and oscillator reading: RSI around ~41 (neutral/leaning oversold) per one data point.
🔍 Interpretation & What to Watch
With price below major moving averages (50 & 200 day), the bias remains bearish on the daily chart.
The pivot around ₹ 550 is a key level: holding above may help stabilise; falling below could signal more weakness.
Important support to watch: ~₹ 547 and then ~₹ 542. If these break, risk of further downside.
Key resistance: ~₹ 555-558 zone. A break up through that with volume could offer short-term upside.
The RSI being relatively low (though not deeply oversold) suggests potential for a rebound if positive trigger arises, but trend is not yet positive.
Because the broader trend remains negative, any bounce should be treated cautiously unless backed by strong volume and a clear breakout above that resistance zone.

ENRIN 1 Day Time Frame 🔍 Key Price Info
Last traded ~ ₹3,090 (as of ~10:44 AM IST) on 25 Nov 2025.
Day’s high-low range: ~ ₹3,090 – ₹3,303 (intraday high reported ~₹3,303).
52-week range: ~ ₹2,508.80 – ₹3,625.00.
🎯 Support & Resistance Levels (Short Term)
Support Levels:
~ ₹3,050 – ₹3,070: close to current price, would be first level of support.
~ ₹3,000 – ₹3,030: if the stock breaks below the above, this zone becomes important.
~ ₹2,950 – ₹2,990: deeper support and closer to lower end of recent consolidation.
Resistance Levels:
~ ₹3,250 – ₹3,300: recent high zone around ₹3,303, so getting above this would be bullish.
~ ₹3,350 – ₹3,400: next significant zone before approaching the 52-week high.
~ ₹3,600+: near the 52-week high (₹3,625) and a major resistance barrier.
📉 Intraday Trading View
If the stock holds above ~₹3,050-₹3,070 with strong volume, it could attempt a push toward the resistance zone of ~₹3,250-₹3,300.
If it loses support at ~₹3,050, watch for potential slide toward ~₹3,000 or lower ~₹2,950 zone.
Volume, market sentiment & any corporate news will greatly influence whether it can break resistance or find support.

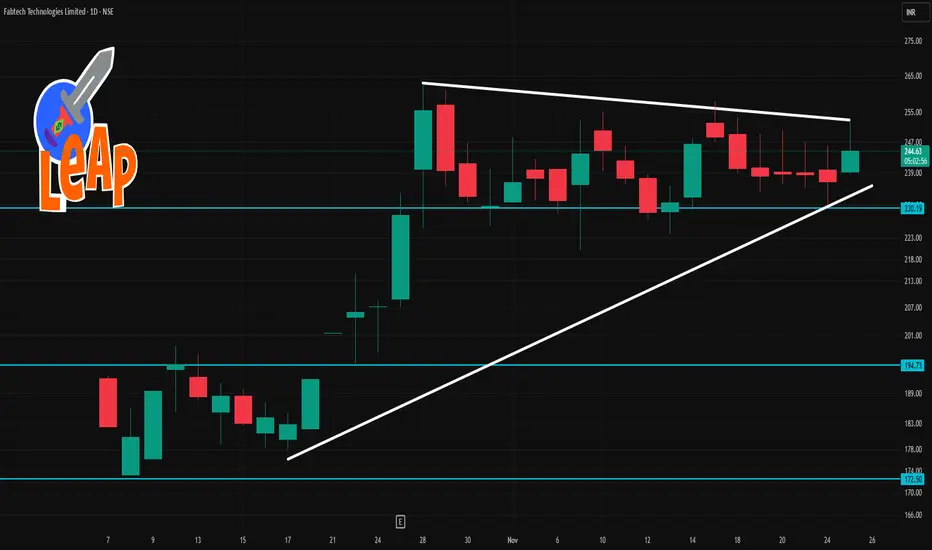
Fabtech 1 Day Time Frame 🔍 Technical Context
Moving averages (20-day, 50-day) are showing price above them, which suggests bullish bias.
Oscillators: RSI ~ 59-60 meaning moderate strength.
A recent source says the daily summary is “Neutral” on investing.com, indicating caution.
1-day pivot levels (classic) from Investing.com:
Pivot ~ ₹ 237.73
Resistance R1 ~ ₹ 240.46, R2 ~ ₹ 244.72, R3 ~ ₹ 247.45
Support S1 ~ ₹ 233.47, S2 ~ ₹ 230.74, S3 ~ ₹ 226.48
📊 Key Levels to Watch Today
Support Zone: ~ ₹ 233-235
If the stock approaches or dips into this area, watch for whether it holds or breaks.
Immediate Pivot / Mid-range: ~ ₹ 237-238
The pivot (~₹237.73) is a critical inflection point. A clear move above might bias upside; a break below may shift focus downward.
Resistance Zone: ~ ₹ 240-245
Upper resistance around ~₹240.46 to ~₹244.72. If momentum picks up and this zone is breached, next upside target ~₹247.45.
Lower Breakdown Level: ~ ₹ 230-227
If support in the ~233-235 zone fails, look toward ~₹230.74 and then ~₹226.48 as next real support.
ULTRACEMCO 1 Week Time Frame ✅ Current picture
1. The stock is trading around ₹11,650-11,700 in the NSE market.
2. Weekly indicators show caution: moving averages (20, 50, 100) are above the current price, signalling short‐term weakness.
3. According to weekly pivot‐levels from Moneycontrol:
Resistance around ₹11,865 – ₹12,115 (Classic)
Support around ₹11,501 – ₹11,365
4. Another source gives near-term support ~ ₹11,684 / ₹11,639 / ₹11,587, pivot ~ ₹11,736, resistance ~ ₹11,781 / ₹11,833.
5. Technically the sentiment is “Sell” on short‐term/higher timeframes: e.g., all major moving averages show “Sell” in investing.com.
6. Weekly MACD and RSI are showing mild bearish or neutral signals.
⚠️ Key caveats
These are purely technical levels for the very short term (≈ 1 week) and assume no major news/shock.
Market, sector (cement) and macro conditions (costs, demand) can sharply change the picture.
Strongest moving averages (100/200) are still significantly higher, signalling a broader weakness in trend.

MARUTI 1 Month Time Frame 📊 Key Metrics
Current price around ₹16,000 region.
One-month return: approximately –2.5% to –3%.
52-week high around ~₹16,660 and low around ~₹10,725.
🔍 Approximate Support & Resistance Levels (1-month timeframe)
From recent charts and technical data:
Immediate resistance: ~ ₹16,172 (R1), then ~ ₹16,368 (R2) and ~ ₹16,585 (R3)
Immediate support: ~ ₹15,759 (S1), then ~ ₹15,542 (S2) and ~ ₹15,346 (S3)
Pivot zone: ~ ₹15,955

BEL 1 Month Time Frame📌 Key Levels & Observations
Current price: approximately ₹ 416.35 per share.
Recent range: Daily highs ~₹ 423–424, lows ~₹ 415.50.
52-week high ~₹ 436 and 52-week low ~₹ 240.25.
🎯 Short-Term (1-Month) Important Levels
Support zone: ~₹ 405-410 — falling below this may weaken short-term structure.
Resistance zone: ~₹ 430-435 — breaking above this could open scope toward ₹ 440.
Near-term target range: If bullish momentum holds, look toward ~₹ 430-440.
Risk zone: If momentum falters and the support zone fails, price may drift back toward ~₹ 400 or lower.
⚠️ Caveats
These levels are technical estimates, not fundamental valuations or guarantees.
Market sentiment, order flows (for BEL), defence‐policy changes, etc. can shift the picture quickly.
Always use stop-loss or risk controls.

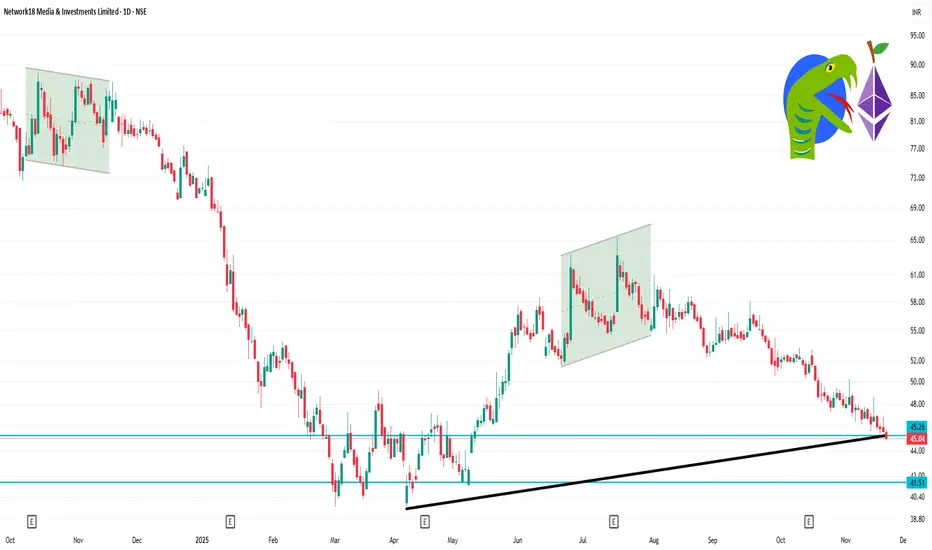
NETWORK18 1 Day Time Frame Current Price: ~ ₹ 45.04.
Day’s Range: ~ ₹ 44.89 (low) to ₹ 45.76 (high)
Key Support Level: Around ₹ 44.50-45.00 — if price breaks below this, further downside may open.
Key Resistance Level: Around ₹ 46.50-47.00 — if price breaks above this with volume, upside potential may resume.
52-week range: Low ~ ₹ 39.66, High ~ ₹ 85.39.