Oracle Financial Services Software Ltd - Long Setup, Move is ON.#OFSS trading above Resistance of 6606
Next Resistance is at 9759
Support is at 4658
Here is previous chart:
Chart is self explanatory. Levels of breakout, possible up-moves (where stock may find resistances) and support (close below which, setup will be invalidated) are clearly defined.
Disclaimer: This is for demonstration and educational purpose only. This is not buying or selling recommendations. I am not SEBI registered. Please consult your financial advisor before taking any trade.
Chartpatterntrading

Breakout in Bombay Burmah Trading Corporation Limited...Chart is self explanatory. Levels of breakout, possible up-moves (where stock may find resistances) and support (close below which, setup will be invalidated) are clearly defined.
Disclaimer: This is for demonstration and educational purpose only. This is not buying or selling recommendations. I am not SEBI registered. Please consult your financial advisor before taking any trade.

Pnb Gilts Limited - Long Setup, Move is ON...#PNBGILTS trading above Resistance of 103
Next Resistance is at 136
Support is at 84
Here is previous chart:
Chart is self explanatory. Levels of breakout, possible up-moves (where stock may find resistances) and support (close below which, setup will be invalidated) are clearly defined.
Disclaimer: This is for demonstration and educational purpose only. This is not buying or selling recommendations. I am not SEBI registered. Please consult your financial advisor before taking any trade.

Kalyan Jewellers India Ltd - Long Setup, Move is ON...#KALYANKJIL trading above Resistance of 341
Next Resistance is at 463
Support is at 241
Here are previous charts:
Chart is self explanatory. Levels of breakout, possible up-moves (where stock may find resistances) and support (close below which, setup will be invalidated) are clearly defined.
Disclaimer: This is for demonstration and educational purpose only. This is not buying or selling recommendations. I am not SEBI registered. Please consult your financial advisor before taking any trade.

Kddl Limited - Long Setup, Move is ON...#KDDL trading above Resistance of 2359
Next Resistance is at 3064
Support is at 1830
Here are previous charts:
Chart is self explanatory. Entry, Resistances and Support are mentioned on the chart.
Disclaimer: This is for demonstration and educational purpose only. This is not buying or selling recommendations. I am not SEBI registered. Please consult your financial advisor before taking any trade.

Ganesha Ecosphere - Long Setup, Move is ON...#GANECOS trading above Resistance of 1025
Next Resistance is at 1363
Support is at 739
Here is previous chart:
Chart is self explanatory. Entry, Resistances and Support are mentioned on the chart.
Disclaimer: This is for demonstration and educational purpose only. This is not buying or selling recommendations. I am not SEBI registered. Please consult your financial advisor before taking any trade.

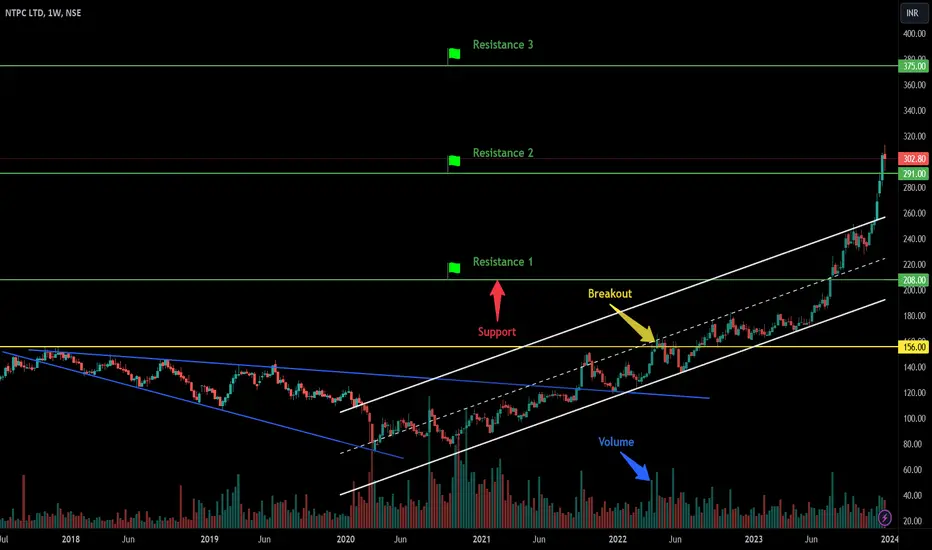
Ntpc Limited- Long Setup, Move is ON...#NTPC trading above Resistance of 291
Next Resistance is at 375
Support is at 208
Here are previous charts:
Chart is self explanatory. Levels of breakout, possible up-moves (where stock may find resistances) and support (close below which, setup will be invalidated) are clearly defined.
Disclaimer: This is for demonstration and educational purpose only. This is not buying or selling recommendations. I am not SEBI registered. Please consult your financial advisor before taking any trade.
Bullish Flag pattern breakout in BATAINDIABATA INDIA LTD
Key highlights: 💡⚡
✅On 1 Day Time Frame Stock Showing Breakout of Bullish Flag Pattern.
✅Strong Bullish Candlestick Form on this timeframe.
✅It can give movement up to the Breakout target of 1630+.
✅Can Go Long in this Stock by placing a stop loss below 1432-.

Central Depository Services Ltd - Long Setup, Move is ON...#CDSL trading above Resistance of 1734
Next Resistance is at 2261
Support is at 1240
Here is previous chart:
Chart is self explanatory. Entry, Resistances and Support are mentioned on the chart.
Disclaimer: This is for demonstration and educational purpose only. This is not buying or selling recommendations. I am not SEBI registered. Please consult your financial advisor before taking any trade.

Black Box Ltd - Long Setup, Move is ON...#BBOX trading above Resistance of 248
Next Resistance is at 293
Support is at 184
Here is previous chart:
Chart is self explanatory. Levels of breakout, possible up-moves (where stock may find resistances) and support (close below which, setup will be invalidated) are clearly defined.
Disclaimer: This is for demonstration and educational purpose only. This is not buying or selling recommendations. I am not SEBI registered. Please consult your financial advisor before taking any trade.

Bullish Flag pattern breakout in SBILIFESBI LIFE INSURANCE COMPANY LTD
Key highlights: 💡⚡
✅On 1 Hour Time Frame Stock Showing Breakout of Bullish Flag Pattern.
✅Strong Bullish Candlestick Form on this timeframe.
✅It can give movement up to the Breakout target of 1651+.
✅Can Go Long in this Stock by placing a stop loss below 1431-.

Double Bottom pattern breakout in BPCLBHARAT PETROLEUM CARPORATION LTD
Key highlights: 💡⚡
✅On 1 Hour Time Frame Stock Showing Breakout of Dobble Bottom Pattern.
✅Strong Bullish Candlestick Form on this timeframe.
✅It can give movement up to the Breakout target of 305+.
✅Can Go Long in this Stock by placing a stop loss below 298-.

Rising Wedge pattern breakout in BHELBHARAT HEAVY ELECTRICALS LTD
Key highlights: 💡⚡
✅On 1 Hour Time Frame Stock Showing Breakout of Rising Wedge Pattern.
✅Strong Bullish Candlestick Form on this timeframe.
✅It can give movement up to the Breakout target of 308+.
✅Can Go Long in this Stock by placing a stop loss below 295-.

Raymond - Breakout Setup, Move is ON...#RAYMOND trading above Resistance of 1734
Next Resistance is at 2676
Support is at 1339
Here are previous charts:
Chart is self explanatory. Levels of breakout, possible up-moves (where stock may find resistances) and support (close below which, setup will be invalidated) are clearly defined.
Disclaimer: This is for demonstration and educational purpose only. This is not buying or selling recommendations. I am not SEBI registered. Please consult your financial advisor before taking any trade.

GRSE - Breakout Setup, Move is ON...#GRSE trading above Resistance of 1176
Next Resistance is at 1677
Support is at 892
Here are previous charts:
Chart is self explanatory. Levels of breakout, possible up-moves (where stock may find resistances) and support (close below which, setup will be invalidated) are clearly defined.
Disclaimer: This is for demonstration and educational purpose only. This is not buying or selling recommendations. I am not SEBI registered. Please consult your financial advisor before taking any trade.

Reversal Broadening Wedge pattern in VOLTASVOLTAS LTD
Key highlights: 💡⚡
📈 On 1 Hour Time Frame Stock Showing Reversal of Broadening Wedge Pattern.
📈 It can give movement upto the Reversal Final target of Above 1595+.
📈 There have chances of breakout of Resistance level too.
📈 After breakout of Resistance level this stock can gives strong upside rally upto Above 1688+.
📈 Can Go Long in this stock by placing a stop loss Below 1427-.

GIPCL - Breakout Setup, Move is ON...#GIPCL trading above Resistance of 239
Next Resistance is at 313
Support is at 171
Here are previous charts:
Chart is self explanatory. Levels of breakout, possible up-moves (where stock may find resistances) and support (close below which, setup will be invalidated) are clearly defined.
Disclaimer: This is for demonstration and educational purpose only. This is not buying or selling recommendations. I am not SEBI registered. Please consult your financial advisor before taking any trade.

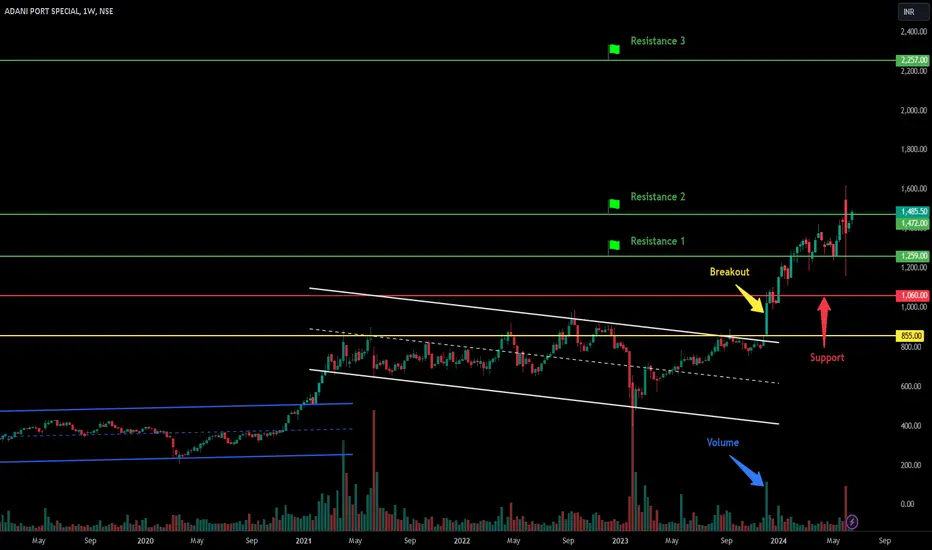
Adani Ports - Long Setup, Move is ON...#ADANIPORTS trading above Resistance of 1472
Next Resistance is at 2257
Support is at 1060
Here are previous charts:
Chart is self explanatory. Levels of breakout, possible up-moves (where stock may find resistances) and support (close below which, setup will be invalidated) are clearly defined.
Disclaimer: This is for demonstration and educational purpose only. This is not buying or selling recommendations. I am not SEBI registered. Please consult your financial advisor before taking any trade.
The Phoenix Mills Limited - Breakout Setup, Move is ON...#PHOENIXLTD trading above Resistance of 3567
Next Resistance is at 4316
Support is at 3013
Here are previous charts:
Chart is self explanatory. Levels of breakout, possible up-moves (where stock may find resistances) and support (close below which, setup will be invalidated) are clearly defined.
Disclaimer: This is for demonstration and educational purpose only. This is not buying or selling recommendations. I am not SEBI registered. Please consult your financial advisor before taking any trade.

Peninsula Land Ltd - Cup with handle patternThe "Cup with Handle" pattern is a bullish continuation chart pattern that signals a potential continuation of an uptrend after a period of consolidation. When observed in Peninsula Land's stock chart, this pattern indicates the possibility of further price increases. Cup with handle pattern formation complete in 4 months
Key Characteristics:
Cup Shape: The pattern starts with a rounded "U"-shaped bottom, resembling a teacup. This indicates a period of consolidation where the price declines slightly, then gradually recovers to approximately the same level as before the decline.
Handle Formation: After the cup is formed, a smaller consolidation or slight pullback occurs, forming the "handle." This handle often slopes downward slightly, indicating a brief pause before the next move upward.
Breakout Point: The breakout occurs when the price moves above the resistance level formed by the highs on either side of the cup.
Implications for Peninsula Land:
Market Sentiment: The cup with handle pattern indicates a period of accumulation and investor confidence, suggesting that the stock is likely to continue its upward trajectory after the handle formation.
Entry Point: Traders often consider entering a long position once the price breaks out above the handle's resistance level 75, confirming the pattern.
Target Price:
Long above 75
SL below 63
Target 1 92, 100 and 120

Bajaj Consumer - Rounding PatternThe "Rounding Bottom" or "Saucer Bottom" chart pattern is a technical analysis indicator that can signal a potential bullish reversal in the price of a stock. When observed in Bajaj Consumer's stock chart, this pattern suggests that the stock may have reached its lowest point and is poised for an upward trend.
Key points to note that when bullish curve started, started with Morning star then bullish piercing and finally bullish engulfing. Lows of the bullish candle indicate that the market has bottomed out.
Key Characteristics:
Shape: The pattern resembles a "U" shape, indicating a gradual shift from a downtrend to an uptrend.
Duration: It typically forms over a longer period, often several weeks to months, reflecting a slow shift in market sentiment. Here it takes more a year
Volume: Volume tends to decrease at the bottom of the pattern and increases as the price begins to rise, confirming the potential reversal.
Implications for Bajaj Consumer:
Market Sentiment: The pattern reflects a shift from bearish to bullish sentiment among traders and investors.
Entry Point: Investors might consider entering a long position as the stock breaks out from the rounding bottom pattern, signaling the start of a potential uptrend.
Target Price: The expected target price after the breakout can often be estimated by measuring the depth of the rounding bottom and projecting it upward from the breakout point.
How to Trade:
If Bajaj Consumer's stock shows a rounding bottom with the lowest point at ₹200 and the breakout occurs at ₹260, the depth is ₹60. Hence, the target price could be around ₹320 (₹260 + ₹60).
Regards
Arvind Yadav, Cfa
Arvind Share Academy

Breakout in Cera Sanitaryware Limited...Chart is self explanatory. Levels of breakout, possible up-moves (where stock may find resistances) and support (close below which, setup will be invalidated) are clearly defined.
Disclaimer: This is for demonstration and educational purpose only. This is not buying or selling recommendations. I am not SEBI registered. Please consult your financial advisor before taking any trade.

Inox Green Energy Services Ltd - Breakout Setup, Move is ON...#INOXGREEN trading above Resistance of 160
Next Resistance is at 245
Support is at 99
Here are previous charts:
Chart is self explanatory. Levels of breakout, possible up-moves (where stock may find resistances) and support (close below which, setup will be invalidated) are clearly defined.
Disclaimer: This is for demonstration and educational purpose only. This is not buying or selling recommendations. I am not SEBI registered. Please consult your financial advisor before taking any trade.
