Vimta Labs Limited - Breakout Setup, Move is ON...#VIMTALABS trading above Resistance of 952
Next Resistance is at 1214
Support is at 691
Here are previous charts:
Chart is self explanatory. Levels of breakout, possible up-moves (where stock may find resistances) and support (close below which, setup will be invalidated) are clearly defined.
Disclaimer: This is for demonstration and educational purpose only. This is not buying or selling recommendations. I am not SEBI registered. Please consult your financial advisor before taking any trade.
Chartpatterntrading

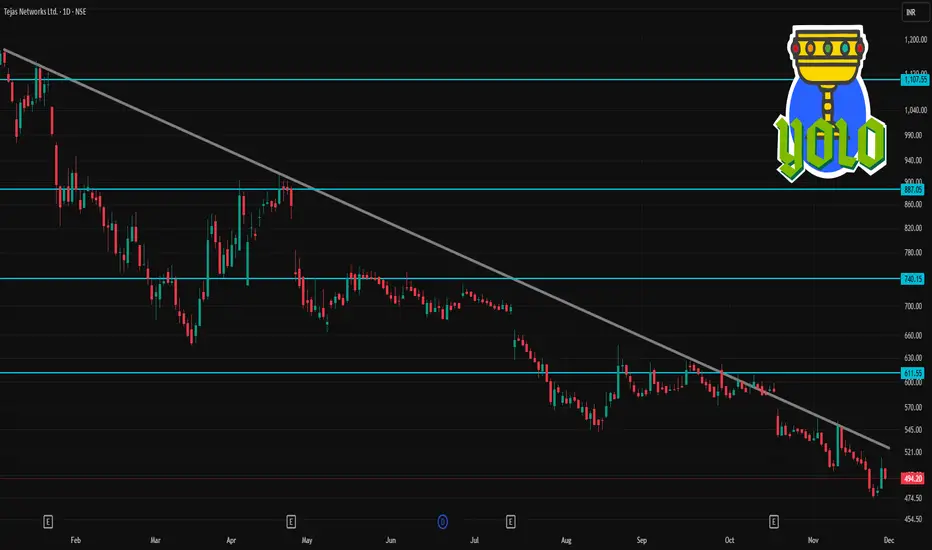
TEJASNET 1 Day Time Frame 📌 Current Price & Context
Recent data shows TEJASNET trading around ₹494–₹496.
52-week range: Low ~ ₹474.45, High ~ ₹1,402.70.
On 1-day/short-term technicals: the consensus remains “Sell / Strong Sell”.
So — the stock is near its lower end of the 52-week range, but short-term momentum is weak.
✅ What This Means for Traders (1-Day / Intraday)
As of now, bias on 1-day timeframe remains bearish / neutral. Unless there is a strong positive catalyst, further downside or consolidation is more likely than a sustained bounce.
The zone around ₹484–₹486 (and possibly down to ₹471–₹475) is critical support — a breakdown below could open a bigger downside swing.
On the upside, watch ₹511–₹512 and then ₹520–₹525 for any meaningful resistance breaks — only a close above these may suggest short-term relief.
Because moving averages are well above current price, any upside rally may remain limited unless volume and market-wide sentiment improve.
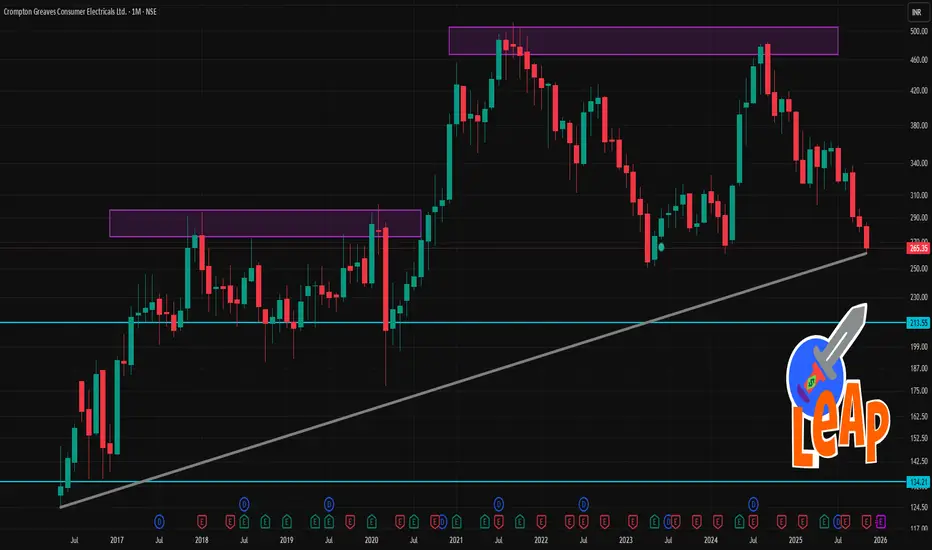
Crompton 1 Month Time Frame 📉 Recent context & background
The stock recently hit a fresh 52-week low — around ₹267.5–₹271.25.
Latest quarter (Q2 Sep-2025) saw a sharp profit drop: net profit fell ~43% YoY, with EBITDA margin under pressure due to commodity cost inflation and restructuring costs.
On the flip side, the company’s broader business mix (like pumps / small domestic appliances / solar-rooftop orders) and some analyst estimates still see potential for recovery.
🧭 What could move the price in next 1 month
Positive triggers: Any signs of margin recovery, easing of commodity inflation, good order wins (e.g. solar-segment orders or domestic appliance demand), supportive news or institutional interest.
Negative triggers: Continuation of margin pressure, weak demand in core categories, negative macro / interest-rate or inflation environment, or broader investor risk-off sentiment.
🎯 My Base-Case 1-Month Scenarios
Bearish to neutral scenario: Price may hover or drift around ₹260–₹285, possibly bouncing between support (₹265–₹270) and resistance (₹280–₹290).
Bullish/recovery scenario: If sentiment improves, stock could aim for ₹300–₹330 over the next 3–4 weeks — especially if company provides encouraging updates or sector environment improves.
Upside breakout scenario (less likely in short 1-month): A push toward ₹340 is possible only if there’s a strong catalyst (e.g., margin rebound, big orders, broadly bullish market) — but that feels optimistic for just 1 month.
NUVAMA 1 Day Time Frame 📈 Current Price & Setup
NUVAMA is trading around ₹7,480–7,550 lately.
Over the past 52 weeks the stock’s range is roughly ₹4,735 (low) to ₹8,508 (high).
🔎 Technical Outlook (1‑day timeframe)
On daily chart indicators (moving averages + oscillators), many third‑party sources mark NUVAMA as a “Strong Buy” today.
Short‑term technical bias appears bullish, with recent momentum favouring upside over downside.
⚠️ Important Considerations & Fundamentals
The company’s valuations appear relatively rich: the price‑to‑book (P/B) ratio is elevated.
Promoter pledge status is non‑trivial — as per recent data, a significant portion of promoter holding is pledged.
As always: on a 1‑day timeframe the stock can be volatile — technical signals are strong, but broader market conditions (macro, sector sentiment, news, flows) will matter a lot.

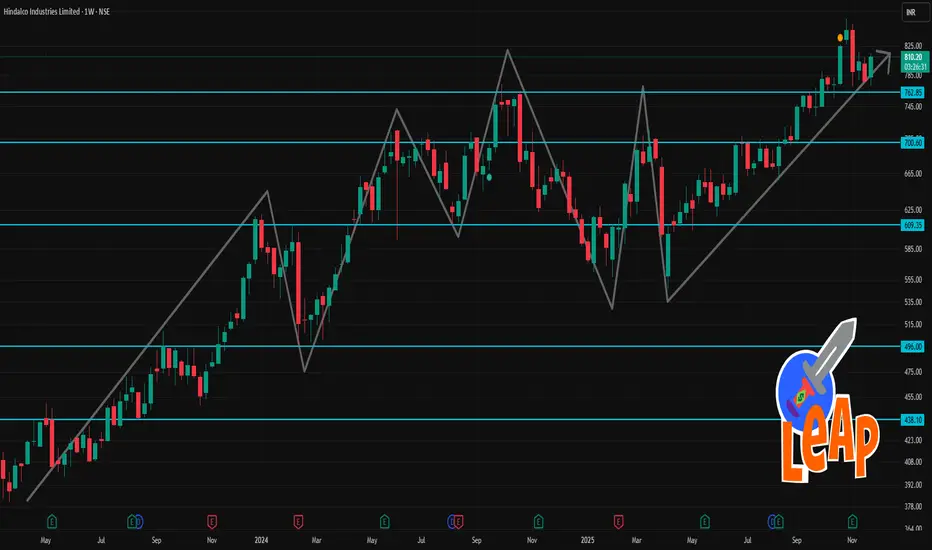
HINDALCO 1 Week TIme Frame 📌 Current Snapshot
Current price: ~ ₹810–812.
52‑week high / low: ₹864 / ₹546.45
Over the past week, the stock has gained roughly 4–5%.
📈 Key Technical Levels for This Week
If price holds above ~₹766–770, bias remains neutral-to-bullish.
A decisive close above ~₹820 could open upside toward previous highs / next resistance zones.
If price breaks below ~₹755–760, risk of downside increases — watch for potential decline toward lower support zones.
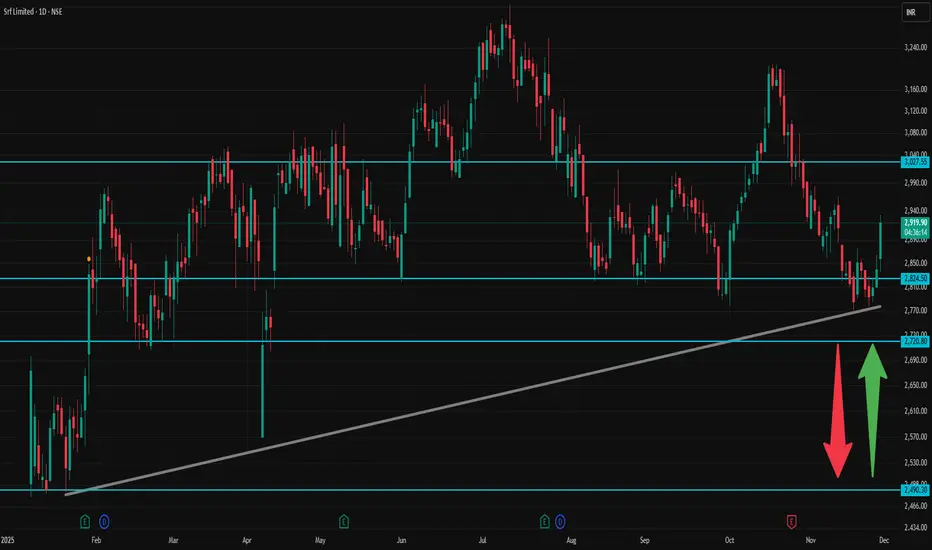
SRF 1 Day Time Frame ✅ Current context
According to public price data, SRF’s recent high for the day is ~ ₹ 2,933, low ~ ₹ 2,836.80.
As per a technical‑analysis summary: moving averages (short-to-medium term) and oscillators on daily timeframe show a bullish bias (Strong Buy on many signals).
🎯 How to interpret / trade with these levels
As long as price stays above Pivot (~₹ 2,866), bias remains mildly bullish — look for R1 → R2 → R3 as possible targets.
If momentum is strong (volume + positive broader market), a break above R2 (~₹ 2,920) could push toward R3 (~₹ 2,933–2,937+).
On downside, supports at ₹ 2,811.93 → ₹ 2,783.87 → ₹ 2,757.73 are key — loss of S1 may open S2/S3.
For conservative traders: good entry or add-on zones could be near S1 or pivot, with stop‑loss a little below S2/S3 depending on risk tolerance.
⚠️ Important caveats
These are static pivot-based levels, and real market moves may overshoot or not respect them depending on news, volume, macro‑market sentiment.
Given volatility (as seen in day’s high-low range), levels above R2 or below S2 can get tested — intraday discipline (stop-loss, position sizing) is crucial.
Always watch volume, overall index trend (Nifty/Sensex), sector news — technical levels work better when confirmed by context.
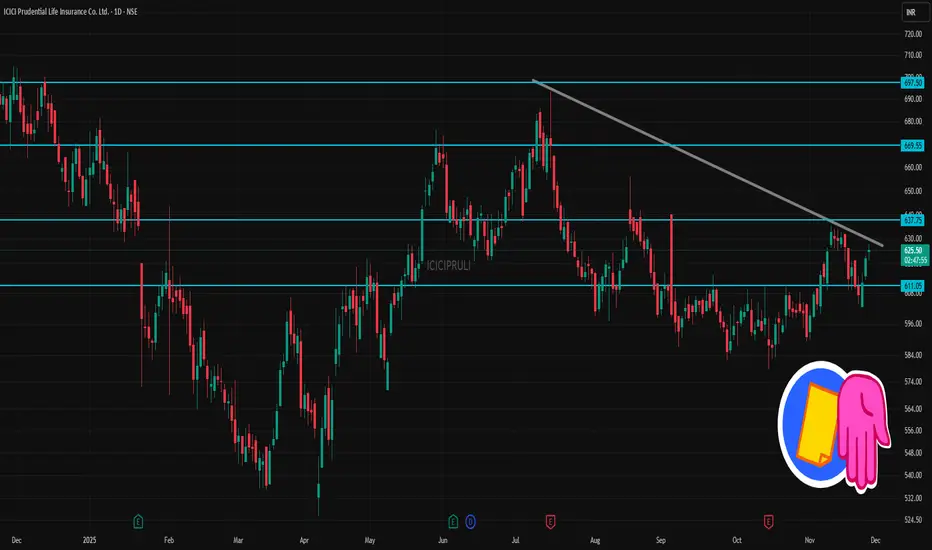
ICICIPRULI 1 Day Time Frame 📌 Latest Price & Context
Recent traded price: ~ ₹ 625–626.
52‑week range: Low ~ ₹525.80 — High ~ ₹704.70.
📈 What It Suggests (For 1‑Day / Short‑Term View)
As long as price remains above ~₹ 623–625, there is a short‑term bullish bias — next target could be ~₹ 630–635.
Dip toward ~₹ 615–620 could offer a buy‑on‑dip type entry (for traders), if volume and overall market sentiment stay supportive.
If price breaks below ~₹ 605–600, it may head toward the lower support zone — then caution/adapt strategy.
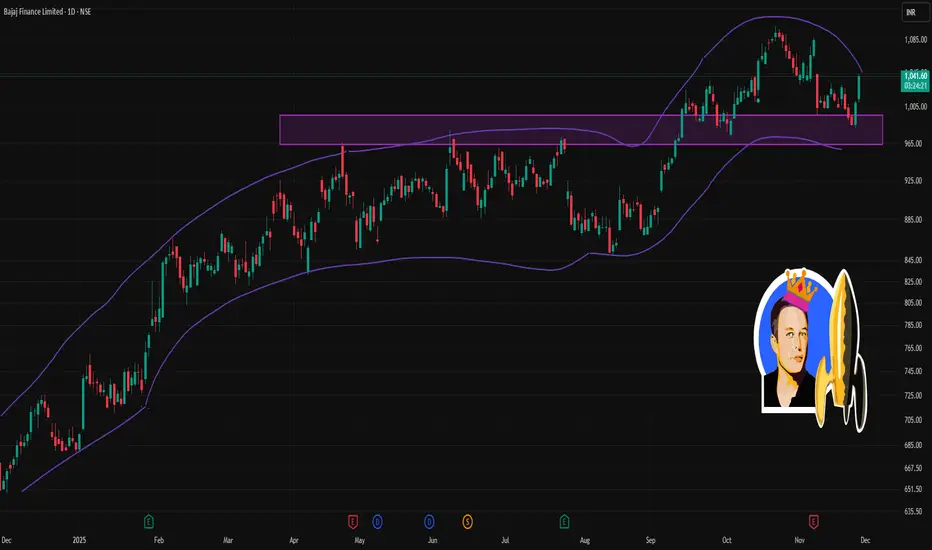
BAJFINANCE 1 Day Time Frame ✅ What we know now (as of latest available data)
1. The latest publicly quoted price for Bajaj Finance is ~ ₹1,042 – ₹1,044.
2. According to a recent report, the stock touched an intraday high of ₹1,042.20.
3. The stock is above its short‑ and long‑term moving averages, which suggests current bullish momentum.
⚠️ Important Notes / Context
These are technical levels derived using standard pivot‑point / support‑resistance calculation methods. They are not guaranteed — markets may overshoot or violently gap.
Always consider fundamentals (company news, sector, broader market sentiment) along with technicals before acting.
Use stop‑loss / risk management because intraday volatility can cause swings beyond these levels.
HDFCBANK 1 Week Time Frame 🔹 Quick Snapshot
1. The current share price is about ₹ 1,015.
2. 52‑week range: Low ≈ ₹ 812.15, High ≈ ₹ 1,020.50.
3. Recent weekly momentum and technicals appear neutral-to‑slightly bullish: short‑term indicator signals mostly “buy”, and momentum oscillators (like MACD) are supportive.
🔄 What to Watch: Scenarios for the Week
Bullish breakout: If HDFC Bank closes above ~₹ 1,011–₹ 1,013 with good volume, there’s potential to rally toward ₹ 1,025–₹ 1,038 in coming days.
Range‑bound / consolidation: If price hovers between ₹ 984–₹ 1,013, expect sideways action — possibly oscillating in that band.
Bearish breakdown: A decisive close below ₹ 984 may send it toward ₹ 970–₹ 956, increasing risk of deeper downside, especially if market sentiment turns weak.

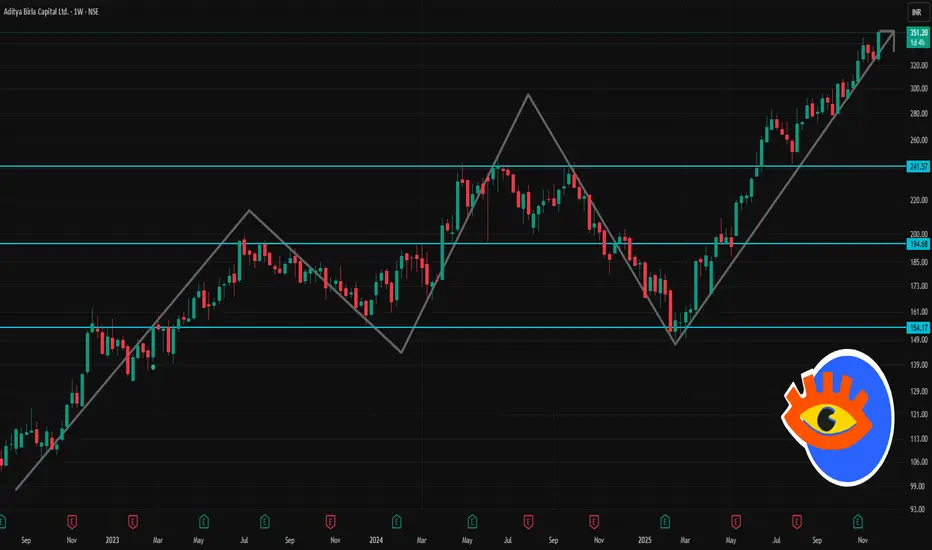
ABCAPITAL 1 Week Time Frame 📊 Key recent data & context
1. The stock recently closed around ₹349.80.
2. Over the past week it has delivered a positive return (roughly +6–7 %).
3. According to a recent technical outlook, immediate support is seen at ≈ ₹320.87, and major support at ≈ ₹316.08. On the upside, immediate resistance is around ≈ ₹333.77, with major resistance at ≈ ₹341.88.
✅ What to Watch — Possible Scenarios
Bullish scenario: If price stays above ~₹333.8 and market sentiment holds up, stock could attempt a move toward ~₹341–342.
Sideways / consolidation: Price may oscillate between ~₹320–₹335 if broader market remains neutral — could be a choppy week.
Bearish scenario: A decisive break below ~₹320.9 (with volume) could drag price toward ~₹316 or lower — a risk point for short‑term holders.
⚠️ Other Technical Notes & Volatility
The stock shows fairly significant volatility: 5‑week range typically ~5.85% for ABCAPITAL.
Broader trend appears positive: moving averages and momentum indicators have been showing strength lately.
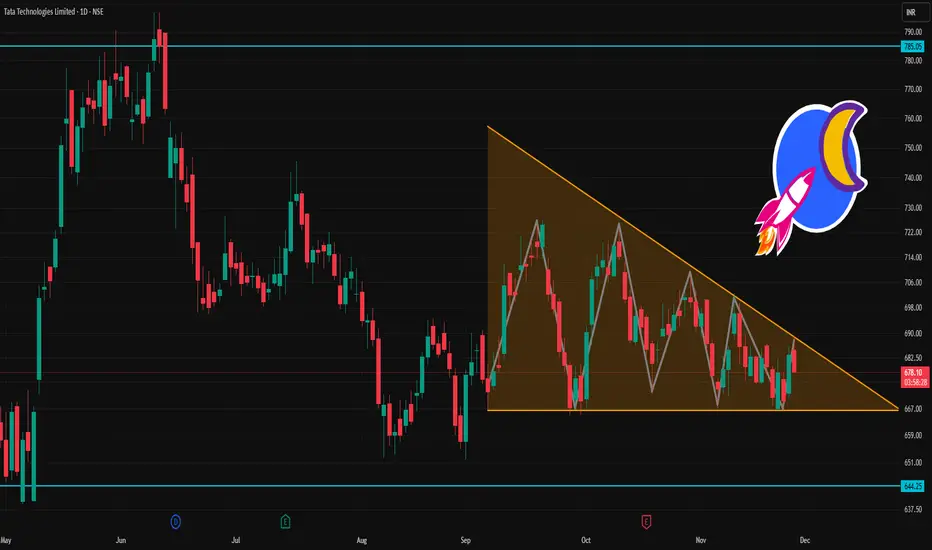
TATATECH 1 Day Time Frame 📌 Key recent data (approx as of last close):
Last traded price: ~ ₹676.75.
Day high / low: ~ ₹679 / ₹670.25.
52‑week high: ~ ₹973.85; 52‑week low: ~ ₹597.
🧮 What this suggests for today (intraday / short‑term only):
If Tata Tech trades above ₹672.7, it could aim for ₹677–684 as short‑term resistance.
A fall below ₹672.7 might push price toward ₹665–661 as support.
₹684–696 could act as a more extended intraday upside zone, if there’s bullish momentum.
🔎 Context & What to Watch Out For
The 52‑week high is still much higher — so in a broader sense, the stock remains far off prior highs.
On short‑term charts, some indicators (e.g. moving‑average crossovers / candle‑pattern heuristics) recently gave bearish / neutral signals.
Volatility and broader market sentiment (especially in the auto / engineering‑services / global tech outsourcing space) can swing prices significantly — so these levels are very approximate.
Gravita Triangle Breakout 1DGravita is attempting to breakout after forming a triangle pattern on 1D timeframe with high volumes. The stock is also trading above 200ema. Enter after bullish confirmation.

Premium Chart PatternsPremium chart patterns are advanced market structures that go beyond basic triangles, flags, and double tops. These patterns are used by experienced traders, institutional desks, and serious technical analysts to catch moves before the majority notices. What makes them “premium” is their reliability, deeper logic, and ability to identify institutional activity, liquidity traps, and major swing reversals.
While basic chart patterns rely on simple visual structures, premium patterns focus on price psychology, volume behavior, liquidity engineering, and market structure transitions. These tools help traders understand why price is moving in a certain direction—not just how it looks.

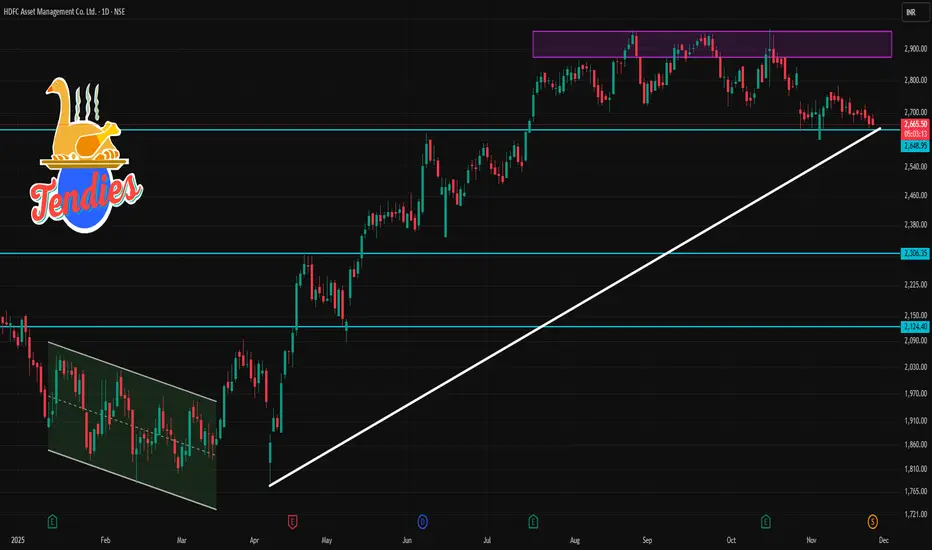
HDFCAMC 1 Day Time Frame 📊 Current Price & Context
1. Recent quoted price on several platforms is ~ ₹ 2,667 / ₹ 2,670 (on an adjusted basis, after its 1:1 bonus share issue) for HDFCAMC.
2. Historically (pre-bonus) the “old” nominal price was ~ ₹ 5,336–₹ 5,340.
3. The share is currently trading with valuation metrics: high P/E, high P/B (as per screener data) indicating it remains a premium/ high-valuation stock.
🎯 What This Means for Intraday / Short-Term Moves
If the price stays above the pivot (≈ ₹ 2,689), that suggests a short-term bullish bias; watch for a move toward the first resistance near ₹ 2,710–₹ 2,728.
If price slips below support ~₹ 2,652, the next downside targets are ₹ 2,635 then ₹ 2,614 — a break below those could open risk of further slide.
Holding above the pivot + a bounce off support (with volume) may indicate renewed upside momentum; conversely, a breakdown below support zones might suggest weakness.
⚠️ Special Context — Corporate Action Impact
The stock recently went “ex-bonus,” with a 1:1 bonus issue, meaning number of shares doubled and price was adjusted downward — which explains the division between older ₹ 5,300-plus quotes and newer ~₹ 2,600-₹ 2,700 quotes.
Because of this adjustment, comparing current technical levels with older price history needs caution — especially if referencing older support/resistance zones.
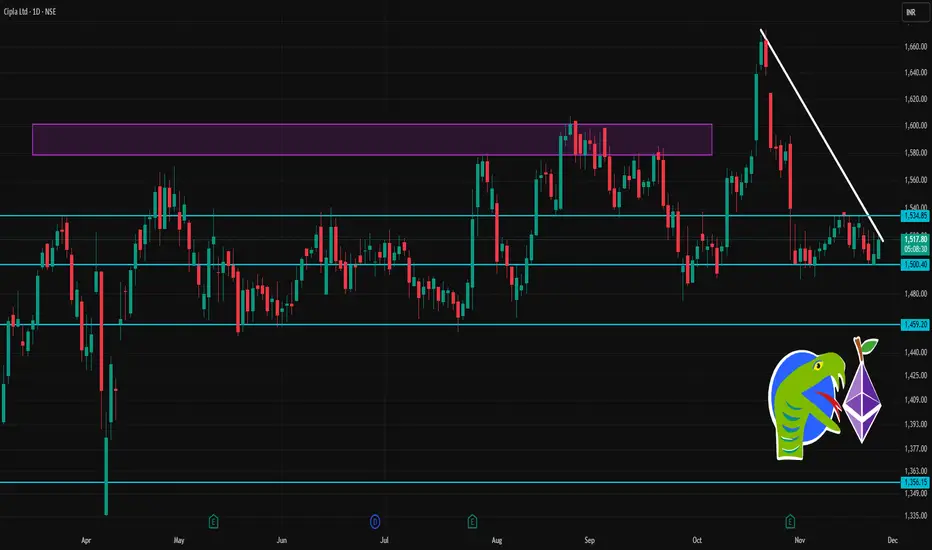
CIPLA 1 Day Tiem Frame 📊 Current Snapshot (approx)
Last traded / Current Price (NSE / BSE): ~ ₹ 1,517
Today’s trading range (so far): Low ~ ₹ 1,505; High ~ ₹ 1,520.90
52-week range: Low ~ ₹ 1,335; High ~ ₹ 1,673.
🔹 Daily Pivot & Key Levels for CIPLA
Based on standard daily pivot-point analysis for today.
Level Type Price (approx)
Pivot (central) ₹ ~1,510.13
Support 1 (S1) ~ ₹ 1,497.6
Support 2 (S2) ~ ₹ 1,487.6
Support 3 (S3) ~ ₹ 1,475.1
Resistance 1 (R1) ~ ₹ 1,520.1
Resistance 2 (R2) ~ ₹ 1,532.6
Resistance 3 (R3) ~ ₹ 1,542.6
Central Pivot (CPR range): ~ ₹ 1,508.8 – 1,511.4
🔍 What to Watch — Intraday Scenarios
Bullish bias: If price stays above pivot (~₹ 1,510), look for near-term resistance at ₹ 1,520 → ₹ 1,532 → ₹ 1,542+.
Bearish trigger: If price breaks below S1 (~₹ 1,497), downside may extend toward ₹ 1,487 → ₹ 1,475.
Momentum context: According to recent technical indicator readings, moving averages (5, 10, 20-day) appear in bullish alignment — which suggests the trend is currently upward to neutral.
Volatility range for the day could realistically span ~ ₹ 1,475 – ₹ 1,545, if price tests extremes.
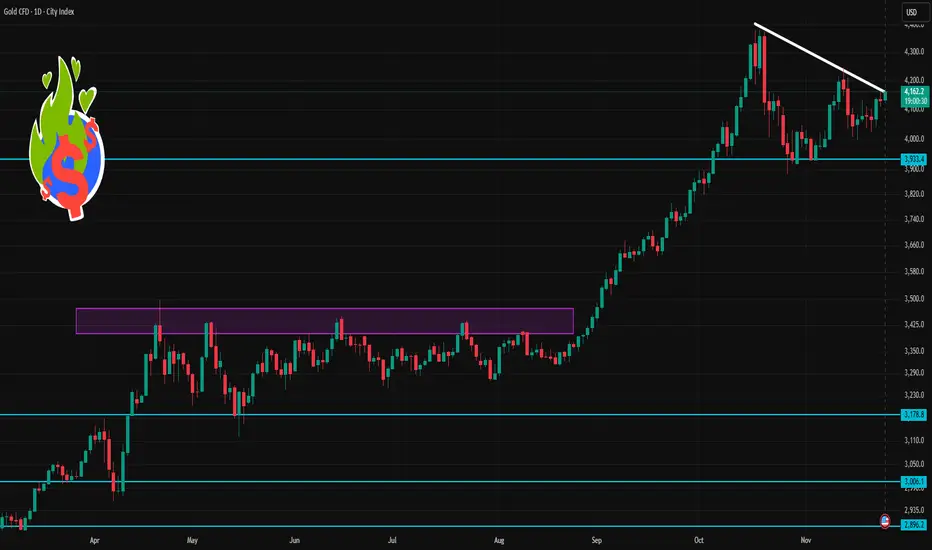
Gold 1 Day Time Frame 🔎 Current Context
1. Gold currently trades around US $4,160–4,165/oz.
2. Many technical-analysis services show daily momentum as bullish: moving averages, RSI/MACD and other indicators point toward a positive bias.
3. But macro factors (strong USD, Fed policy, global risk sentiment) remain important and may cause sharp swings.
⚠️ What to Watch Out For
Volatility: Gold remains sensitive to macro events — USD strength, rate expectations, major economic data — so price can easily break support/resistance zones.
False Breakouts: Even if price crosses a level, it may revert quickly. Combine with other indicators (volume, price action, confirmations) before acting.
Trend Shifts: A major change in global risk sentiment or central-bank moves can rapidly change trend direction, invalidating technical levels.
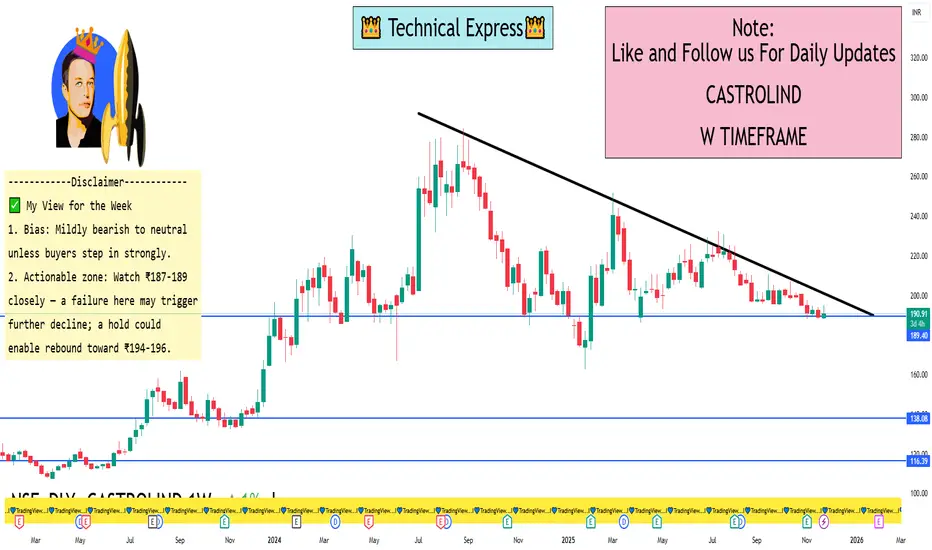
CASTROLIND 1 Week View 🔍 Key Levels
Based on recent technical data:
Support zone: ~ ₹187 – ₹189 (ET Money shows S3 ≈ ₹185.42, S2 ≈ ₹186.71)
Pivot / near-term equilibrium: ~ ₹190 – ₹191 (Weekly central pivot ~₹190.42)
Upside resistance: ~ ₹194 - ₹196 (Weekly R1 ~₹192.83, R2 ~₹196.64)
📈 Short-Term Bias & Likely Scenarios
The momentum indicators (RSI ~33, CCI negative) show the stock is under downward pressure/weak momentum.
If the price stays above ₹187-189, one could anticipate a bounce up into the ₹194-196 zone this week.
If it breaks below ~₹187-189 decisively, support further down could be ~₹183-185 (based on extension levels)
✅ My View for the Week
Bias: Mildly bearish to neutral unless buyers step in strongly.
Actionable zone: Watch ₹187-189 closely — a failure here may trigger further decline; a hold could enable rebound toward ₹194-196.
If you want a more aggressive trade setup (with stop-loss, reward ratio), I can map that too.
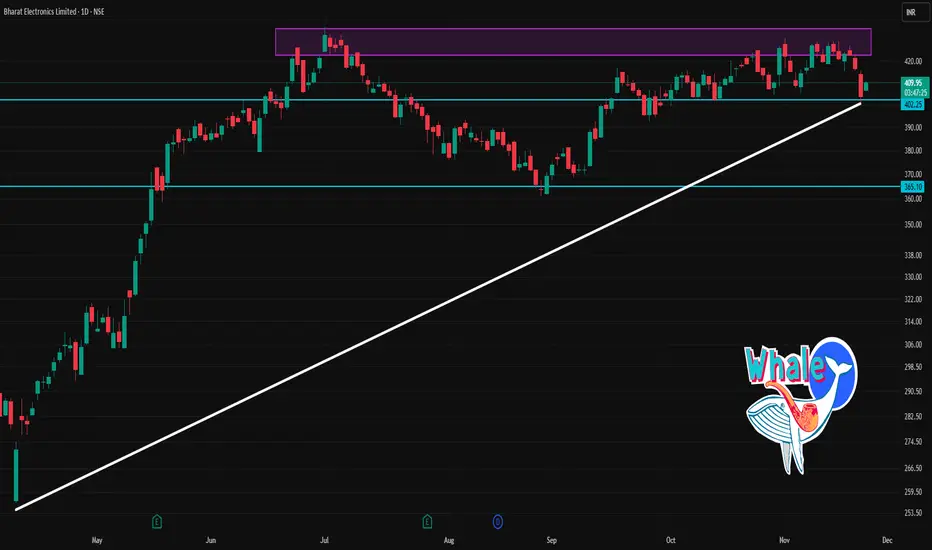
BEL 1 Day Time Frame✅ Current Status
Latest price around ₹407 – ₹410 on the NSE/BSE.
Technical indicators (daily time frame) are leaning bearish/weak: e.g., daily moving averages show more “sell” signals than “buy”.
📌 Key Levels to Watch (Daily Chart)
Based on available pivot/level data and recent price action, here are approximate levels:
Support levels:
S1 ~ ₹407–₹408
S2 ~ ₹405–₹406
A deeper support zone if this breaks might be ₹400-₹404.
Resistance levels:
Pivot ~ ₹413-₹414
R2 ~ ₹416-₹417
R3 ~ ₹419-₹420+
🔍 Short-Term Outlook
Because the stock is hovering just above support (~₹407-₹408), holding above this zone is important to maintain near-term structure.
If price breaks below ~₹405, risk of further weakness increases.
On the upside, a successful breakout above ~₹416-₹417 could open space towards ~₹419-₹420.
The current momentum is weak/negative, so any upside will likely need a catalyst (volume, news) to gain strength.
LICHSGFIN 1 Day Time Frame 📍 Key Current Levels
The stock is trading around ₹ 550 (recent quotes ~₹ 548-550) on the NSE.
Pivot & major levels (from one source) on the daily:
Classic pivot: ~₹ 550.32
Support levels: ≈ ₹ 547.39 (S1), ≈ ₹ 542.02 (S2)
Resistance levels: ≈ ₹ 555.69 (R1), ≈ ₹ 558.62 (R2)
Longer-term moving averages: 50-day MA ≈ ₹ 559.47; 200-day MA ≈ ₹ 570.32 — both above current price, indicating downward pressure.
RSI and oscillator reading: RSI around ~41 (neutral/leaning oversold) per one data point.
🔍 Interpretation & What to Watch
With price below major moving averages (50 & 200 day), the bias remains bearish on the daily chart.
The pivot around ₹ 550 is a key level: holding above may help stabilise; falling below could signal more weakness.
Important support to watch: ~₹ 547 and then ~₹ 542. If these break, risk of further downside.
Key resistance: ~₹ 555-558 zone. A break up through that with volume could offer short-term upside.
The RSI being relatively low (though not deeply oversold) suggests potential for a rebound if positive trigger arises, but trend is not yet positive.
Because the broader trend remains negative, any bounce should be treated cautiously unless backed by strong volume and a clear breakout above that resistance zone.

ENRIN 1 Day Time Frame 🔍 Key Price Info
Last traded ~ ₹3,090 (as of ~10:44 AM IST) on 25 Nov 2025.
Day’s high-low range: ~ ₹3,090 – ₹3,303 (intraday high reported ~₹3,303).
52-week range: ~ ₹2,508.80 – ₹3,625.00.
🎯 Support & Resistance Levels (Short Term)
Support Levels:
~ ₹3,050 – ₹3,070: close to current price, would be first level of support.
~ ₹3,000 – ₹3,030: if the stock breaks below the above, this zone becomes important.
~ ₹2,950 – ₹2,990: deeper support and closer to lower end of recent consolidation.
Resistance Levels:
~ ₹3,250 – ₹3,300: recent high zone around ₹3,303, so getting above this would be bullish.
~ ₹3,350 – ₹3,400: next significant zone before approaching the 52-week high.
~ ₹3,600+: near the 52-week high (₹3,625) and a major resistance barrier.
📉 Intraday Trading View
If the stock holds above ~₹3,050-₹3,070 with strong volume, it could attempt a push toward the resistance zone of ~₹3,250-₹3,300.
If it loses support at ~₹3,050, watch for potential slide toward ~₹3,000 or lower ~₹2,950 zone.
Volume, market sentiment & any corporate news will greatly influence whether it can break resistance or find support.

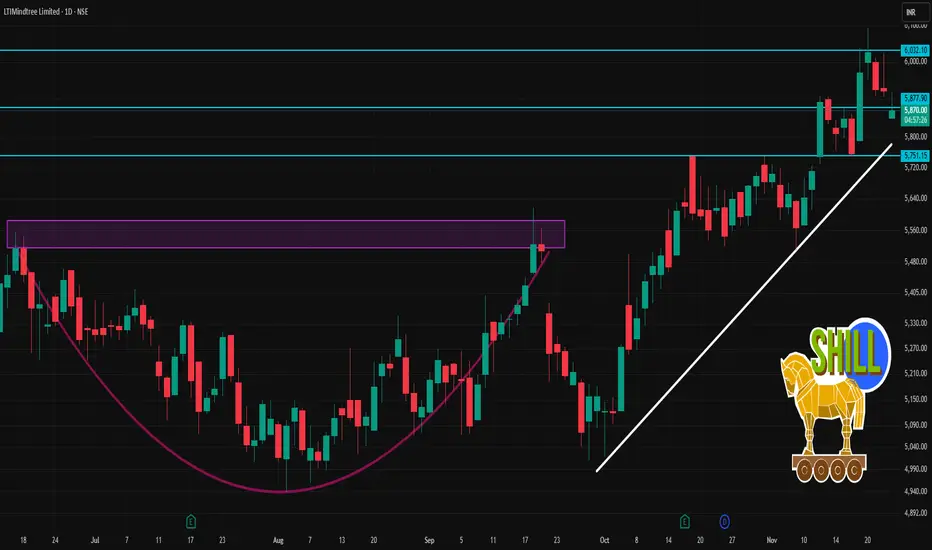
LTIM 1 Day Time Frame 🧮 Key Data Snapshot
Previous close: ~ ₹ 5,922.
Today’s intraday low: ~ ₹ 5,850.
Today’s intraday high: ~ ₹ 5,918.
52-week range: Low ~ ₹ 3,802, High ~ ₹ 6,767.95.
📌 1-Day Technical Levels to Watch
Support levels:
~ ₹ 5,850 — today’s intraday low; if price dips below this it may signal intraday weakness.
~ ₹ 5,760-5,770 — a slightly lower zone (recent intraday “floor” area) that could act as secondary support.
If those break, next meaningful structural support might be closer to ~ ₹ 5,500-5,600 (though further away, so bigger risk).
Resistance levels:
~ ₹ 5,918-5,920 — today’s intraday high; a breakout above this could open upside for the day.
~ ₹ 6,000 — psychological and round number resistance; if momentum pushes, this is the next target.
Above that, near the 52-week high (~₹ 6,767) but that’s more medium-term than for intraday.
🎯 Intraday Trading Scenarios
Bullish intra-day trade: If price holds above ~₹ 5,850 and breaks above ~₹ 5,920 with volume, one could target ~₹ 6,000 or slightly above for the day, with a stop-loss below ~₹ 5,850 (or even ~₹ 5,770 depending on risk tolerance).
Bearish intra-day trade: If price fails to hold ~₹ 5,850, and breaks down with momentum, one could look at a short, targeting ~₹ 5,700 or ~₹ 5,600. Stop-loss would be above ~₹ 5,910 zone.
Range-bound play: If the price continues to oscillate between ~₹ 5,850 and ~₹ 5,920, one might play the range – buy near the lower bound, sell near the upper bound, but keep stops tight.
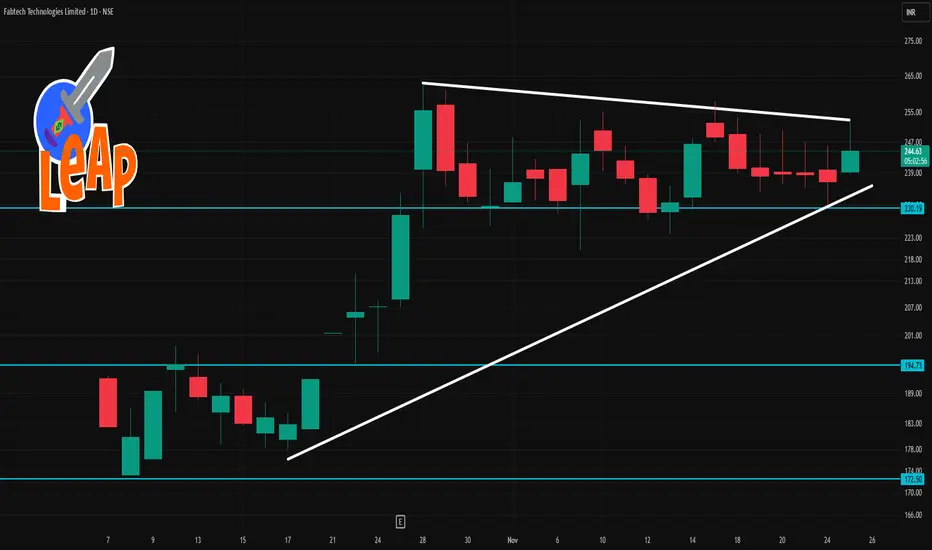
Fabtech 1 Day Time Frame 🔍 Technical Context
Moving averages (20-day, 50-day) are showing price above them, which suggests bullish bias.
Oscillators: RSI ~ 59-60 meaning moderate strength.
A recent source says the daily summary is “Neutral” on investing.com, indicating caution.
1-day pivot levels (classic) from Investing.com:
Pivot ~ ₹ 237.73
Resistance R1 ~ ₹ 240.46, R2 ~ ₹ 244.72, R3 ~ ₹ 247.45
Support S1 ~ ₹ 233.47, S2 ~ ₹ 230.74, S3 ~ ₹ 226.48
📊 Key Levels to Watch Today
Support Zone: ~ ₹ 233-235
If the stock approaches or dips into this area, watch for whether it holds or breaks.
Immediate Pivot / Mid-range: ~ ₹ 237-238
The pivot (~₹237.73) is a critical inflection point. A clear move above might bias upside; a break below may shift focus downward.
Resistance Zone: ~ ₹ 240-245
Upper resistance around ~₹240.46 to ~₹244.72. If momentum picks up and this zone is breached, next upside target ~₹247.45.
Lower Breakdown Level: ~ ₹ 230-227
If support in the ~233-235 zone fails, look toward ~₹230.74 and then ~₹226.48 as next real support.
IDBI 1 Week TIme Frame ✅ Key Levels
Support zone: ~ ₹99.30 and ~ ₹98.35.
Pivot / neutral price: ~ ₹100.94.
Resistance zone: ~ ₹101.89 and then ~ ₹103.53-₹104.48.
🎯 Watch-for This Week
A break above ~₹101.90 could unlock upside toward ~₹103.50/₹104.50.
A break below ~₹98.35 would signal increased weakness and could target support further down (~₹97 or lower) as per some longer-term charts.
Until one of these pivot points is decisively broken, expect the price to oscillate between ~₹99 and ~₹102.
