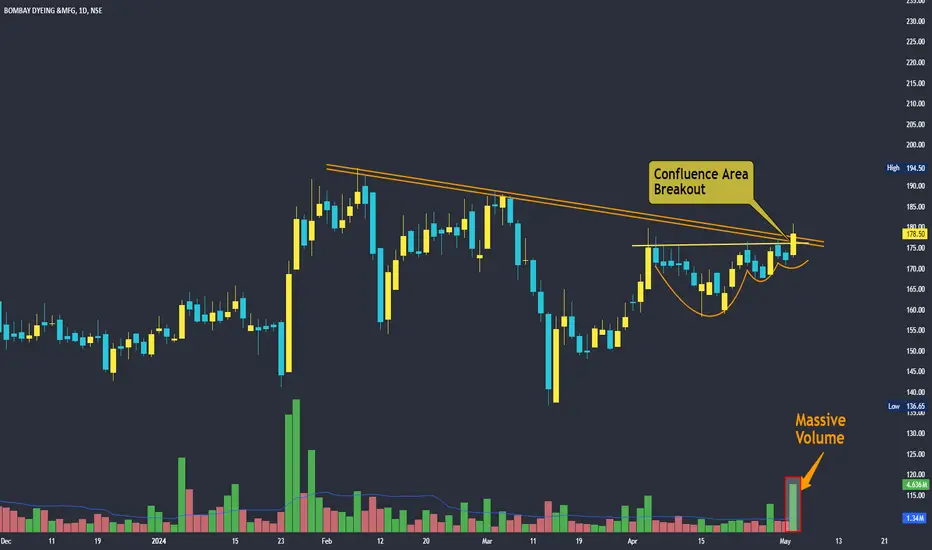
BOMDYEING - Strong VCP breakout + Multiple Trendline Breakout~ #BOMDYEING - Gave a good breakout of multiple patterns
~ Breakout of a 3T VCP Pattern
~ Trendline Breakout
~ Stock Looks good for both Swing and Positional Trades
Confluencetrading
Agrochemical stock pick before budgetSharda cropchem has been consolidating near strong demand zone of 400-420.
Stock has bounced from trendline which indicates confluence of support bounce
Stock can reverse before budget as chemical stocks have shown strength.
Low risk high reward trade. Stock has good fundamentals as well to hold for longer time horizon.
If you like my analysis, please like it and follow me for more such trading ideas.

SGX NIFTY- Anchored VWAP Detailed Analysis!Attached: SGXNIFTY Daily Live Market Chart as of 24th March 2023 (post 12:00 AM)
I am sharing this to bring to your attention the following points:
1. Price is currently consolidating below a Cluster of Anchored VWAPs (labelled on the chart). These same AVWAPs have acted as support in the past, see from where Price had rallied off in Oct 2022 for example
2. Price is also consolidating in the Lower Half of the Falling Trend Channel drawn from the Dec 2022 Highs
3. 16800 is the Make or Break Level using the Law of Polarity (labelled on the chart)
So when Price breaks⚠️ down these 3 Confluences, expect the 🐻Bear Market/ Bear Trend📉 to ACCELERATE 🩸!
And that will then Open the AVWAP Downside Targets🎯 as follows:
T1= 16400
T2= 15800
T3= 15300
Also these are the Very Same Downside Targets that I have been calling for when Nifty was trading at 18000 in the first week of Jan 2023.
In addition to all of this you would also notice my Elliot Wave marking for the B Wave false breakout to New Highs. We are in Wave C of a Bear Market presently.
Best,
Siddharth Bhansali

How to trade Parallel channel with trade example I daily make educational content videos on financial markets

Different Methods to Identify Perfect Entries with ConfluenceBasics of Trading and the areas of interest of every trader to have minimum knowledge to understand the market and its movement.
Volume Based Entries
Basics of Volume When the price is trending volume will be above volume moving average that will be considered as trend, when volume is too high in a session thats higher than 3x to volume moving average that will be considered as climax which means maximum orders are filled in the exsisting trend. Apart from stocks if such Climax pattern in volume in any format is seen then consider there might be a reversal soon. If one is trading in the stocks you get to see this ultra high volumes in gap ups and gap downs, now you will have to know what sort of gap it is to take entries which we will discuss in the Gaps later.
--------------------------------------------------------------------------------
Gaps
Gaps theory needs to be understood properly, over 4 kinds of Gaps are found in charts. Simple understanding follows :
Common Gaps : Normal gaps that happen every day with in a ranging market
Break Away Gaps : If a range/pattern/Support or Resistance is broken with a gap that is called break away gap. This sort of gap happens in the early stages of trend.
Running Gaps : After breakaway gaps rest of the gaps if happened towards the trend is called running gaps. as long as there is an exhaustion gap.
Exhaustion Gaps : This Exhaustion Gap happens either up or down after an up trend or the same in a down trend. These gaps gets filled giving an idea that the trend has ended.
Consolidation Areas
Consolidation areas or the trading ranges are to be considered as Support & Resistance areas to identify for patterns like Triangle, wedge, flag, pennant, or rectangle patterns. good areas to look for gap up or down and volume to identify breakout for the next move or plan for the next session.
Fib Extension & Retracements
Fibonacci extention and retracements is the basic knowledge that any trader who is willing to learn about technical analysis should be considering learning in depth, its a basic tool that gives you a lot of info, Basic knowledge to know is Fibbonacci Retracement is used to identify the entry and Extension is used to identify the exit. levels of interest are called the golden ratio i;e: 38%, 50%, 62% this is where majority of the reversals happen, these can be considered as Support & Resistance zones to look for breakout entries
Support & Resistance
Every traders nightmare is to understand or identify S&R in the initial days of your trading is not because you cannot ... it is because you are too curious, anxious, exited to enter into a trade, once you calm down and try to understand the market its not that hard to identify them ... S&R areas are the reversal zones or breakout zones it is going to be a big topic if tried to explain the whole concept so lets just stick to basics and use pivot high and low and FIB levels as your support and resistance zones for now.
Trendline Breakout
These are first thing that any trader learns try to master them, a perfect trendline is considered a strong support in uptrend or resistance in downtrend when it has respected this line for least 2 times from its start point. A breakout gives you and opportunity to enter in to a trade.
Elliott Wave
This is not considered as entry point in the initial stages of learning but one should know the basics of elliott wave to identify the trend we are in by looking at the leg we are in and you can calculate the trend by given wave length through fibonacci ratios. Only thing that you need to know is that market doesnt move in a straight line like you see in elliott wave picture above there will be waves with in waves.
Try to bring all these together as confluence to understand the market move and take entries.
Note : Train the eye to identify the structure, then comes the logic and explanation.

BULLISH on IRCTCNSE:IRCTC
The price, after the breakout from the channel pattern is regularly testing the Trendline and taking a support from it. Now the price is again testing the trendline, and also testing the confluence of the major moving averages. This is the reason I am very confident on this trade. This is a positional trade for upto 3 months. This Target levels are 758 and stoploss levels are 661.
Disclaimer :- This is my own view and analysis. This is for educational purposes. This is not a recommendation , call or a tip.

Siyaram Silk Double Head and shoulder - Asymmetric Triangle.NSE:SIYSIL
View : Bullish for Short -Medium - long term.
Observation:
Head and Shoulder Pattern Completion with neckline 456.00.
Breakout Level Necklne of Inverted Head and Shoulder : 446.00
After breakout level tested multiple time and this week the chart broken important trendline.
Green trendline will act as Support till 390.00
CMP 28 January 2022 (Friday) = 444.35
Buy : or > = 445 or As soon as Assymetric Trinagle (Pennant) Breakour Upside
Stop loss For long term : Not more than 4% (Not less than 396).
Target for short term : 455-460-480-490
Target for medium term : 455-480-500-560
Target for Long term : 456-500-600-626-650-698-750 ++++

Hindalco Rises Before Earnings ReportHindalco gives an opportunity for a long trade by numerous confluences
1. consolidatory break of the 200EMA
2. Break of Resistance zone
3. Favourable risk to reward ratio
4. High Volume
5. Upward channel support
Stop Loss below the recent consolidation low

Intraday Price Action Indicator - Multi TimeframeHi,
Success in the stock Market without good Tool and Guidance is Challengeable.
Here is the Indicator which is very user friendly and effective for intraday Trading. Please checkout the Signature tab and Join the link if you need this.
Details of the Indicator:
Method of Trading – Intraday, Positional or Swing – Indices, Stocks and Commodity Markets
Golden Zones : When two or more indicator levels are confluences at one price point which will act as Strong Support and Resistance in the Market. That is called Golden Zone.
CPR & Pivot (Daily / Weekly / Monthly) – Based on the previous Timeframe values, it will automatically calculates the Support and Resistance values for the upcoming Sessions.
BUY / SELL Levels (W-Refers the Weekly levels) – Possible Reversal in the market we can expect at this price level. Depends on the Time frame (Daily/Weekly)
Bull BO / Bear BO (W-Refers the Weekly levels) – Possible Breakout level, If breakout happens price will move to reach the Target 1 and 2 Points based on which side the price breaks ( BULLISH / BEARISH ). We can initiate our BUY/SELL Entries.
Target 1 & Target 2 – Once the Price breaks the Breakout (Bull BO / Bear BO) levels, it will try to reach the Target Points where we can book our profits.
Tomorrow Levels - This will help us to enable the next day trading session Support and Resistance Levels in advance to do pre-analysis to prepare for the Entry and Exits.
Colored Candles : Lime Green and Violet colored candles will indicate the Possible Trend Reversals.
Triangles : Orange and Violet triangles will indicate the Confirmation of Trend Reversal.
BUY / SELL Signal – Considering the momentum and the Trend change it will suggest the possible entry time.
Dashboard :
1. Weekly Trend : This will indicate how the current week trend is going to be – Trending / Sideways
2. Today – Current Session expectation in the Market ( Bullish / Bearish )
3. Sentiment – Indicates the Traders mind set (Positive/Negative Side)
4. Range - This will indicate how the current Day trend is going to be – Trending / Sideways
5. MB / MA Trend – This identifies the major trend (Is the Stock / script in Up Trend or Down Trend)
6. Other Parameters – Will indicates the present situation in the market
7. RSI Values – This is to know and understand the momentum of the particular script

Retest happening in confluence zoneeverything described in the chart clearly
Note:
Its just my point of view, Please recheck and enter the trade with proper risk management.

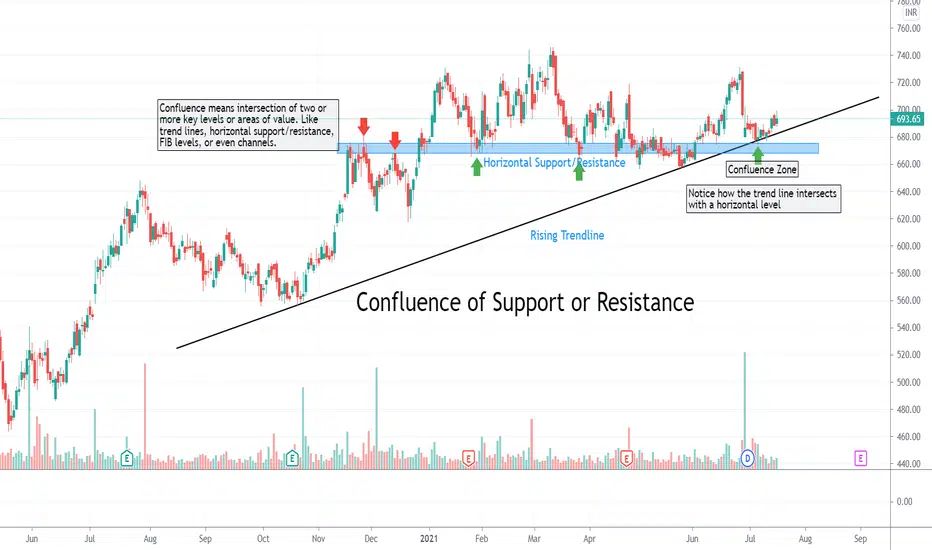
Area of ConfluenceConfluence occurs when multiple ideas or strategies are used together to form a single, coherent idea or strategy.
concept behind the above mentioned trade is
The horizontal support trader, trend line support trader and 50 Ema support traders will push the market up
When is the right time to enter the trade
We have to wait for the current minor trendline to break( minor trend line mentioned in the chart)
once the minor trendline is broken there is a high probability the price will go up
Note:
Its just my point of view, Please recheck and enter the trade with proper risk management.
Also I have attached the links of similar trades that I have taken based on this idea

HDFCAMC long opportunityNSE:HDFCAMC
Hello all!
HDFCAMC has been stuck in a triangle since Feb 2019. It has been consolidating ever since and has now finally broken the upper resistance trendline of the triangle.
This I believe is a good place to go long. I have three major reasons for that. The first being pure price action i.e. a breakout with good volumes. Second, the stock has support from the strong 50 week EMA. Also if you switch to the daily TimeFrame, there is support from the 200 EMA as well.
If you see closely, you can find that along with being stuck inside the triangle, it is also stuck in a channel. It is currently at the bottom of the channel and ready for a swing reversal. We can set the upper channel trendline as our target which will roughly be near the 3750 levels. Also, the Reward to Risk ratio is decent enough to go long!
With a triple confluence coupled with booming nifty, chances of this trade failing seem really bleak!!
Do let me know your views on this!!
*NOT A CALL*

HIGH PROBABILITY TRADEENTRY, STOPLOSS AND TARGET MENTIONED IN CHART
TRADE SET UP BASED ON:
1. CONFLUENCE TRADING
2. FALLING WEDGE
3. COMPANYS PROFIT IS IMPROVING OVER YERS AND DIVIDEND ISSUED TO THE SHARE HOLDERS IS ALSO INCREASING
Net Profit Mar 2019 (248Cr) Mar 2020 (404Cr) Mar 2021 (458Cr)
Dividend Payout % Mar 2019 (4%) Mar 2020 (6%) Mar 2021 (10%)
Note:
Its just my point of view, Please recheck and enter the trade with proper risk management.

swing trade or confluence tradingEntry stop loss and target mentioned in the chart
Trading idea based on:
Ascending parallel channel
Simple minor downward trendline breakout
Technical concept:
Confluence trading
Note:
Its just my point of view, Please recheck and enter the trade with proper risk management.

Why I am bullish on Airtel - Macro trend analysisThis is a long-term analysis for the telecommunications giant - Bharti Airtel .
There are two primary market trends in the broad perspective :
1. Uptrend/downtrend
2. Accumulation/ Distribution.
The accumulation phase is the boring phase , when smart investors accumulate positions and get in early. the uptrend/mark-up phase is the euphoria phase when the retail market participation increases, indicated by surge in volume, and smart investors slowly start unloading their positions, until the uptrend momentum has subsided, followed by a new accumulation phase and another possible mark-up, or a distribution phase followed by a downtrend, which is also known as a bear market. Till the time price has moved away from the range it has been trading in, we do not know whether the range is accumulative or distributive in nature.
As you can see in the chart, Bharti Airtel has been in an accumulation range for more than 10 years, and it seems as though we have finally successfully managed to break away from the range to the upside. The longer a stock has been in accumulation, the stronger the momentum once price breaks away from the range.
Let us see a stock that has done something similar. It is none other than, Reliance Industries .
You can clearly see how quickly the trend progressed after leaving the accumulation range.
Key takeaway points from the analysis and comparison
1. Airtel has been range bound for a longer period of time as compared to Reliance. This implies that Airtel has spent more time in the accumulation phase.
2. Airtel broke out of the range in early 2020, but threatened to fall back into the range, only to deviate back above and hold the range-high as support for several months. Deviation and reclaim as support is considered a strong bullish sign, indicating that buyers are stepping in to defend the range high as support.
3. Reliance never back-tested its range high as support before its second mark-up phase. Airtel back-testing range high as support is giving buyers more confidence that the stock is ready for price-discovery mode.
4. Volume analysis - Airtel has a better volume profile, with depleting low volume during accumulation phase and a surge in volume upon breakout attempt, and is showing continued volume strength. This setup was not seen in Reliance.
Conclusion
With this we can conclude that Airtel is giving us a nice bullish setup for a long term trend change shift and tackling new all time highs. The Indian stock market has been in a bull run ever since the year 2000, with corrections along the way (two major corrections in 2008 and 2020). As long as this macro bullish structure of the Indian market continues, we can expect Bharti Airtel to perform strongly in the coming years and have a similar run up as compared to Reliance Industries.
Thank you. Do leave a like/comment if you enjoyed the analysis.
Note: This is not financial advise. It is for educational/entertainment purposes only

multi time frame analysis of( 1 week, 1 day, 1hour chart) multi time frame analysis of( 1 week, 1 day, 1hour chart) and entry based on (1hour ) chart

How to think like a trader and gain 8% in BPCLFollow me on trading view : in.tradingview.com
This is a series where we discuss stocks recommended by you guys: Just comment on the fav stock you want analysis on or DM me ;)
👑 Terms used if you don't know :
✣ Contraction pattern: A pattern starting with a broadening high candlestick and low candlestick and converging to a fixed point, these highs and lows created in between them are bulls vs bears fight going on inside the pattern and if it comes to the lower part of it, surely bulls will take it to the topmost point and vice-versa until one of them wins
✣ Structure and trend: Two types of trends that exist in the market today are uptrends and downtrends. Each type of trend tells a different story and has its own impact on a trader's success in the market. While uptrends show a series of higher highs and higher lows, downtrends show lower highs and lower lows
✣Breakout: Breakouts are commonly associated with ranges or other chart patterns, including triangles( HERE WE WILL SEE THIS ONE ), flags, wedges , and head-and-shoulders. These patterns are formed when the price moves in a specific way which results in well-defined support and/or resistance levels. Traders then watch these levels for breakouts
✣ RSI DIVERGENCE: A bullish divergence occurs when the RSI creates an oversold reading followed by a higher low that matches correspondingly lower lows in the price. This indicates rising bullish momentum, and a break above oversold territory could be used to trigger a new long position.
✣ Supply/ Demand: In the supply zone , the prices are higher than the bid price, and in the demand zone , they are lower. The bid price is what a trader is willing to pay for a stock
👑 Important levels - explained well
👑 Comment your thoughts and queries regarding anything on this analysis of mine, feel free buddy :)
⌛ Motivational and psychological area ⌛
✣Trade only if you are in the right mindset, if you have been emotionally weak for some time, take your time and don't trade, trade with a happy and + mindset only.
✣If you want to make money, firstly be prepared to lose it, only that much which you can afford and that much by which you can make a mistake again, learn from them and grow
✣Don't lose hope and keep grinding
✣I have seen my friends on youtube streaming games with watching 10, constantly they streamed for a year or two and now they are buzzing with 1k to 2k watching daily.
✣Focus on the process, you are here to make money not stupid decisions and lose it all
✣No one will help you climb the mountain, few will tell the path, so follow good people, make good mentors and make good decisions and choices in the stock market.
✣Believe in yourself :)
🎓🎓 Some info about me :)
➼My name is Apoorv and I am a 2nd year Engineering student, I want to pursue trading as my career, and thus whatsoever setups or trades I potentially see on my charting platform, I post it here and share them with you all.
➼I hope you will love my simple analysis style.
➼Feel free to suggest your view on this as learning is earning here :)
➼I take my trades on my Zerodha account :)
➼I don't take all the trades I post
➼These charts are my and only my work, my thought process, just from an educational point of view and no calls.

Confluence of Support or ResistanceA confluence of support or resistance is simply an intersection of two or more important levels. Market participants prefer to trade around a zone that involves two or more factors rather than a zone with just one. The probability of winning is higher around confluence zones.

XAUUSD, could be retracement week for GoldGold against Dollar may give some rest for bulls, for last few weeks this pair have been aggressively bullish, but 1840 area which is very crucial zone for this pair may have some retracement before the price goes up towards 1920 area in the coming month ..
Analysis only for education purpose

EURJPY Long IdeaHeya! all here is my bias for EJ, as I shared before (already link the my idea down there) now I'm looking for longs.

XAUUSD , weekly analysis, Nov 19 - 13Hi traders,
Gold against US Dollar weekly analysis, post election first week analysis shows a bullish view like last week also , this pair looking to go high may be till 1975 - 1980 mark this week, but first few days of the week may see a down side almost it has a chance to touch 1925-1930 price range, then it has all the chance to go up against weaker dollar in the coming days, I hope this may continue to overall November
