Consolidationzone
Kolte Patil getting ready for big moveKolte Patil after similar consolidation as past ready for big movement. Earlier supply zone is now tested and acting as support now.
RR is very favorable from here.
Disclaimer : This study is for educational purpose only & is not buying or selling recommendations. I am not SEBI registered. Please consult your financial advisor before taking any trade.
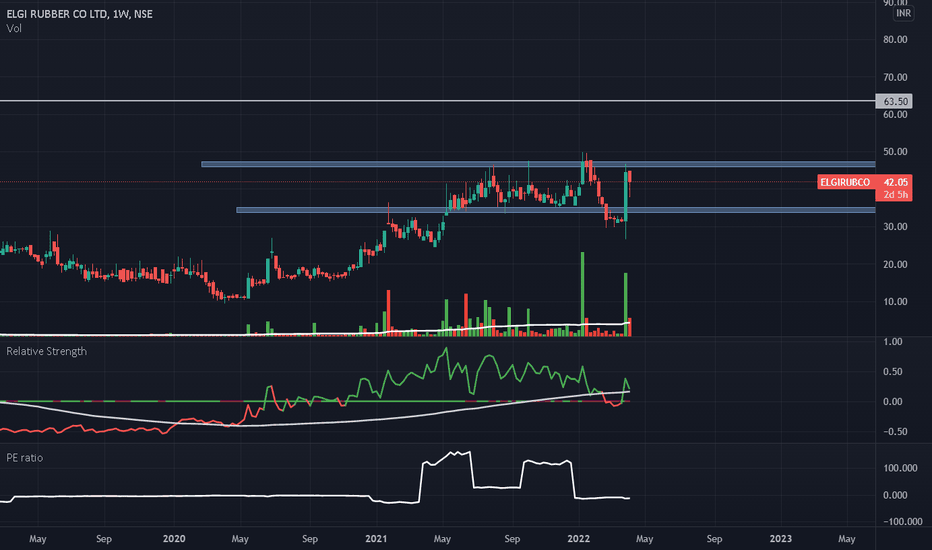
Analysis Request: Elgi Rubber@sajid11 :
Hi man,
I'm doing great. Due to a change in the Tradingview policies, I'm unable to send private messages without sufficient 'reputation points'. (So if you find this analysis, then kindly like & show some reputation likes on my profile) :D
Jumping to stock analysis(Technical):
It is currently captured in a range-bound space. thus if you're a movement chaser, then consider buying it above 50 with a decisive weekly close.
Else, for Long term investing current range of accumulation is (35.5 to 37.5).
Either way, the Target 1 could be 63.5. But it can safely move beyond 70.
(Fundamental trivia):
Rubber is highly dependent on global demand, with production concentrated in South Asian countries. Hence, high covid lockdown in China + Most anticipated Capex cycle of India will be beneficial for this stock in the next 6months to 1 year.
P.S.: This is my point of view, kindly take a buy/sell decision based on your risk capacity. Also, not a Financial advisor.
Lastly, Help others to grow together! :)
Saregama - An Investment OpportunitySaregama is under the long consolidation zone. Breakout can be observed in the stock above R2 (Mentioned in the Chart ).
Time to invest in a fundamentally good company.
Disclaimer- This is not a piece of investment advice. Please do consult your financial advisor before investing
SWING TRADE - NATCO PHARMA LTD- R:R @ 1:2Potential Opportunity as Swing Trade in NSE:NATCOPHARM
Risk : Reward - 1:2
ENTRY - 928.00
TARGET - 1006.00
STOP LOSS - 889.00
This is for Educational Purpose only, apply your prudence & consult your adviser before any investing.
HAPPY TRADING.....
#nse #swingtrade #nifty #natcopharma #nifty50 # #priceaction #consolidationzone #trendline #re-test # retracement #bullish #riskrewardratio
SHARDA CROPCHEM DAILY CHART ANALYSIS AS ON 26.12.2021SHARDA CROPCHEM as per daily chart analysis is in brief consolidation zone and on 24.12.2021 it had tried to break consolidation. Stock above 345 level for a target 355 level and resistance at 359 level. Nifty monthly chart forming indecisive doji , weekly chart forming bullish candle and daily chart forming a bearish candle shows this week may continue to be bearish being year end and monthly expiry in next 5 sessions.Investors may continue to book profits.Avoid fresh long positions. Nifty Support is placed at 16890 / 16837 / 16785 / 16693. Resistance is placed at 17152 / 17214 / 17378.
DFM FOODS DAILY CHART ANALYSIS AS ON 22.12.2021DFM FOODS is in brief consolidation and above 300 for a target 315 level. Happy Trading to all. Tomorrow Market will be bullish.
INDO COUNT INDUSTRIES DAILY CHART ANALYSIS 19.12.21INDO COUNT INDUSTRIES as per daily chart analysis is in a brief consolidation zone and stock above 267 level for a target 272. Do note nifty50 tomorrow will fall initial hours and it should take support either at 16891 or 16791 for it bounce back. So buy only after the reversal.


