Managing Losses and Drawdowns1. Understanding Losses and Drawdowns
Before discussing management strategies, it’s essential to understand what losses and drawdowns mean in trading and investing.
Losses refer to the decline in the value of a trade or investment. A loss occurs when the market moves against your position and the value of your holdings decreases below the entry point.
Drawdown represents the peak-to-trough decline in a trader’s capital over a given period. It is expressed as a percentage of the account balance and measures how much equity has fallen from its highest point before a recovery.
2. Importance of Managing Losses and Drawdowns
Effective loss and drawdown management ensures:
Capital Preservation: Without capital, trading cannot continue. The primary goal of every trader should be survival.
Psychological Stability: Large losses can cause emotional distress, leading to revenge trading and poor decisions.
Consistency: Controlling losses allows consistent performance and long-term profitability.
Compounding Potential: Small losses are easier to recover from, allowing traders to benefit from the power of compounding.
For example, a 10% loss requires an 11% gain to recover, but a 50% loss requires a 100% gain. Therefore, controlling drawdowns is essential to prevent deep equity declines that are hard to reverse.
3. Setting Stop-Losses and Risk Limits
A stop-loss is a pre-determined price level where a trader exits a losing position to prevent further loss. It is one of the most effective tools for managing risk.
Fixed Stop-Loss: A specific rupee or percentage-based limit (e.g., 2% of capital per trade).
Volatility-Based Stop-Loss: Set according to market volatility, using indicators like ATR (Average True Range).
Trailing Stop-Loss: Adjusts automatically as the trade moves in favor of the trader, locking in profits while limiting downside.
Most professional traders follow the 1–2% rule, meaning they never risk more than 1–2% of total trading capital on a single trade. This prevents any single loss from significantly impacting their portfolio.
4. Position Sizing and Diversification
Position sizing determines how much capital to allocate to each trade. Incorrect position sizing is one of the primary reasons for major drawdowns.
Small Positions Reduce Risk: Smaller position sizes help absorb losses without damaging overall equity.
Diversification: Spreading capital across uncorrelated assets or strategies reduces portfolio volatility. For example, investing in stocks, bonds, and commodities ensures that a loss in one market might be offset by gains in another.
Portfolio managers often use the Kelly Criterion or Value at Risk (VaR) models to optimize position sizes without exceeding risk tolerance.
5. Risk-Reward Ratio and Trade Selection
Before entering a trade, a trader must assess the risk-to-reward ratio (RRR)—the potential profit compared to the potential loss.
A common guideline is to maintain a minimum 1:2 ratio, meaning the expected profit should be at least twice the potential loss.
Selecting trades with favorable risk-reward setups ensures that even with a lower win rate, a trader can remain profitable over time.
For example, if a trader wins 4 out of 10 trades but each winning trade earns ₹2,000 and each losing trade loses ₹1,000, the net result is still positive.
6. Emotional and Psychological Control
Managing losses is not purely a mathematical exercise; it’s also psychological. Emotional discipline plays a crucial role in how traders handle drawdowns.
Avoid Revenge Trading: Trying to recover losses quickly often leads to larger losses.
Accepting Losses as Normal: Every trading strategy has losing trades. Accepting this helps maintain rational thinking.
Sticking to a Trading Plan: Following predefined entry, exit, and risk rules prevents impulsive behavior.
Regular Breaks: During losing streaks, stepping away from markets helps regain focus and prevent emotional trading.
Professional traders often use journals to record trades, emotions, and outcomes to improve self-awareness and consistency.
7. Using Hedging and Defensive Strategies
Hedging is a technique used to reduce risk exposure by taking offsetting positions.
Options Hedging: Traders can use put options to protect long stock positions or call options to hedge short positions.
Pair Trading: Taking opposite positions in correlated assets (e.g., long Reliance Industries and short ONGC) can reduce overall risk.
Stop-Loss Hedging: Some traders use inverse ETFs or futures contracts to hedge market downturns.
These techniques help reduce drawdowns during periods of market volatility or uncertainty.
8. Monitoring Performance and Adjusting Strategy
Continuous performance monitoring helps detect when a strategy is underperforming.
Max Drawdown Analysis: Comparing current drawdowns to historical averages reveals whether current losses are within expected limits.
Equity Curve Tracking: Observing the slope and volatility of the equity curve helps identify when to scale up or down.
Periodic Review: Adjusting strategy parameters based on changing market conditions ensures ongoing effectiveness.
When drawdowns exceed acceptable levels, it may be time to pause trading, reassess strategy, or backtest modifications.
9. Capital Allocation and Recovery Planning
Recovery from losses requires strategic capital allocation.
Traders should:
Preserve Core Capital: Keep a portion of funds untouched for future trading after a drawdown.
Reduce Position Sizes: During recovery, use smaller trade sizes to rebuild confidence and equity.
Reinvest Gradually: As performance improves, gradually scale back to normal risk levels.
Avoid Over-Leverage: Excessive leverage accelerates losses; maintaining moderate leverage ensures sustainability.
Remember, the goal during recovery is consistency, not speed. Small, steady gains rebuild equity more safely than aggressive trading.
10. Practical Example of Drawdown Management
Suppose a trader with ₹10,00,000 faces a 20% drawdown, bringing the balance to ₹8,00,000. To recover, they need a 25% return. Instead of doubling risk to chase recovery, the trader should:
Analyze the causes of the drawdown (market conditions, poor discipline, or strategy flaw).
Cut trade size by 50% and resume trading with lower risk.
Apply stricter stop-loss and higher-quality setups.
Monitor progress weekly and avoid trading out of frustration.
Over time, disciplined management helps restore both capital and confidence.
11. The Role of Technology and Automation
Modern trading platforms and algorithms enhance risk control through:
Automated Stop-Loss Orders: Prevent emotional override.
Risk Dashboards: Display real-time exposure and drawdowns.
Algorithmic Execution: Reduces human error and enforces rules-based trading.
These tools make it easier to implement consistent risk management practices.
12. Conclusion
Managing losses and drawdowns is a vital component of long-term success in trading and investing. Every market participant will experience losses—what matters is how those losses are handled. By setting proper stop-losses, controlling position sizes, diversifying portfolios, maintaining emotional discipline, and using technological tools, traders can limit damage during downturns and position themselves for future growth.
The most successful traders are not those who never lose but those who survive and thrive despite losses. Effective drawdown management transforms temporary setbacks into valuable learning experiences, ensuring steady progress toward consistent profitability and financial resilience.
Contains image
Part 2 Identifying Support and ResistanceRisks in Option Trading
While options offer flexibility, they also come with inherent risks:
Time Decay: Option value erodes as expiry nears, especially for buyers.
High Volatility: Sudden volatility spikes can cause unpredictable price swings.
Leverage Risk: Small movements in the underlying can lead to large gains or losses.
Unlimited Loss Potential for Sellers: Option writers face potentially large losses, especially with uncovered (naked) positions.
Liquidity Risk: Some stock options may have wide bid-ask spreads, making entry and exit difficult.
Proper risk management, position sizing, and stop-loss mechanisms are essential for long-term success.

Multi-Timeframe Analysis (Intraday, Swing, Positional)1. Understanding Multi-Timeframe Analysis
Multi-Timeframe Analysis refers to the process of observing the same security across different timeframes to identify trend alignment, potential reversal zones, and optimal trading opportunities. Every timeframe provides unique insights:
Higher Timeframe: Defines the major trend and key support/resistance zones.
Intermediate Timeframe: Helps identify swing trends within the larger move.
Lower Timeframe: Provides precise entry and exit signals.
For example, a trader analyzing Nifty 50 might observe:
Daily Chart (Positional) for the overall trend direction.
Hourly Chart (Swing) for intermediate momentum.
15-Minute Chart (Intraday) for entry confirmation.
This top-down approach ensures that trades are placed in harmony with the broader market movement rather than against it.
2. The Logic Behind Multi-Timeframe Analysis
Financial markets are fractal in nature, meaning patterns repeat on various time scales. A breakout on a 5-minute chart might just be a retracement on a 1-hour chart, while a downtrend on a daily chart could appear as a bullish trend on a 15-minute chart.
MTA helps traders:
Identify dominant trends (macro view).
Spot short-term countertrends (micro adjustments).
Time entries with high probability setups.
Essentially, it synchronizes multiple layers of information to produce well-informed trading decisions.
3. Types of Traders and Timeframes
Each trader category operates within different time horizons:
A. Intraday Traders
Objective: Capture small price moves within a single trading day.
Timeframes Used: 1-minute, 5-minute, 15-minute, and 1-hour charts.
Holding Period: A few minutes to several hours.
Example: A trader identifies a bullish breakout on the 15-minute chart, confirms strength on the 5-minute chart, and exits before the market close.
B. Swing Traders
Objective: Ride short to medium-term trends lasting several days or weeks.
Timeframes Used: 1-hour, 4-hour, and daily charts.
Holding Period: 2 to 15 days typically.
Example: A bullish pattern on the daily chart confirmed by a 4-hour breakout helps the trader capture a multi-day price rally.
C. Positional Traders
Objective: Trade major trends that can last from weeks to months.
Timeframes Used: Daily, weekly, and monthly charts.
Holding Period: Several weeks to many months.
Example: A trader identifies a long-term uptrend on the weekly chart and holds positions through short-term fluctuations.
Each trader uses MTA to align smaller trends within the context of larger ones.
4. The Top-Down Approach
The Top-Down Approach is a systematic method of conducting multi-timeframe analysis. It involves starting with the highest relevant timeframe and drilling down to lower timeframes for precision.
Step 1: Identify the Major Trend (Higher Timeframe)
Use weekly or daily charts to determine the broader market direction.
Apply moving averages, trendlines, or price structure (higher highs and higher lows).
Example: On the weekly chart, Nifty 50 is in an uptrend.
Step 2: Confirm Momentum (Intermediate Timeframe)
Switch to a 4-hour or 1-hour chart to check if the momentum supports the higher timeframe trend.
Look for consolidation, breakouts, or pullbacks.
Step 3: Refine Entry and Exit (Lower Timeframe)
Use 15-minute or 5-minute charts to time entries and exits.
Identify short-term support, resistance, and candlestick patterns for precision.
This method ensures alignment between long-term direction and short-term trade execution, minimizing false signals and improving accuracy.
5. Example of Multi-Timeframe Analysis in Action
Let’s illustrate with an example:
Weekly Chart (Positional View): Shows a strong uptrend with price above 50-day moving average.
Daily Chart (Swing View): Reveals a bullish flag pattern forming after a rally.
Hourly Chart (Intraday View): Displays a breakout above the flag resistance with volume confirmation.
A positional trader may initiate a long position based on weekly strength, while a swing trader enters after the daily flag breakout. An intraday trader could use the hourly chart to time the exact breakout candle entry.
All three traders align their strategies to the same trend but operate on different time horizons.
6. Tools and Indicators Used in Multi-Timeframe Analysis
Several tools enhance the effectiveness of MTA:
Moving Averages (MA): Identify trend direction and alignment across timeframes (e.g., 20 EMA, 50 SMA).
Relative Strength Index (RSI): Helps confirm momentum consistency.
MACD: Detects shifts in momentum and crossovers aligning with major trends.
Support and Resistance Levels: Define crucial zones visible across charts.
Trendlines and Channels: Show structure of price swings.
Candlestick Patterns: Confirm entry signals on smaller timeframes.
Combining these tools across multiple frames builds confluence—an essential component of successful trading.
7. Advantages of Multi-Timeframe Analysis
Trend Confirmation:
Confirms whether short-term movements align with the long-term trend, improving accuracy.
Reduced False Signals:
Helps filter noise from smaller charts that may mislead traders.
Enhanced Entry Timing:
Allows traders to enter trades at precise moments when all timeframes agree.
Better Risk Management:
By aligning with larger trends, traders can define stop-loss and target levels more logically.
Adaptability Across Strategies:
Suitable for scalping, swing trading, or long-term investing.
8. Challenges in Multi-Timeframe Analysis
While MTA is powerful, it also presents certain difficulties:
Information Overload: Analyzing multiple charts can cause confusion or analysis paralysis.
Conflicting Signals: Short-term and long-term charts may show opposite trends, requiring trader judgment.
Execution Complexity: Managing entries and exits across multiple timeframes demands discipline and experience.
Emotional Bias: Traders may get biased by one timeframe and ignore contradictory evidence.
Therefore, consistency in analysis and clear trading rules are vital to prevent confusion.
9. Tips for Effective Multi-Timeframe Trading
Always start with higher timeframes before moving down.
Use a ratio of 1:4 or 1:6 between timeframes (e.g., daily → 4-hour → 1-hour).
Focus on key support/resistance levels visible across multiple frames.
Avoid overcomplicating; two or three timeframes are usually enough.
Maintain a trading journal to note observations from each timeframe.
Use alerts or automated tools to monitor price behavior when multiple charts are involved.
10. Conclusion
Multi-Timeframe Analysis is not just a technique but a strategic framework that enhances decision-making across trading styles—whether intraday, swing, or positional. By combining insights from different timeframes, traders gain a holistic view of the market, identify high-probability setups, and reduce the risk of false entries.
For intraday traders, MTA refines timing; for swing traders, it offers trend confirmation; and for positional traders, it ensures long-term alignment. When executed with discipline, proper analysis, and risk control, Multi-Timeframe Analysis becomes one of the most reliable methods to trade profitably in volatile markets like India’s NSE and BSE.
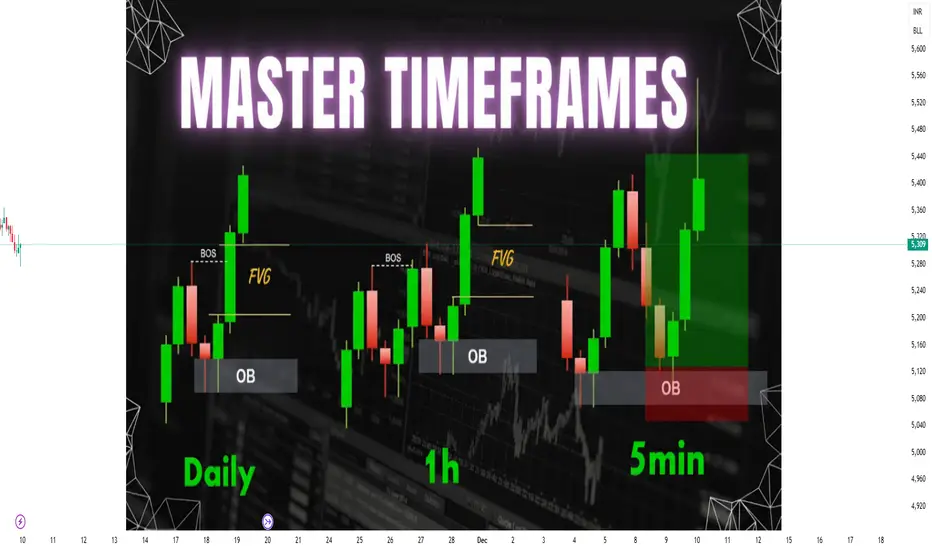
Chart Patterns Risks Involved
Time Decay: Option value decreases as expiry nears.
Volatility Risk: Rapid volatility changes can affect premiums.
Unlimited Loss for Writers: Option sellers face theoretically unlimited loss potential.
Complexity: Requires strong understanding of pricing and market movement.

Interest Rates Explained: Definition, Types and DeterminantsDefinition of Interest Rates
An interest rate is the cost of borrowing money or the reward for saving it, expressed as a percentage of the principal amount per period, typically per year. When you borrow money, you pay interest; when you lend or deposit money, you earn interest. Essentially, it represents the “price” of money — how much it costs to use someone else’s funds for a specific time.
For example, if you borrow ₹100,000 at an annual interest rate of 10%, you owe ₹10,000 as interest after one year. Conversely, if you deposit ₹100,000 in a bank account offering 6% interest, you earn ₹6,000 in a year.
Types of Interest Rates
Interest rates can be classified into several types depending on the context and application.
1. Nominal and Real Interest Rates
Nominal interest rate is the rate stated on financial instruments or loans without adjusting for inflation.
Real interest rate is the nominal rate minus the inflation rate.
Real Interest Rate = Nominal Rate − Inflation Rate
For example, if a bank offers 8% nominal interest and inflation is 5%, the real interest rate is 3%. Real rates reflect the true earning or cost of money in terms of purchasing power.
2. Fixed and Floating (Variable) Interest Rates
Fixed rate remains constant throughout the loan or investment term. This offers stability and predictability.
Floating or variable rate changes over time, often linked to a benchmark such as the repo rate or LIBOR (London Interbank Offered Rate). These rates fluctuate with market conditions.
3. Simple and Compound Interest
Simple interest is calculated only on the principal amount.
Simple Interest
=
𝑃
×
𝑅
×
𝑇
/
100
Simple Interest=P×R×T/100
Compound interest is calculated on both the principal and accumulated interest. It grows faster because of the compounding effect — interest on interest.
4. Short-term and Long-term Interest Rates
Short-term rates apply to loans or deposits with a maturity of less than a year.
Long-term rates apply to financial instruments with longer maturities, such as bonds or mortgages.
Determinants of Interest Rates
Interest rates are influenced by a combination of macroeconomic factors, government policies, and market dynamics. The key determinants include:
1. Central Bank Policy
The central bank (e.g., the Reserve Bank of India, or RBI) plays a crucial role in setting benchmark rates. In India, the repo rate — the rate at which banks borrow from the RBI — serves as the primary policy rate. When the repo rate rises, borrowing becomes more expensive, reducing liquidity and controlling inflation. Conversely, a lower repo rate stimulates borrowing and investment.
2. Inflation
Inflation has a direct relationship with interest rates. Higher inflation erodes the purchasing power of money, prompting central banks to raise rates to curb excessive spending. On the other hand, when inflation is low, rates are reduced to encourage consumption and investment.
3. Demand and Supply of Credit
When businesses and consumers demand more loans, the demand for credit rises, pushing interest rates up. If the supply of funds in the banking system is high, interest rates tend to fall.
4. Economic Growth
In a growing economy, investment opportunities expand, and demand for capital increases, often leading to higher rates. During recessions, central banks lower rates to revive growth.
5. Government Borrowing
When a government borrows heavily through bonds, it can increase the overall demand for credit, leading to higher interest rates, especially if private savings are limited.
6. Global Factors
Global interest rate trends, especially in major economies like the United States, influence domestic rates. For instance, if U.S. rates rise, investors might shift funds from emerging markets, prompting those countries to raise rates to retain capital.
Role of Interest Rates in the Economy
Interest rates act as a powerful lever of economic control, influencing spending, investment, inflation, and exchange rates. Their effects can be seen in several areas:
1. Consumption and Savings
High interest rates encourage people to save more and borrow less because the cost of loans increases and returns on savings rise. Low rates have the opposite effect — borrowing becomes cheaper, boosting consumption.
2. Business Investment
Companies often finance expansion through borrowed funds. When rates are low, borrowing costs decrease, encouraging investment in new projects, machinery, or technology. Higher rates discourage borrowing and can slow corporate growth.
3. Inflation Control
Central banks use interest rates to manage inflation. Raising rates helps reduce money circulation, cooling demand and lowering inflationary pressure. Lowering rates increases liquidity, stimulating spending when inflation is low.
4. Employment and Growth
When interest rates are low, investment rises, production expands, and employment increases. Conversely, high interest rates can slow down business activities, leading to reduced hiring and slower economic growth.
5. Exchange Rates and Foreign Investment
Higher interest rates attract foreign capital as investors seek better returns, strengthening the domestic currency. Lower rates can lead to currency depreciation but may boost exports by making goods cheaper abroad.
Interest Rates and Financial Markets
Interest rates have a profound impact on stock, bond, and real estate markets.
1. Bond Market
Bond prices and interest rates move inversely. When interest rates rise, existing bonds with lower yields become less attractive, causing their prices to fall. Conversely, when rates fall, bond prices rise.
2. Stock Market
Low interest rates usually lead to higher stock prices as companies benefit from cheaper financing and investors shift funds from low-yield savings to equities. High rates can depress stock prices due to higher borrowing costs and reduced profit margins.
3. Real Estate
Interest rates directly affect mortgage rates. Lower rates make housing loans cheaper, boosting demand for property. Rising rates, however, reduce affordability and slow down real estate growth.
Interest Rates and Personal Finance
For individuals, interest rates influence nearly every financial decision:
Loans and EMIs: Higher rates mean larger monthly payments for home, car, or education loans.
Savings and Investments: When rates are high, fixed deposits and bonds become more rewarding.
Credit Cards: Variable interest rates on credit cards can increase financial burden when rates rise.
Understanding interest rates helps individuals plan better, manage debt effectively, and optimize investment returns.
Recent Trends in Interest Rates
In recent years, global interest rates have fluctuated sharply due to economic disruptions like the COVID-19 pandemic, inflationary pressures, and central bank interventions. Many central banks, including the U.S. Federal Reserve and the RBI, initially cut rates to stimulate growth but later increased them to control rising inflation. The balancing act between growth and price stability continues to define interest rate trends worldwide.
Conclusion
Interest rates are much more than a number quoted by banks — they are a critical economic signal that affects every aspect of financial life. They determine the cost of credit, influence investment behavior, and serve as a tool for managing inflation and growth. Understanding how interest rates work enables individuals, businesses, and policymakers to make informed financial and economic decisions. In essence, interest rates reflect the heartbeat of an economy — when they change, the entire economic system responds.
Part 1 Understanding the Structure of a CandlestickHow Option Trading Works
Option trading involves two parties:
Buyer (Holder): Pays a premium to acquire the right to exercise the option.
Seller (Writer): Receives the premium and is obligated to fulfill the contract if the buyer exercises the option.
Unlike stock trading, where the ownership of shares is exchanged, options trading revolves around rights and obligations. The buyer’s risk is limited to the premium paid, while the seller’s risk can be unlimited (especially in naked option writing).

Premium Charts Tips for Successful Option Trading
Master the basics before applying advanced strategies.
Analyze market trends, OI data, and IV regularly.
Use proper risk management—never risk more than 1–2% of capital per trade.
Avoid trading near major events (earnings, RBI policy) unless experienced.
Keep learning through backtesting and continuous strategy refinement.

Part 11 Trading Masster ClassRole of Implied Volatility (IV) and Open Interest (OI)
Implied Volatility (IV): Indicates expected market volatility. Rising IV increases option premiums. Traders buy options during low IV and sell during high IV.
Open Interest (OI): Reflects the number of outstanding option contracts. Rising OI with price indicates strong trend confirmation, while divergence signals reversals.
These metrics help traders assess market sentiment and build informed positions.

Advanced Chart Patterns in Technical Analysis1. Introduction to Advanced Chart Patterns
In trading, patterns repeat because human behavior is repetitive. Fear, greed, and hope drive market movements, and these emotions get imprinted in price charts. Advanced chart patterns are an extension of classical technical formations, combining structure, volume, and momentum to forecast price trends. Mastering them helps traders differentiate between false breakouts and genuine opportunities.
Advanced patterns generally fall into two main categories:
Continuation Patterns – Indicating a pause before the prevailing trend continues.
Reversal Patterns – Signaling the end of a trend and the beginning of a new one.
2. Head and Shoulders (Reversal Pattern)
The Head and Shoulders pattern is one of the most reliable reversal signals. It indicates a change in trend direction — from bullish to bearish (standard form) or from bearish to bullish (inverse form).
Structure:
Left shoulder: A price rise followed by a decline.
Head: A higher peak than the left shoulder, followed by another decline.
Right shoulder: A lower rise, followed by a breakdown through the neckline.
Neckline: Connects the lows between the shoulders and serves as a key breakout level.
Once the price breaks below the neckline, it confirms a bearish reversal. The target is estimated by measuring the distance from the head to the neckline and projecting it downward.
Inverse Head and Shoulders works similarly but in the opposite direction — signaling a bullish reversal after a downtrend.
3. Cup and Handle Pattern
The Cup and Handle is a bullish continuation pattern resembling a teacup. It was popularized by William O’Neil in his book How to Make Money in Stocks.
Formation:
Cup: A rounded bottom, showing a gradual shift from selling to buying.
Handle: A short pullback or consolidation that follows the cup, forming a downward-sloping channel.
When the price breaks above the handle’s resistance with strong volume, it often signals a continuation of the prior uptrend.
Target: The depth of the cup added to the breakout point.
This pattern is often seen in growth stocks and long-term bullish markets.
4. Double Top and Double Bottom
These patterns are classic but essential to advanced technical traders due to their reliability and frequency.
Double Top:
Appears after a strong uptrend.
Price makes two peaks at similar levels separated by a moderate decline.
A breakdown below the “neckline” confirms a bearish reversal.
Double Bottom:
Appears after a downtrend.
Two troughs form around the same level with a peak in between.
A breakout above the neckline signals a bullish reversal.
Volume confirmation is crucial — rising volume on the breakout adds credibility to the pattern.
5. Flag and Pennant Patterns
Flags and Pennants are short-term continuation patterns that often appear after a strong price movement, known as the “flagpole.”
Flag: Forms as a small rectangular channel sloping against the main trend.
Pennant: Appears as a small symmetrical triangle following a sharp move.
These patterns typically consolidate the market before the next strong move in the same direction.
Breakout Rule:
When price breaks in the direction of the previous trend, accompanied by high volume, it confirms continuation.
Target Projection:
Length of the flagpole added to the breakout point.
6. Wedge Patterns
Wedges are advanced chart patterns signaling either continuation or reversal depending on their position and direction.
Rising Wedge:
Forms when price makes higher highs and higher lows, but the slope narrows upward.
Typically appears in an uptrend and indicates weakening bullish momentum — a bearish reversal signal.
Falling Wedge:
Forms with lower highs and lower lows converging downward.
Usually appears in a downtrend, indicating a potential bullish reversal.
Volume generally declines during formation and expands during breakout, confirming the move.
7. Symmetrical, Ascending, and Descending Triangles
Triangles represent consolidation phases and serve as reliable continuation patterns.
Symmetrical Triangle:
Characterized by converging trendlines with no clear direction bias.
Breakout direction typically follows the prior trend.
Ascending Triangle:
Horizontal resistance with rising support.
Usually forms during an uptrend, signaling bullish continuation.
Descending Triangle:
Horizontal support with declining resistance.
Typically bearish, indicating continuation of a downtrend.
Triangles are volume-sensitive patterns — declining volume during formation and surge during breakout strengthens reliability.
8. Rectangle Pattern
A Rectangle or Trading Range represents a period of indecision between buyers and sellers.
Formation: Price oscillates between horizontal support and resistance.
Interpretation:
Breakout above resistance → bullish signal.
Breakdown below support → bearish signal.
Traders often trade within the rectangle until a confirmed breakout occurs, using stop-losses near the opposite boundary.
9. Diamond Pattern
The Diamond Top is an advanced reversal pattern that forms after a prolonged uptrend. It begins as a broadening formation (wider price swings) and ends with a narrowing triangle — resembling a diamond shape.
Indicates distribution and market exhaustion.
Once price breaks below the support line, it confirms a bearish reversal.
This pattern is rare but highly reliable when spotted correctly.
10. Harmonic Patterns (Advanced Category)
Harmonic patterns use Fibonacci ratios to predict potential reversals with high precision. These include Gartley, Bat, Butterfly, and Crab patterns.
Gartley Pattern: Indicates retracement within a trend, typically completing at the 78.6% Fibonacci level.
Bat Pattern: Uses deeper retracement levels (88.6%) to identify precise turning points.
Butterfly Pattern: Suggests a reversal near 127% or 161.8% Fibonacci extensions.
Crab Pattern: Known for extreme projections (up to 224% or more), signaling deep retracements.
These patterns require advanced understanding of Fibonacci tools and are used by professional traders for precision entries.
11. Rounding Bottom and Top
Rounding Bottom:
Gradual shift from bearish to bullish sentiment.
Indicates long-term accumulation before a breakout.
Typically seen in major trend reversals in large-cap stocks.
Rounding Top:
Slow shift from bullish to bearish sentiment.
Represents distribution and is often followed by a sustained downtrend.
These patterns form over long durations (weeks or months) and are reliable for positional traders.
12. Broadening Formation
Also known as a megaphone pattern, it shows increasing volatility and investor uncertainty.
Formation: Two diverging trendlines — one ascending, one descending.
Meaning: Early sign of market instability; may precede major reversals.
Trade Setup: Enter once a confirmed breakout occurs beyond the pattern boundaries.
13. Volume and Confirmation in Chart Patterns
Volume plays a critical role in confirming pattern validity. Key principles include:
Decreasing volume during consolidation or pattern formation.
Increasing volume during breakout, confirming institutional participation.
False breakouts often occur on low volume, trapping retail traders.
Combining volume indicators (like OBV or Volume Oscillator) with pattern analysis enhances accuracy.
14. Practical Application and Risk Management
Even the most reliable patterns fail without proper risk management and confirmation strategies.
Wait for breakout confirmation with candle close beyond key levels.
Use stop-loss slightly below support or above resistance.
Combine patterns with momentum indicators like RSI or MACD for confirmation.
Avoid overtrading; focus on quality setups with clear symmetry and volume validation.
15. Conclusion
Advanced chart patterns bridge the gap between price action and trader psychology. They help traders interpret market behavior and anticipate future movements with a structured approach. Patterns like the Cup and Handle, Head and Shoulders, and Wedges reveal not just the direction but also the strength and conviction of trends.
Mastering these patterns requires practice, discipline, and confirmation through indicators and volume. When used correctly, advanced chart patterns empower traders to make informed, high-probability decisions — transforming random price data into profitable trading opportunities.
Implied Volatility and Open Interest Analysis1. Understanding Implied Volatility (IV)
Implied Volatility is a metric derived from the market price of options that reflects the market’s expectations of future volatility in the price of the underlying asset. Unlike historical volatility, which measures past price fluctuations, IV is forward-looking—it tells us how much the market expects the asset to move in the future.
Key Characteristics of IV:
Expressed in percentage terms, showing the expected annualized movement in the underlying asset.
Does not predict direction—only the magnitude of expected price swings.
Higher IV means the market expects larger price movements (high uncertainty or fear).
Lower IV means smaller expected price movements (stability or complacency).
Factors Influencing Implied Volatility:
Market sentiment: During uncertainty or events like elections, budgets, or economic announcements, IV tends to rise.
Supply and demand for options: Heavy buying of options increases IV, while heavy selling reduces it.
Time to expiration: Longer-duration options usually have higher IV due to greater uncertainty over time.
Earnings or corporate events: Stocks often show rising IV ahead of quarterly earnings announcements.
2. Interpreting Implied Volatility
High IV Environment:
When IV is high, option premiums are expensive. This generally indicates:
Traders expect significant movement (up or down).
Fear or uncertainty is present in the market.
Volatility sellers (option writers) might see an opportunity to sell overpriced options.
For example, before major events like the Union Budget or RBI policy meeting, IV in Nifty options typically spikes due to the anticipated market reaction.
Low IV Environment:
When IV is low, option premiums are cheaper. This usually means:
The market expects calm or limited movement.
Traders may be complacent.
Volatility buyers might see an opportunity to buy options cheaply before an expected rise in volatility.
Implied Volatility Rank (IVR) and IV Percentile:
IV Rank compares current IV to its range over the past year.
Example: An IV Rank of 80 means current IV is higher than 80% of the past year’s readings.
IV Percentile shows the percentage of time IV has been below current levels.
Both help traders decide if options are cheap or expensive relative to history.
3. Understanding Open Interest (OI)
Open Interest represents the total number of outstanding option or futures contracts that are currently open (not yet closed, exercised, or expired). It indicates the total participation or liquidity in a particular strike or contract.
For example, if a trader buys 1 Nifty 22000 Call and another trader sells it, OI increases by one contract. If later that position is closed, OI decreases by one.
Key Aspects of OI:
Rising OI with rising prices = new money entering the market (bullish).
Rising OI with falling prices = fresh short positions (bearish).
Falling OI with rising or falling prices = unwinding of positions (profit booking or exit).
Stable OI = sideways or consolidating market.
4. How to Read Open Interest Data
OI and Price Relationship:
Price Trend OI Trend Market Interpretation
↑ Price ↑ OI Long build-up (bullish)
↓ Price ↑ OI Short build-up (bearish)
↑ Price ↓ OI Short covering (bullish)
↓ Price ↓ OI Long unwinding (bearish)
For example, if Nifty futures rise by 150 points and OI increases, traders are opening new long positions, suggesting bullishness. But if prices rise while OI falls, short positions are being covered.
5. Using OI in Option Chain Analysis
In options trading, OI is especially useful for identifying support and resistance zones.
High Call OI indicates a potential resistance level because sellers expect the price to stay below that strike.
High Put OI indicates a potential support level because sellers expect the price to stay above that strike.
For instance:
If Nifty has maximum Call OI at 22500 and maximum Put OI at 22000, traders consider this as a range of consolidation (22000–22500).
A breakout above 22500 or breakdown below 22000 with sharp OI changes can signal a shift in trend.
6. Combining IV and OI for Better Insights
Using IV and OI together gives a more complete picture of the market’s mindset.
Scenario 1: Rising IV + Rising OI
Indicates strong speculative activity.
Traders expect big moves, either due to events or upcoming volatility.
Suitable for straddle or strangle buyers.
Scenario 2: Falling IV + Rising OI
Implies calm market conditions with new positions being built.
Traders expect limited movement.
Suitable for option writing strategies (like Iron Condor, Short Straddle).
Scenario 3: Rising IV + Falling OI
Suggests short covering or unwinding due to fear.
Market participants are closing existing positions amid uncertainty.
Scenario 4: Falling IV + Falling OI
Indicates profit booking after a volatile phase.
Usually happens in post-event consolidation.
7. Practical Example: Nifty Option Chain Analysis
Suppose the Nifty 50 index is trading around 22,300.
Strike Call OI Put OI IV (Call) IV (Put)
22,000 4.8 L 6.2 L 15% 16%
22,300 5.5 L 5.1 L 17% 18%
22,500 7.8 L 3.9 L 20% 17%
Here:
Maximum Call OI at 22,500 → Resistance zone.
Maximum Put OI at 22,000 → Support zone.
IV is rising across strikes → traders expect upcoming volatility.
If price moves above 22,500 and Call writers exit (OI drops), while new Put OI builds, it signals a bullish breakout.
8. Role of IV and OI in Strategy Selection
High IV Strategies (Volatile Market):
Buy Straddle or Strangle (expecting large movement)
Calendar Spread
Long Vega strategies
Low IV Strategies (Stable Market):
Iron Condor
Short Straddle
Covered Call
Credit Spreads
OI data helps traders identify which strikes to select for these strategies and where the market might reverse or consolidate.
9. Limitations of IV and OI Analysis
While powerful, both metrics have limitations:
IV can be misleading before major events; it reflects expectations, not certainty.
OI data is end-of-day in many cases, so intraday traders might miss rapid shifts.
Sharp OI changes might also result from rollovers or hedging adjustments, not directional bias.
Hence, traders must use IV and OI along with price action, volume, and trend indicators for confirmation.
10. Conclusion
Implied Volatility and Open Interest form the foundation of options market sentiment analysis.
IV tells us what the market expects to happen in terms of movement magnitude.
OI tells us how much participation or commitment traders have in the current trend.
Together, they reveal a deeper layer of market psychology—identifying whether traders are fearful, greedy, hedging, or speculating.
For successful trading, combining price action + IV + OI enables traders to forecast volatility cycles, confirm trends, and time their entries or exits effectively.
In essence, mastering IV and OI analysis empowers traders to read the invisible hand of market sentiment—a crucial skill for anyone in the derivatives market.
Knowledge of Candle Pattern What a candlestick shows (quick)
Body = open → close (filled/green = close>open bullish, filled/red = close

Part 6 Learn Institutional Trading What Are Options?
An option is a financial derivative whose value is based on an underlying asset—such as stocks, indices, or commodities. The two main types of options are:
Call Option: Gives the holder the right to buy an asset at a specific price (called the strike price) before or on the expiration date.
Put Option: Gives the holder the right to sell an asset at a specific strike price before or on the expiration date.
The buyer of an option pays a premium to the seller (writer) for this right. The seller, in return, assumes an obligation—if the buyer exercises the option, the seller must fulfill the contract terms.

The Modern Market Explosion1. The Digital Revolution in Financial Markets
The first and most powerful factor behind the modern market explosion is digitalization. In the 1980s and 1990s, trading floors were filled with brokers shouting bids and offers. Today, a vast majority of global trades happen electronically within milliseconds. Platforms like NSE, NASDAQ, and NYSE are now driven by high-speed algorithms and smart order systems.
Technology has democratized investing. Mobile apps and online platforms have made it possible for anyone — from a college student to a retiree — to invest in stocks, ETFs, or cryptocurrencies from their smartphones. This has led to a surge in retail participation across the world.
Moreover, the integration of AI and machine learning has redefined data analysis. Traders can now detect patterns, forecast trends, and execute trades with precision that was once unimaginable. AI-driven bots make split-second decisions based on vast data streams, helping investors capture opportunities faster than ever before.
2. Globalization and Market Interconnectivity
Today’s markets are no longer local — they are interconnected ecosystems. What happens in one corner of the world instantly impacts another. A rate hike in the U.S. can move Asian currencies, while a geopolitical conflict in the Middle East can spike global oil prices and influence stock indices in Europe and India.
This interconnectivity means opportunities are global. Investors can diversify portfolios across geographies — U.S. tech stocks, Indian mid-caps, Japanese bonds, and even African startups. But it also means higher volatility. The same interlinkage that offers diversification can also spread panic during crises — as seen in the 2008 financial meltdown or the 2020 pandemic shock.
However, globalization has also enabled foreign capital inflows into emerging economies, fueling growth and innovation. Markets like India, Indonesia, and Brazil have seen massive foreign institutional investments (FIIs) as global investors search for higher returns.
3. The Rise of Retail Investors and the “Crowd Effect”
One of the most striking features of the modern market explosion is the rise of retail participation. The COVID-19 pandemic accelerated this trend as millions turned to trading apps during lockdowns. Platforms like Zerodha, Robinhood, and Groww brought zero-commission trading, social learning, and user-friendly interfaces — empowering individuals to take control of their financial future.
Retail investors have become a powerful market force. Their collective moves can influence stock trends, as seen in the 2021 “GameStop phenomenon,” where a community of small traders challenged big hedge funds. Social media platforms like Reddit, X (Twitter), and YouTube have become virtual trading floors, where ideas spread faster than news headlines.
This new wave has made markets more dynamic but also more sentiment-driven. Tweets, rumors, or viral posts can trigger price movements — making psychology as important as fundamentals.
4. Explosion of Asset Classes and Financial Instruments
Modern markets are not limited to stocks and bonds anymore. Investors today have access to an explosion of financial instruments — from commodities and derivatives to cryptocurrencies, NFTs, and tokenized assets.
Cryptocurrencies like Bitcoin and Ethereum have introduced decentralized finance (DeFi), where financial transactions occur without intermediaries.
Exchange-Traded Funds (ETFs) offer exposure to entire sectors, themes, or countries in a single trade.
Options and futures allow traders to speculate or hedge against price movements with leverage.
Green finance and ESG investments are attracting investors seeking both profit and sustainability.
This diversity has expanded investment choices but also increased complexity. The new challenge for traders is not lack of opportunity, but knowing where to focus.
5. Speed, Data, and the New Trading Psychology
Markets now operate at machine speed. Algorithmic trading, powered by data analytics, accounts for more than half of global trading volume. Every second, millions of transactions take place across exchanges.
But this speed comes with a psychological shift. Traders must adapt to shorter timeframes and rapid information flow. In such a fast-moving environment, fear and greed amplify quickly. A small piece of negative news can trigger instant sell-offs, while hype can drive unsustainable rallies.
In this high-speed world, success depends on discipline, emotional control, and understanding market structure rather than chasing trends. Smart traders analyze volume profiles, liquidity zones, and institutional footprints to navigate volatility effectively.
6. The Role of Central Banks and Liquidity Waves
Modern markets also respond strongly to monetary policy. Central banks like the U.S. Federal Reserve, European Central Bank, and the Reserve Bank of India play a key role in shaping liquidity conditions.
Over the past decade, low-interest rates and quantitative easing (QE) flooded markets with liquidity, driving asset prices to record highs. However, when rates rise, the same liquidity reversal can cause sharp corrections — as seen in 2022.
The explosion in asset prices, from real estate to equities, has been largely fueled by easy money. This has also raised concerns about bubbles, inequality, and systemic risk. Thus, the modern market is as much about liquidity cycles as it is about fundamentals.
7. ESG, Sustainability, and the Future of Capital
Another major dimension of the modern market explosion is the rise of responsible investing. Environmental, Social, and Governance (ESG) factors are now integral to corporate strategy and investor decisions.
Global investors are demanding transparency, green energy initiatives, and ethical governance. Companies that align with sustainability goals attract more capital and public trust. This trend represents a moral shift — markets are no longer just about profit but purpose.
Renewable energy, electric vehicles, and carbon-credit trading are becoming new frontiers of market growth. In essence, the explosion isn’t just financial — it’s philosophical.
8. Artificial Intelligence and the Next Market Evolution
AI is the backbone of the next stage of market evolution. From predictive analytics to automated risk management, AI systems are reshaping portfolio strategies. Machine learning models analyze historical data, news sentiment, and global indicators to generate trading insights at unmatched speed.
Even retail investors can now use AI-powered tools to optimize strategies or detect anomalies. This levels the playing field, allowing individuals to compete with institutions — provided they understand how to use data intelligently.
However, this also raises questions about market fairness and algorithmic dominance. When machines control large volumes of trades, flash crashes and liquidity spikes become real risks.
9. Challenges in the Modern Market Era
Despite its opportunities, the modern market explosion faces significant challenges:
Volatility: Rapid information flow can cause unpredictable swings.
Regulation: Governments struggle to keep up with innovations like crypto and DeFi.
Cybersecurity: As markets go digital, hacking and data breaches pose serious risks.
Inequality: Wealth gaps may widen as those with access to technology and information dominate returns.
To sustain growth, regulators, investors, and institutions must strike a balance between innovation and stability.
10. Conclusion: The Future is Decentralized, Digital, and Data-Driven
The modern market explosion is not a single event — it’s an ongoing revolution. Every innovation, every new investor, and every data-driven decision adds another spark to this dynamic ecosystem.
We’re witnessing the democratization of finance — where anyone with knowledge, discipline, and internet access can participate in wealth creation. But success will depend on adaptability, continuous learning, and emotional intelligence.
As technology continues to evolve, markets will become more decentralized, transparent, and intelligent. The future belongs to those who understand that this explosion isn’t just about money — it’s about information, connection, and evolution.
Intraday Scalping Tips: Mastering the Art of Fast Profits1. What Is Intraday Scalping?
Scalping is a subset of intraday trading, but with a much shorter time frame. Instead of holding trades for hours, scalpers enter and exit positions within seconds or minutes. The goal is to capture tiny price movements, often ranging from 0.1% to 0.5%, multiple times a day.
For example, if a stock moves from ₹500 to ₹501, a scalper may book a quick profit and repeat the process across different stocks or price levels. Over the course of the day, these small gains can accumulate into substantial profits if managed properly.
However, because scalping involves high trading frequency, transaction costs, timing, and execution speed become critical factors.
2. The Psychology of a Scalper
Scalping is not just about strategy—it’s about mindset. A successful scalper must be calm under pressure, quick in decision-making, and emotionally detached from wins or losses.
Unlike swing traders, scalpers can’t afford to wait for a market to “come back.” They must accept small losses quickly and move on to the next trade. Emotional control and discipline are therefore more important than technical knowledge alone.
Key psychological traits include:
Speed and decisiveness – No hesitation when an entry or exit signal appears.
Emotional neutrality – Avoid greed after profits or frustration after losses.
Discipline – Follow your plan and respect stop-loss limits, no matter what.
3. Essential Tools for Scalping
To succeed as a scalper, you need a professional setup that allows for precision and speed:
Fast Internet Connection: Delays of even a few seconds can affect profits.
Reliable Trading Platform: Choose brokers and platforms with low latency and fast execution (like Zerodha, Angel One, or Upstox for Indian markets).
Direct Market Access (DMA): Helps execute orders directly without delays.
High-Quality Charting Software: For real-time technical analysis (e.g., TradingView).
Level 2 Data / Market Depth: To understand bid-ask spreads and liquidity levels.
Having these tools in place ensures your decisions are based on real-time data and executed without technical lag.
4. Choosing the Right Stocks for Scalping
Not every stock is suitable for scalping. The best scalping stocks share certain characteristics:
High Liquidity: The stock should have high trading volume so you can enter and exit quickly.
Tight Spreads: A small bid-ask spread ensures that transaction costs remain low.
Volatility: Moderate price movement ensures enough opportunities without erratic swings.
Popular Stocks: Large-cap or index-based stocks like Reliance Industries, HDFC Bank, or Infosys are often good choices due to consistent volume.
Scalpers usually stick to 3–5 familiar stocks daily, mastering their price behavior instead of chasing every trending name.
5. Technical Indicators That Work for Scalping
Scalping relies heavily on technical indicators for quick decision-making. Some of the most effective tools include:
Moving Averages (MA): Short-term MAs like 5-EMA and 9-EMA help identify quick trends and crossovers.
VWAP (Volume Weighted Average Price): Acts as a dynamic support and resistance level; many institutional traders use it for intraday benchmarks.
Relative Strength Index (RSI): Helps identify overbought or oversold conditions (ideal range for scalpers: 5–15 RSI periods).
Bollinger Bands: Indicate volatility and possible breakout zones.
Volume Analysis: Volume spikes often precede major price movements—critical for timing entries.
The best scalpers combine 2–3 of these tools rather than cluttering charts with too many indicators.
6. Entry and Exit Strategies
Scalping thrives on timing and precision. Here are a few commonly used strategies:
a. Breakout Scalping
Scalpers wait for the price to break above resistance or below support with strong volume confirmation. Entry happens immediately after the breakout, and exits occur once quick profit targets (0.3%–0.5%) are achieved.
b. Range Scalping
When markets move sideways, scalpers buy near the lower boundary of the range and sell near the upper boundary. Stop-losses are placed just beyond the range.
c. Momentum Scalping
In this method, traders ride short bursts of momentum caused by news, earnings releases, or large market orders. Scalpers jump in with the trend and exit at the first sign of weakness.
Regardless of the method, stop-losses must be placed immediately—typically 0.25%–0.5% below the entry price—to control risk.
7. The Importance of Risk Management
Scalping without risk management is gambling. Since gains are small, even a few large losses can wipe out profits. Effective risk control ensures survival and consistency.
Position Sizing: Don’t risk more than 1%–2% of total capital per trade.
Tight Stop-Loss: Always use stop-loss orders to cap losses quickly.
Avoid Overtrading: Set a limit on the number of trades per day. Quality over quantity.
Keep Costs in Check: Brokerage and taxes can eat into profits. Use low-cost brokers.
Successful scalpers often say: “Protect your capital first; profits will follow.”
8. Trading Discipline and Routine
Consistency is key in scalping. Having a structured trading routine ensures focus and control.
Morning Preparation:
Review pre-market news, global cues, and technical setups.
Identify your watchlist of 3–5 liquid stocks.
Mark key intraday support and resistance zones.
During Trading Hours:
Trade only within your strategy and avoid impulsive trades.
Monitor volume surges and price reactions near key levels.
Book profits quickly; don’t aim for large moves.
Post-Market Review:
Analyze your trades to identify mistakes or strengths.
Maintain a journal recording entry/exit points, emotions, and results.
This continuous improvement mindset separates professional scalpers from amateurs.
9. Avoid Common Scalping Mistakes
Even experienced traders can fall into common traps. Be aware of these:
Over-leveraging: Using too much margin increases the risk of large losses.
Ignoring News Events: Sudden announcements can cause unexpected volatility.
Chasing Trades: Don’t enter trades just because of missed opportunities.
Neglecting Transaction Costs: Frequent trading magnifies brokerage and taxes.
Lack of Patience: Waiting for the right setup is part of the discipline.
Remember, in scalping, one bad trade can ruin ten good ones.
10. Building a Winning Scalping Mindset
Success in scalping is not about winning every trade—it’s about consistency. A skilled scalper understands that small, steady gains compound over time.
Focus on process over profit:
Stick to your rules.
Accept small losses gracefully.
Never revenge-trade after a loss.
Stay humble—markets reward patience and discipline.
Professional scalpers often compare their work to that of a surgeon: precise, focused, and unemotional.
Conclusion
Intraday scalping is an art that blends speed, strategy, and discipline. It may not suit everyone—its fast pace and emotional intensity demand exceptional control and focus. However, for those who master it, scalping can be one of the most consistent and lucrative trading styles.
By understanding market micro-movements, managing risk, and following a structured trading plan, traders can turn tiny price fluctuations into meaningful daily income. In the world of scalping, success doesn’t come from predicting the market—it comes from reacting to it faster and smarter than everyone else.
Domestic Equity Market Trend1. Overview of the Domestic Equity Market
The domestic equity market refers to the marketplace within a country where shares of publicly listed companies are traded. In India, the two major stock exchanges are the National Stock Exchange (NSE) and the Bombay Stock Exchange (BSE). These exchanges provide the platform for investors to buy and sell equity shares, derivatives, and other securities.
The Indian stock market has seen remarkable growth, transitioning from a traditional broker-driven system to an advanced, technology-based environment. The benchmark indices—Nifty 50 and Sensex—serve as the barometers of the market’s overall performance, representing the health of leading sectors in the economy.
2. Recent Market Trends and Developments
In recent years, the domestic equity market has demonstrated resilience and expansion, driven by factors such as economic reforms, digitalization, and rising participation from retail investors.
a. Record Market Capitalization
India’s market capitalization crossed record highs, placing it among the top five global markets. The continuous inflow of foreign and domestic institutional funds, alongside Initial Public Offerings (IPOs) of emerging companies, has propelled the growth.
b. Retail Investor Dominance
Retail participation has surged significantly post-2020, aided by easy access to trading platforms, low brokerage costs, and increased financial literacy. Demat accounts have grown exponentially, indicating a structural shift where individuals are no longer mere spectators but active participants.
c. Sectoral Rotation
Different sectors have led the rally at different times—technology and pharmaceuticals during the pandemic, followed by banking, infrastructure, and capital goods in the recovery phase. This rotation indicates a healthy and balanced market evolution.
d. Growing SME and IPO Market
The SME (Small and Medium Enterprises) and mainboard IPO segments have gained strong traction. The appetite for new-age business models—such as fintech, renewable energy, and logistics—shows the market’s increasing acceptance of innovation-driven enterprises.
3. Key Drivers Influencing Domestic Equity Trends
a. Economic Growth
Equity markets move in tandem with GDP growth. India’s consistent growth rate, backed by manufacturing revival, infrastructure push, and consumption strength, supports bullish trends in equities.
b. Monetary Policy and Interest Rates
The Reserve Bank of India’s (RBI) policies on liquidity and interest rates play a crucial role. Lower interest rates typically boost equity valuations, as investors prefer equities over fixed-income assets for better returns.
c. Global Influences
Despite being a domestic market, Indian equities are affected by global events such as the U.S. Federal Reserve’s policy stance, crude oil price movements, geopolitical tensions, and global capital flows.
d. Corporate Earnings
Sustained improvement in quarterly corporate earnings has kept investor sentiment positive. Companies with strong balance sheets, high return on equity, and efficient management continue to attract long-term investments.
e. Technological Transformation
The rise of digital trading platforms, AI-based analytics, and algorithmic trading has enhanced liquidity and efficiency. This modernization has encouraged both professional and retail investors to engage more actively.
4. Sector-Wise Trends
The performance of the domestic equity market can be better understood by examining sectoral movements:
a. Banking and Financial Services
The banking sector has regained leadership, supported by improved asset quality, higher credit growth, and profitability. PSU banks have shown a strong turnaround, while private banks maintain their growth momentum.
b. Information Technology
While the IT sector faced margin pressures due to global slowdown concerns, it remains a structural growth driver given India’s digital transformation and global outsourcing demand.
c. Infrastructure and Capital Goods
This sector is witnessing a revival, backed by government infrastructure spending and private capex cycles. Stocks in this space are favored for long-term growth potential.
d. Energy and Renewable Sector
The energy sector is transforming rapidly with the focus shifting to renewables. Companies involved in solar, wind, and green hydrogen are drawing strong investor interest.
e. FMCG and Consumer Discretionary
Consumer-driven sectors benefit from rising income levels and urbanization. Despite inflationary pressures, demand remains robust, making them stable defensive plays.
5. Foreign Institutional Investors (FIIs) vs. Domestic Institutional Investors (DIIs)
The balance between FIIs and DIIs has become a defining factor for market stability. While FIIs bring in large capital inflows that can drive momentum, DIIs—such as mutual funds and insurance companies—help stabilize the market during volatile phases. The growing strength of DIIs reflects increasing domestic confidence in the Indian growth story.
6. Valuation and Liquidity Outlook
India’s equity valuations are relatively higher compared to peers, reflecting strong growth expectations. However, this also implies that any earnings slowdown could trigger short-term corrections. Liquidity remains ample, with consistent inflows from mutual funds and systematic investment plans (SIPs), which have become a cornerstone of long-term investing culture.
7. Policy and Regulatory Support
Reforms such as GST, Insolvency and Bankruptcy Code (IBC), Production-Linked Incentive (PLI) schemes, and Make in India have improved the investment climate. The Securities and Exchange Board of India (SEBI) continues to enhance transparency, corporate governance, and investor protection, strengthening market integrity.
8. Emerging Themes and Opportunities
a. Digital Economy and Fintech
India’s digital economy is expanding rapidly, creating investment opportunities in payment systems, e-commerce, and tech-driven services.
b. Manufacturing and “China+1” Strategy
Global supply chain diversification has made India a preferred destination for manufacturing investments, benefiting auto, electronics, and industrial sectors.
c. Green and Sustainable Investments
ESG (Environmental, Social, and Governance) investing is gaining momentum, with investors focusing on companies with sustainable practices and ethical governance.
d. Small-Cap and Mid-Cap Momentum
Smaller companies have outperformed large caps in recent times, driven by innovation, agility, and niche market leadership. However, this segment also comes with higher risk and volatility.
9. Risks and Challenges
No market is without risks. Key challenges for the domestic equity market include:
Global slowdown impacting exports and IT revenues.
Inflationary pressures leading to tighter monetary policies.
Political and regulatory uncertainties, especially around election periods.
Valuation concerns in overbought segments.
Liquidity shocks if foreign investors withdraw funds suddenly.
Long-term investors must stay alert to these risks while maintaining a diversified portfolio.
10. Long-Term Outlook
The long-term outlook for India’s domestic equity market remains optimistic and growth-oriented. Structural reforms, digital infrastructure, demographic advantage, and a strong entrepreneurial ecosystem make India a compelling investment destination. The combination of policy stability, rising domestic consumption, and innovation ensures that Indian equities remain a central focus for global investors.
Conclusion
The domestic equity market trend reflects a story of transformation, resilience, and opportunity. From being an emerging market to becoming one of the world’s fastest-growing equity destinations, India’s market evolution is driven by strong fundamentals, policy reforms, and investor participation. While short-term corrections are inevitable, the long-term trajectory remains bullish. For investors, staying informed, disciplined, and diversified is the key to navigating this ever-evolving landscape.

Sub-Brokers in India1. Who is a Sub-Broker?
A sub-broker is an intermediary who acts as a bridge between investors and stockbrokers. In simple terms, a sub-broker is an agent or franchise partner who does not directly trade on the stock exchanges but helps investors carry out their trades through a registered stockbroker.
Earlier, sub-brokers were required to register with SEBI under the SEBI (Stock Brokers and Sub-Brokers) Regulations, 1992. However, after 2018, SEBI discontinued the direct registration of new sub-brokers, shifting the model toward Authorised Persons (APs) under the exchange’s regulations (like NSE or BSE). Thus, in the current system, the term sub-broker and authorised person are used interchangeably, although “sub-broker” still exists in market terminology.
2. Evolution of Sub-Brokers in India
In the early 1990s and 2000s, the Indian capital market was dominated by physical trading and traditional brokerage houses. Investors from smaller towns had limited access to stock exchanges located in metros like Mumbai or Delhi. Sub-brokers emerged as local representatives of big brokers, offering access to markets through personalized services.
With the introduction of dematerialization, online trading, and discount brokerages, the ecosystem began to shift. Full-service brokers started expanding their presence through sub-broker networks and franchisees. After SEBI’s 2018 circular, the registration and regulatory structure changed, giving rise to the Authorised Person (AP) model, which simplified processes and brought all sub-brokers under the supervision of exchanges rather than SEBI.
Today, sub-brokers continue to play a vital role in financial inclusion, especially in tier-2 and tier-3 cities, where personal trust and relationships drive investment decisions.
3. Role and Responsibilities of Sub-Brokers
Sub-brokers perform several important functions that help the stock market ecosystem grow smoothly. Their main responsibilities include:
Client Acquisition and Relationship Management:
They identify and onboard new investors, explaining investment opportunities and helping clients open trading and demat accounts through their affiliated brokers.
Advisory Services:
Many sub-brokers provide personalized advisory support—guiding clients about market trends, suitable investment products, and portfolio diversification (though only SEBI-registered advisors can offer paid advice).
Trade Execution Assistance:
They help clients place buy/sell orders, manage trade confirmations, and ensure smooth execution through the broker’s platform.
Documentation and Compliance:
Sub-brokers assist in completing KYC (Know Your Customer) documentation and ensure compliance with SEBI and exchange rules.
After-Sales Service:
They support clients with margin updates, account statements, payout requests, and grievance redressal.
In short, sub-brokers act as the local face of big brokerage firms, ensuring last-mile connectivity and personal service to clients.
4. The Regulatory Framework
The SEBI (Stock Brokers and Sub-Brokers) Regulations, 1992 originally governed sub-broker activities. However, with changing market dynamics, SEBI simplified the process by amending the regulations.
Key milestones include:
1992: Sub-broker registration made mandatory under SEBI rules.
2018: SEBI discontinued new registrations of sub-brokers and replaced them with the Authorised Person (AP) model.
Current Framework:
A sub-broker (now AP) must be affiliated with a SEBI-registered stockbroker (member of NSE, BSE, or MCX).
The stock exchange maintains records and ensures due diligence before approving an AP.
Sub-brokers must follow all rules regarding client onboarding, KYC, and grievance handling.
Thus, while the term “sub-broker” still exists informally, all new participants are registered under the AP structure.
5. How to Become a Sub-Broker or Authorised Person
To become a sub-broker (or AP) in India, the following steps are generally followed:
Select a Broker Partner:
Choose a SEBI-registered brokerage firm like Angel One, ICICI Direct, Zerodha, Sharekhan, or Motilal Oswal that offers franchise or AP programs.
Application Process:
Submit an application to the broker and respective stock exchange with necessary documents (identity proof, educational qualification, business address, etc.).
Documentation:
The documents required typically include:
PAN and Aadhaar Card
Proof of business premises
Educational certificates (minimum 10+2)
Bank statement and canceled cheque
Photograph and signature
Exchange Approval:
The broker forwards the application to the exchange (e.g., NSE or BSE) for approval. Once approved, the applicant becomes an authorised person and can start operations.
Franchise Agreement:
A business agreement is signed between the broker and the sub-broker/AP defining revenue sharing, rights, and responsibilities.
6. Revenue Model of Sub-Brokers
Sub-brokers earn income mainly through revenue sharing with the main broker. The structure varies depending on the broker, product type, and business volume.
Common revenue models include:
Commission Sharing:
The sub-broker earns a fixed percentage of the brokerage generated by clients introduced by them. The typical sharing ratio is 60:40 to 80:20 (in favor of the sub-broker).
Referral Income:
For clients referred to digital brokers, sub-brokers may earn a one-time onboarding incentive or small lifetime brokerage sharing.
Additional Incentives:
Some brokers offer performance bonuses, marketing support, or rebates for reaching trading volume targets.
Thus, income potential depends on the sub-broker’s client base, service quality, and regional presence.
7. Advantages of Being a Sub-Broker
Low Investment, High Potential:
Unlike starting a full-fledged brokerage, becoming a sub-broker requires limited capital investment.
Established Brand Support:
Working with reputed brokers allows sub-brokers to leverage brand trust and advanced technology platforms.
Wide Product Range:
Sub-brokers can offer clients access to equities, derivatives, commodities, mutual funds, and IPOs under one platform.
Recurring Income:
Since brokerage is earned on every transaction, sub-brokers enjoy recurring revenue as long as clients remain active.
Local Market Expansion:
Sub-brokers act as key drivers of financial inclusion, helping investors from smaller cities participate in markets confidently.
8. Challenges Faced by Sub-Brokers
Despite opportunities, sub-brokers face several challenges in the modern trading environment:
Digital Disruption:
Discount brokers like Zerodha and Groww have reduced brokerage fees drastically, impacting commission-based income.
Regulatory Compliance:
Sub-brokers must stay updated with frequent SEBI and exchange rule changes.
Client Retention:
With the rise of online self-trading, retaining clients through personalized service has become more critical.
Competition:
Thousands of sub-brokers and financial distributors operate in the same localities, making differentiation difficult.
Nevertheless, many sub-brokers are adapting by embracing digital tools, offering hybrid advisory models, and focusing on long-term wealth management.
9. Future of Sub-Brokers in India
The sub-broker system is not disappearing—it is evolving. The Authorised Person model, combined with digital franchise frameworks, is making sub-brokerage more transparent, scalable, and technology-driven.
In the coming years, the focus will shift toward:
Digital client acquisition and onboarding
AI-driven advisory and analytics tools
Multi-asset offerings (stocks, mutual funds, insurance, loans)
Partner networks expanding in rural and semi-urban regions
SEBI’s vision of financial inclusion aligns well with the sub-broker model, ensuring that even small investors across India get access to capital markets.
Conclusion
Sub-brokers have been the backbone of India’s retail participation in stock markets. While their regulatory identity has evolved into that of Authorised Persons, their importance remains undiminished. They serve as the personal link between investors and markets—educating, assisting, and empowering individuals to invest confidently.
In an age of digital platforms and algorithmic trading, sub-brokers continue to add human value—trust, guidance, and service—which technology alone cannot replace. As India’s financial markets expand, the sub-broker network will remain an essential pillar of inclusive market growth and investor participation.

Banking Sector LeadershipThe Driving Force Behind Financial Stability and Growth
The banking sector is the backbone of every modern economy. It connects savers and borrowers, funds businesses, manages risks, and stabilizes markets. But at the heart of every successful banking system lies strong leadership—visionary individuals and institutions that shape financial policy, drive innovation, and sustain trust. In the last few decades, the role of leadership in the banking sector has evolved from simple financial management to strategic foresight, digital transformation, and crisis navigation.
This essay explores the meaning, importance, evolution, and future of leadership in the global and Indian banking sectors.
1. The Essence of Leadership in Banking
Leadership in the banking sector goes beyond managing money. It’s about building trust, ensuring stability, and enabling growth. Unlike other industries, banking deals with intangible assets—confidence and credibility. When people deposit their life savings in a bank or borrow for a business, they rely on the institution’s integrity and stability. Strong leadership ensures that trust remains unbroken, even in times of uncertainty.
Effective banking leaders must balance three priorities:
Financial stability: Maintaining liquidity, managing risk, and complying with regulations.
Innovation: Adapting to new technologies, customer preferences, and financial products.
Ethics and governance: Ensuring transparency, fairness, and accountability.
2. Historical Evolution of Banking Leadership
The journey of banking leadership reflects the economic evolution of societies.
Traditional Era (Pre-1980s):
Leadership was conservative and stability-oriented. Banks focused on deposits, lending, and government securities. Leaders prioritized compliance and trust-building, as technology played little role.
Liberalization and Globalization (1980s–2000s):
The rise of multinational corporations, stock markets, and deregulation changed everything. Leaders began emphasizing profitability, expansion, and competitive advantage. Figures like Jamie Dimon (JPMorgan Chase) and Deepak Parekh (HDFC) became known for balancing innovation with prudence.
Digital Transformation (2000s–2020s):
The fintech revolution redefined leadership. The focus shifted toward technology adoption, customer experience, and data-driven decisions. Leaders such as Arundhati Bhattacharya (SBI) and Uday Kotak (Kotak Mahindra Bank) showcased how traditional banking could blend with digital dynamism.
Modern Era (Post-COVID-19):
The pandemic tested leadership resilience. Remote banking, cybersecurity, ESG (Environmental, Social, and Governance) goals, and sustainable finance became the new leadership frontiers.
3. Key Traits of Effective Banking Leaders
Modern banking leadership requires a blend of financial expertise, innovation, and empathy. Below are the core traits defining successful leaders in this sector:
Visionary Thinking:
Leaders must foresee economic trends, anticipate risks, and align institutions with long-term goals. Visionary leadership prevents crises and prepares for technological shifts.
Risk Management:
Banking inherently involves risk—credit, market, and operational. Strong leaders build frameworks to manage these efficiently while avoiding overexposure.
Adaptability:
The financial landscape changes fast. Whether it's blockchain, digital currency, or changing regulations, adaptive leaders drive transformation rather than resist it.
Ethical Integrity:
Scandals and frauds can destroy banks overnight. Ethical leadership ensures transparency, compliance, and fair treatment of customers.
Customer-Centric Focus:
Leaders today must prioritize customer needs, from rural financial inclusion to seamless digital experiences.
Team Empowerment:
A strong leader builds strong teams. By fostering skill development and inclusivity, leaders prepare their organizations for sustainable growth.
4. Leadership Models in Banking
Different banks adopt different leadership styles depending on their goals and market conditions:
Transformational Leadership:
Encourages innovation and digital transformation. For example, Satya Nadella’s approach at Microsoft has inspired similar models in financial institutions focusing on culture change.
Servant Leadership:
Focuses on employee welfare and customer satisfaction. Cooperative banks and regional rural banks often follow this model.
Strategic Leadership:
Seen in global banks like HSBC or Citibank, where leaders must balance complex international regulations and strategies.
Crisis Leadership:
Essential during financial downturns, such as the 2008 global crisis. Leaders like Ben Bernanke (Federal Reserve) and Raghuram Rajan (RBI) demonstrated how proactive policy can restore stability.
5. Indian Banking Sector Leadership
India’s banking leadership landscape is a powerful blend of tradition and innovation. Some iconic examples include:
Arundhati Bhattacharya (SBI):
The first woman to lead the State Bank of India, she championed digital banking, improved governance, and promoted women in leadership.
Aditya Puri (HDFC Bank):
Known for building HDFC Bank into India’s most valuable private lender through strict discipline, innovation, and customer focus.
Uday Kotak (Kotak Mahindra Bank):
Pioneered entrepreneurial banking and emphasized capital efficiency and risk management.
Raghuram Rajan (RBI):
Brought global recognition to Indian monetary policy through transparency, macroeconomic stability, and inflation control.
Shaktikanta Das (RBI):
His leadership during the pandemic exemplified resilience—balancing growth and inflation with measured monetary policies.
Indian banking leaders have also pushed for financial inclusion, digitalization (UPI, RuPay), and green finance, making India a model for emerging economies.
6. Challenges Faced by Banking Leaders
Banking leadership today faces complex challenges:
Technological Disruption:
Fintechs and digital wallets are reshaping consumer behavior. Leaders must collaborate rather than compete blindly with fintech firms.
Cybersecurity Threats:
As digital transactions grow, so do cyberattacks. Leadership must invest in secure systems and data protection.
Regulatory Complexity:
Complying with diverse local and international regulations is a balancing act between innovation and compliance.
Economic Volatility:
Interest rate hikes, inflation, and geopolitical tensions test financial resilience.
Talent Retention:
The next generation seeks flexibility and purpose. Modern leaders must create value-driven workplaces.
7. The Future of Banking Leadership
The future of banking leadership will revolve around three pillars: digital intelligence, sustainability, and inclusivity.
Digital Intelligence:
Leaders must master AI, blockchain, and data analytics to personalize banking and improve risk models.
Sustainability and ESG Goals:
Banking leaders will increasingly fund green projects, carbon-neutral businesses, and social initiatives.
Financial Inclusion:
Leadership must ensure banking reaches every citizen, not just urban elites. India’s Jan Dhan Yojana and digital KYC models show what visionary policy can achieve.
Collaborative Ecosystems:
Banks will partner with fintech startups, tech giants, and regulators to build integrated financial ecosystems.
8. Conclusion
Leadership in the banking sector is not just about managing money—it’s about managing trust, technology, and transformation. From managing crises to embracing digital revolutions, banking leaders shape the future of economies. The best leaders combine financial prudence with social responsibility, ensuring that banking remains a force for inclusion and growth.
In a rapidly changing world, where finance merges with technology and sustainability, the next generation of banking leaders must be adaptive visionaries—balancing risk and opportunity, ethics and innovation, profit and purpose. Their success will define not just the future of banks, but the economic destiny of nations.

Part 1 Intraday Master ClassWhat Are Options?
An option is a financial contract that gives the holder the right, but not the obligation, to buy or sell an underlying asset (such as stocks, indices, or commodities) at a predetermined price (called the strike price) before or on a specific expiry date.
Options are classified into two types:
Call Option: Gives the right to buy an asset at a specific price.
Put Option: Gives the right to sell an asset at a specific price.
For this right, the buyer of an option pays a premium to the seller (writer) of the option.

Part 1 Identifying Support and ResistanceWhy Trade Options?
Options serve multiple purposes in modern finance:
Hedging:
Investors use options to protect their portfolios from adverse price movements. For example, a stockholder may buy a put option to guard against a potential price fall.
Speculation:
Traders can speculate on short-term market movements with limited risk and potentially high returns. Buying calls or puts allows traders to profit from expected price directions without owning the underlying asset.
Income Generation:
Selling options (writing covered calls or cash-secured puts) generates regular income through premiums. Many institutional investors use this strategy to enhance portfolio returns.

PCR-basedTradingOption Pricing
Option prices are influenced by several factors, known collectively as the “Greeks.” These variables determine how an option’s value changes with respect to different market conditions.
Delta (Δ): Measures how much an option’s price changes for a ₹1 change in the underlying asset.
Gamma (Γ): Measures the rate of change of Delta.
Theta (Θ): Represents time decay — how much an option loses value as it nears expiry.
Vega (ν): Sensitivity to changes in volatility.
Rho (ρ): Sensitivity to changes in interest rates.
The Black-Scholes model is commonly used to estimate theoretical option prices by combining these factors.

Part 2 Understanding the Structure of a CandlestickKey Terminologies
To understand options deeply, it’s essential to know the following terms:
Strike Price: The fixed price at which the option holder can buy (call) or sell (put) the underlying.
Premium: The price paid by the option buyer to the seller.
Expiry Date: The date on which the option contract expires.
In-the-Money (ITM): A call option is ITM if the underlying price is above the strike price; a put option is ITM if the price is below the strike.
Out-of-the-Money (OTM): The opposite of ITM; when exercising the option would not be profitable.
At-the-Money (ATM): When the underlying price is equal (or close) to the strike price.
Intrinsic Value: The amount by which an option is in the money.
Time Value: The portion of the option’s premium that reflects the time left until expiry and market volatility.

Basic Concepts of Options TradingWhat Are Options?
An option is a financial derivative contract that gives the buyer the right, but not the obligation, to buy or sell an underlying asset—such as a stock, index, or commodity—at a predetermined price (called the strike price) on or before a specified date (the expiry date).
Options are of two main types:
Call Option: Gives the holder the right to buy the underlying asset at the strike price.
Put Option: Gives the holder the right to sell the underlying asset at the strike price.
Each option contract typically represents 100 shares of the underlying stock in many markets (such as the U.S.), but in the Indian derivatives market (NSE/BSE), the lot size varies for different stocks and indices.

Focus on Market Key Earnings1. What Are Earnings and Why They Matter
Earnings, also known as net income or profit, reflect the money a company makes after subtracting all expenses from its total revenue. It is the bottom line of a company’s income statement and one of the most closely watched indicators of financial success. Investors monitor earnings to evaluate a company’s financial health and growth potential. When earnings rise consistently, it suggests a strong business model, effective cost management, and growing demand for the company’s products or services. Conversely, declining earnings can signal potential trouble, inefficiency, or changing market conditions.
Earnings are reported in various forms, including:
Earnings per share (EPS): Net income divided by the number of outstanding shares. EPS is a key metric for comparing profitability across companies.
Revenue: The total income generated before expenses. Strong revenue growth indicates robust sales momentum.
Operating income: Profit generated from core business activities, excluding taxes and interest.
Net margin: The percentage of revenue left as profit after all costs.
Together, these metrics provide a comprehensive view of how efficiently a company operates and how much profit it generates from its resources.
2. The Role of Earnings Season
Earnings season occurs four times a year, following the end of each fiscal quarter. During this period, companies listed on major stock exchanges—such as the NSE, BSE, NYSE, or NASDAQ—announce their results. Investors closely analyze these reports because they often trigger significant price movements in stocks and indexes.
For example:
If a company beats expectations, meaning it reports earnings higher than analysts’ forecasts, its stock price often rises.
If it misses expectations, the stock might drop sharply as investors lose confidence.
Because earnings season reflects the performance of various sectors, it also influences broader market sentiment. Strong results from major companies like Reliance Industries, Infosys, or HDFC Bank in India—or Apple, Microsoft, and Amazon globally—can lift entire indices such as the Nifty 50 or S&P 500. Conversely, widespread earnings misses can signal a slowdown in corporate profitability and drag markets lower.
3. Key Components of an Earnings Report
Each company’s earnings report typically includes:
Income Statement: Shows revenues, expenses, and profits.
Balance Sheet: Lists assets, liabilities, and shareholders’ equity.
Cash Flow Statement: Details cash inflows and outflows from operations, investments, and financing.
Management Discussion and Analysis (MD&A): Offers management’s perspective on financial results, market conditions, and future outlook.
Investors should focus not just on the numbers but also on guidance—the company’s forecast for future earnings and revenue. Often, a stock’s reaction depends more on the outlook than the past quarter’s performance.
4. Analyst Expectations and Market Reactions
Before companies release earnings, analysts issue forecasts based on their research. These forecasts include:
Consensus EPS estimates
Revenue projections
Profit margins
Future growth guidance
When the actual results are released, investors compare them to these estimates. The difference between actual and expected numbers—called an earnings surprise—can lead to sharp market reactions.
For example:
Positive Surprise: Company reports higher EPS or revenue than expected → stock may rally.
Negative Surprise: Company reports lower-than-expected results → stock may decline.
In-line Results: When results match expectations, the stock may remain stable or react mildly depending on market mood.
However, sometimes even a positive surprise doesn’t lead to gains if investors believe the stock was overvalued or if the company’s guidance disappoints.
5. Sector-Wise Earnings Focus
Different sectors react differently to earnings:
Technology: Focuses on user growth, product innovation, and profit margins. Companies like Infosys or TCS are judged by deal wins and revenue growth in digital services.
Banking and Finance: Analysts track net interest margin (NIM), non-performing assets (NPAs), and credit growth. For instance, HDFC Bank’s quarterly results are seen as a benchmark for the Indian banking sector.
FMCG (Fast-Moving Consumer Goods): Earnings are influenced by consumer demand, input cost inflation, and pricing power.
Energy and Metals: Global commodity prices play a major role in determining profitability for companies like ONGC or Tata Steel.
Automobile: Investors look at sales volume, production costs, and export growth.
Monitoring sector earnings helps investors identify which industries are thriving or struggling, providing clues for portfolio rotation or sectoral allocation.
6. Earnings and Broader Economic Indicators
Corporate earnings don’t exist in isolation. They often mirror broader economic conditions such as:
Interest rates: Rising rates can increase borrowing costs, reducing corporate profits.
Inflation: High inflation affects consumer spending and input costs.
Currency fluctuations: Export-driven firms benefit from a weaker domestic currency.
Economic growth: GDP expansion often translates into stronger corporate revenues.
Thus, during earnings season, analysts not only evaluate individual company reports but also gauge the overall economic direction. For example, widespread earnings growth across industries may suggest a healthy economy, while declining profits can signal an economic slowdown.
7. How Investors Use Earnings Data
Investors and traders use earnings data for different purposes:
Long-term investors assess whether a company’s earnings growth is sustainable and aligns with their investment horizon.
Short-term traders use earnings announcements as catalysts for price movements, often engaging in earnings trades.
Institutional investors evaluate earnings quality and consistency before making large-scale portfolio decisions.
Key metrics such as Price-to-Earnings (P/E) ratio, Earnings Yield, and PEG ratio (Price/Earnings to Growth) help investors assess whether a stock is overvalued or undervalued relative to its earnings potential.
8. Earnings Surprises and Market Volatility
Earnings announcements often lead to heightened volatility. Even small surprises can lead to double-digit price swings within minutes. Traders prepare by adjusting positions or using derivatives like options to hedge risk. For example:
Options traders use strategies such as straddles or strangles to profit from volatility.
Portfolio managers may rebalance holdings to reduce exposure to uncertain earnings outcomes.
Because of this volatility, the earnings season is sometimes referred to as the “trader’s season,” as it offers numerous short-term opportunities.
9. Global Earnings and Market Correlation
In a globally connected market, major companies’ earnings reports can influence not just domestic indices but also global sentiment. For example:
Strong results from U.S. tech giants like Apple or Microsoft can boost global technology stocks, including Indian IT firms.
Weak earnings in Chinese manufacturing can signal slowing demand, affecting commodity and energy stocks worldwide.
Therefore, investors track not only local earnings but also international reports to anticipate sector-wide or cross-market movements.
10. Conclusion: The Broader Picture
Focusing on key earnings provides invaluable insight into the health of both companies and the overall economy. Earnings season is more than just a reporting period—it’s a reflection of corporate resilience, consumer demand, and market confidence. Successful investors don’t merely react to earnings but interpret them within the larger context of economic trends, sectoral shifts, and market expectations.
By analyzing revenue growth, profit margins, and forward guidance, one can identify both opportunities and risks early. In essence, earnings reports are the heartbeat of the stock market—each one revealing the rhythm of corporate success and the pulse of the economy. For those who understand and anticipate these movements, earnings season can be one of the most rewarding times in the financial year.
