Viewing Deep Preview on Fibonaccisjust now
Hey Everyone,
Today we are again with a lot of information and a bunch of topics, so consider following us for regular ideas and market updates
Let's go Strictly into the idea
So In the last idea we covered an overview but now lets cover a detailed view and even learn about Fibonacci Extensions, Fibonacci Number and Lines and more and more.
What Are Fibonacci Retracement Levels ?
Fibonacci retracement levels are horizontal lines that indicating where support and resistance can take place . Each level is having their own percentage. The Fibonacci retracement levels are 78.6% , 61.8% , 23.6% and 38.2% . But the most working levels of a Fibonacci are 38.2%, 61.8% and 78.6% . The indicator is very useful because it can be drawn easily and it can tell you many thing such as support and resistance . It can be drawn between high and low where the lines form is your support and resistances .
What Are Fibonacci Extensions ?
Fibonacci extensions is a tool that can be used to target Profit or approximate how far a price should travel after a pullback ends . Extension levels are also the areas where the price may reverse
These levels are based on Fibonacci ratios . Common Fibonacci extension levels are 261.8% , 200% ,161.8% , 100% , and 61.8% .
What Is the Fibonacci Number and Lines ?
The Fibonacci Numbers and Lines the sequence of numbers , is a slowly increasing series where every number is the equal to sum of the preceding two numbers .
We will meet you very soon so consider following you can unfollow us any time
Thanks for reading it and giving it your time
Bye 😁
Contains image

Price is what you pay, but value is what you getWarren Buffett is the most successful stock investor in the history of the world. Of course, which we know now. "The Oracle of Omaha" - that's what fans of his "magical instinct" call Buffett. But is that the point?
As an 11-year-old child, little Warren was inspired by the possibilities of the stock market and invited his sister to participate in his first investment. These were preferred shares of Cities Service. The sister agreed to take the risk and Warren bought 3 shares at $38.25. But then, the wave of enthusiasm turned to disappointment and guilt - the shares fell to $27. Buffett's first investment "enterprise" lost 29% of the amount of investments that were borrowed. We can only imagine how the young investor felt at that moment, but I think this feeling is familiar to many: positive expectations clashed with the harsh reality of the stock market. Warren didn't sell shares. But when the price for them reached $40, he did it instantly. Apparently, considering this whole undertaking a mistake. The income was 4.6%, the sister received her money back. Everything worked out. Surprisingly, Cities Service's share price rose to $202 a few days later. Or +428%, Warren!
The entire subsequent history of Warren Buffett confirms that he drew the right conclusions from the experience of his childhood. He realized that the price on the stock exchange may not reflect the value of the company itself. Buffett began to study accounting, the principles of fundamental analysis of enterprises, the ideas of Benjamin Graham. This allowed him to develop an approach that consisted in determining the real value of the company, different from the one that we see on the stock exchange.
"Price is what you pay, but value is what you get".
From myself I will add: and if the value is higher than the price - such an investment is considered reasonable.
In the chart above, the price history of Buffett's main holding company, Berkshire Hathaway. As well as the S&P500 index. As you can see, his company "overtakes" the index, which means it shows much better performance than the average value of 500 US companies.
Perhaps, in addition to deep analysis of the companies' business, Buffett's unique investor instinct helps, I don't know. But the fact that he is a real Wizard of our time is an indisputable fact for me.

Black Friday giveaway - Win a Pro, Pro+, and a Premium plan!Hey everyone! 👋
As you may know, we are having our Black Friday sale in the latter half of this month. So, to celebrate this, we are giving away a Pro, a Pro+, and a Premium plan to you, our community of traders and investors.
All you have to do is subscribe to our weekly newsletter and join the family of over 2.9 million readers. If you’re already subscribed, keep reading to learn how you can win.
What is our weekly community newsletter?
Our weekly newsletter is built for one purpose: to keep you up to date in the markets. We include educational posts and ideas from our community, top scripts, an earnings calendar, an economic calendar, and more to prepare you for each week.
How to subscribe to our weekly newsletter?
1. Go to the top right-hand side of your screen, click on the display picture, and then select “ Profile settings ”.
2. Then click on the “ Notifications ” tab.
3. Once you open the notifications, you will see various options under the “ Email preferences ” tab. Just check the “ Weekly digest ” option and save changes. That’s it, you are good to go!
4. Once you are done subscribing to the newsletter, just sit back, and relax. We send our newsletter each Monday morning and we’ll be sharing the contest details. Make sure to open the next newsletter! Set a reminder for Monday at 9 AM.
When you receive our next newsletter, follow the instructions and you will be entered for a chance to win. We look forward to seeing you. Oh, and please feel free to send us any feedback about our newsletter. We especially want to hear if you enjoy it or if there’s anything you would like to see added!
Let’s go! ❤
– Team TradingView

INSIDE BAR STRATEGYAn “inside bar” pattern is a two-bar price action trading strategy in which the inside bar is smaller and within the high to low range of the prior bar, i.e. the high is lower than the previous bar’s high, and the low is higher than the previous bar’s low. Its relative position can be at the top, the middle or the bottom of the prior bar. So now come to the theory of inside bar of how to take trade is The classic entry for an inside bar signal is to place a buy stop or sell stop at the high or low of the mother bar, and then when price breakouts above or below the mother bar, your entry order is filled. It’s worth noting that these are the ‘classic’ or standard entry and stop loss placements for an inside bar setup, in the end, experienced traders may decide on other entries or stop loss placements as they see fit.
Stop loss placement is typically at the opposite end of the mother bar, or it can be placed near the mother bar halfway point (50% level), typically if the mother bar is larger than average. So I am sharing the entry and the Stop loss through the pictures I am sharing below.

'LEAP' the 'GAP' with the knowledge !!!Definition of a Gap:-
- Gap is a space left behind by a script in its price chart.
- It is the area of discontinuity price in the respective script.
- The reason may be anything but generally it occurs due to sudden changes in the sentiment of the market due to some events or news related to the particular script.
Types of Gaps:-
1. Common Gaps -
These gaps are not so certain to be considered. They are visible casually and almost every day as we have seen Nifty gaps up or down daily without any event or news. They have a high tendency to be filled (price generally comes back to that gap).
2. Breakaway Gaps -
A much more significant gap indicates the start of a new trend. Often seen at resistance or support points for example a stock is trading in a small band bounded with resistance and support and suddenly breaks the band with a gap on either side, now this gap indicates the start of the new trend which is according to the level which is broken.
Higher volumes at the gap point further confirm the move.
3. Runaway Gaps -
Runaway gaps are quite similar to the above one but, the major difference between them is runaway gaps are seen in the middle of the trend and breakaway gaps are seen before the trend. This gap indicates the strength of the trend and confirms the buying/selling interest in the stock.
This gap generally occurs in aggressive buying/selling interest due to news or events.
4. Exhaustion Gaps -
These gaps occur at the stage of exhaustion of the trend i.e. the trend is very close to finishing. If spotted correctly it could provide you exit at a very sweet spot. It is a typical sign of trend reversal. It generally occurs after the spike in the price of the stock.
This indicates that the market players are not interested to take the position at such a high/low price. The volumes would be unusual in this case.
My Observation: Breakaway and Exhaustion gaps can be spotted with help of RSI, if you RSI at choppy levels i.e. 40-60, and a significant gap is formed it is generally a breakaway gap. And if RSI is at extreme levels i.e. 15 or 85 and a significant gap is formed it is usually an exhaustion gap.

Rounding Top patternHey everyone! 👋
Last week, we wrote about the "Rounding bottom" pattern. If you missed last week’s post, you can catch up here:
Today we are going to cover the "Rounding top" pattern along with a few examples.
Please remember this is an educational post to help all of our members better understand concepts used in trading or investing. This in no way promotes a particular style of trading!
The post will shed some light on the following topics:
➡ Basics and identification of the pattern
➡ Components
➡ Important aspects
What is a Rounding top pattern?
• A rounding bottom is a bearish reversal pattern that resembles the shape of the inverted "U".
• Rounding top pattern occur at the end of long uptrends and indicate a potential reversal.
• The pattern is also referred to as an inverted saucer due to its resemblance to an inverted saucer.
• Although, the volume and price move in sync but in practice, this can vary widely.
• When the price moves down from the neckline, it indicates weakness and suggests that the stock may begin a new downtrend.
Components of a Cup and Handle pattern:
A rounding bottom pattern can be divided into three main parts.
• Advance
• Formation of the base
• Decline
Important aspects:
1. Prior Trend: Since it is a bearish reversal pattern, the prior trend must be an uptrend. The top of a rounding bottom should ideally mark a new high or reaction high. The stock may trade sideways or flat for a long duration before the formation of the pattern.
2. Advance: The advance that leads to the formation of the high, can take a variety of forms. Sometimes, the up move has many whipsaws while other times, the stock may just trade flat.
3. High: In general, the pattern resembles an inverted "U" shaped top. However, it can also resemble an inverted "V" or an "M," but the high should not be too sharp. In addition to this, there is always a possibility of a new high due to a buying climax.
4. Decline: In general, the formation of the right half of the pattern should take about the same amount of time as the left half. This means that the down move of the highs should take about the same time as the up move. Moreover, the decline shouldn't be too sharp, or else there is a possibility of a bear trap.
5. Breakdown: The pattern is confirmed once the price breaks and sustains below the neckline. The price may return to the neckline to test for the supply before continuing downwards.
6. Volume: In general, the volume levels should be
- High during the up move
- Low during the formation of the base
- Rising during the down move
However, these are only guidelines and should not necessarily be taken at face value.
7. Target: Using the measurement objective, the target comes out to be equal to the depth of the base. It can be measured by calculating the distance between the bottom of the base and the neckline.
8. Stop-loss: Ideally, the stop loss is placed at the highest point of the base. But if the price oscillated up and down a number of times near the neckline, the stop-loss can also be placed above the most recent swing high.
Exhibit: Rounding top pattern with a failed breakout
Thanks for reading! As we mentioned before, this isn't trading advice, but rather information about a tool that many traders use. Hope this was helpful!
See you all next week. 🙂
– Team TradingView
Feel free to check us out on Instagram and YouTube for more awesome content! 💘

Different Methods to Identify Perfect Entries with ConfluenceBasics of Trading and the areas of interest of every trader to have minimum knowledge to understand the market and its movement.
Volume Based Entries
Basics of Volume When the price is trending volume will be above volume moving average that will be considered as trend, when volume is too high in a session thats higher than 3x to volume moving average that will be considered as climax which means maximum orders are filled in the exsisting trend. Apart from stocks if such Climax pattern in volume in any format is seen then consider there might be a reversal soon. If one is trading in the stocks you get to see this ultra high volumes in gap ups and gap downs, now you will have to know what sort of gap it is to take entries which we will discuss in the Gaps later.
--------------------------------------------------------------------------------
Gaps
Gaps theory needs to be understood properly, over 4 kinds of Gaps are found in charts. Simple understanding follows :
Common Gaps : Normal gaps that happen every day with in a ranging market
Break Away Gaps : If a range/pattern/Support or Resistance is broken with a gap that is called break away gap. This sort of gap happens in the early stages of trend.
Running Gaps : After breakaway gaps rest of the gaps if happened towards the trend is called running gaps. as long as there is an exhaustion gap.
Exhaustion Gaps : This Exhaustion Gap happens either up or down after an up trend or the same in a down trend. These gaps gets filled giving an idea that the trend has ended.
Consolidation Areas
Consolidation areas or the trading ranges are to be considered as Support & Resistance areas to identify for patterns like Triangle, wedge, flag, pennant, or rectangle patterns. good areas to look for gap up or down and volume to identify breakout for the next move or plan for the next session.
Fib Extension & Retracements
Fibonacci extention and retracements is the basic knowledge that any trader who is willing to learn about technical analysis should be considering learning in depth, its a basic tool that gives you a lot of info, Basic knowledge to know is Fibbonacci Retracement is used to identify the entry and Extension is used to identify the exit. levels of interest are called the golden ratio i;e: 38%, 50%, 62% this is where majority of the reversals happen, these can be considered as Support & Resistance zones to look for breakout entries
Support & Resistance
Every traders nightmare is to understand or identify S&R in the initial days of your trading is not because you cannot ... it is because you are too curious, anxious, exited to enter into a trade, once you calm down and try to understand the market its not that hard to identify them ... S&R areas are the reversal zones or breakout zones it is going to be a big topic if tried to explain the whole concept so lets just stick to basics and use pivot high and low and FIB levels as your support and resistance zones for now.
Trendline Breakout
These are first thing that any trader learns try to master them, a perfect trendline is considered a strong support in uptrend or resistance in downtrend when it has respected this line for least 2 times from its start point. A breakout gives you and opportunity to enter in to a trade.
Elliott Wave
This is not considered as entry point in the initial stages of learning but one should know the basics of elliott wave to identify the trend we are in by looking at the leg we are in and you can calculate the trend by given wave length through fibonacci ratios. Only thing that you need to know is that market doesnt move in a straight line like you see in elliott wave picture above there will be waves with in waves.
Try to bring all these together as confluence to understand the market move and take entries.
Note : Train the eye to identify the structure, then comes the logic and explanation.

📚Learn More💰Earn More - Inverse Head and Shoulders in UNIUSD📚 LEARN MORE
💰 EARN MORE
Inverse Head and Shoulders Definition:
A head and shoulders pattern is also a trend reversal formation.
It is formed by a Valley (left shoulder), followed by a Lower Valley (head), and then another Higher Valley (right shoulder).
A “Neckline” is drawn by connecting the highest points of the two Peaks. Neckline resistance does not need to be strictly horizontal.
This illustrates that the downward trend is coming to an end.
When a Head and Shoulders formation is seen in a downtrend, it signifies a major reversal.
The pattern is confirmed once the price breaches the neckline resistance.
In this example, we can easily see the head and shoulders pattern.
How to Trade the Head and Shoulders Pattern:
ENTRY:
we put an entry order above the neckline.
TARGET:
We can also calculate a target by measuring the lowest point of the head to the neckline.
This distance is approximately how far the price will move after it breaks the neckline.
❤️ If you find this helpful and want more FREE forecasts in TradingView
. . . . . Please show your support back,
. . . . . . . . Hit the 👍 LIKE button,
. . . . . . . . . . Drop some feedback below in the comment!
❤️ Your Support is very much 🙏 appreciated!❤️
💎 Want us to help you become a better Forex trader?
Now, It's your turn!
Be sure to leave a comment let us know how you see this opportunity and forecast.
Trade well, ❤️
ForecastCity English Support Team ❤️

'SWING' your losses into profits with 'SWING' trading strategiesIn prior posts, we have covered some great teachings about the market and,
in this post, we will elaborately cover the swing trading strategies. Let's start !!
->Definition of swing trading -: Swing trading is generally referred to as a trade carried out for a short time. Swing traders do not wait
till the price action opposes their direction, they are known for their prior moves.
They are good at identifying the shifts in market trends with the help of various techniques which are explained throughout this idea.
Swing trading strategies include the use of Fibonacci, Bollinger Bands, Channel Trading, Moving Average, MACD crossover, and better
understanding of chart patterns like Head & Shoulder, Flag, and Triangle Patterns.
We will discuss chart patterns, later on, now let's focus on the indicator strategies.
- >Swing trading strategies -:
->Fibonacci Retracement: The stock price tends to retrace, and swing traders use this retracement as an opportunity to enter a trend.
The retracement levels could be identified using Fibonacci Retracement, all you need is to identify the prior trend and if the price retraces to the 0.618 level and
again resumes the trend jump on it and ride the position till it reaches 0.236 level.
->Bollinger Bands : Most probably, the stock price tries to move in the Bollinger band, which is used by swing traders to initiate and terminate their position.
Firstly you need to identify the major trend, let's suppose it's bearish than when the price reaches the upper bound and there is a formation of a bearish candle
you could initiate a short position also when a bearish candle is formed at the median, there also you can initiate a short position.
->Channel Trading: Sometimes, stock price trades in a channel now this channel is used by swing traders i.e. when the trend is bullish they try to take long
position at the lower range of channel and book partial profits on median and wait for the price to reach the upper end.
->Moving Average: Here traders identify the major trend and take position according to it, with help of crossovers they generally prefer 10DEMA crosses 20DEMA.
->MACD : This is a simple strategy where the trades are initiated when there is MACD crossover but the cross should correlate with the trend.
My Observation-: These strategies could be more accurate if used to trade with the trend, i.e. if the stock is in an uptrend only take positions for a positive signal and just avoid negative signals.
Another basic strategy is to take a position when a script moves above the swing high or below the swing low, here the only thing to ponder is to manage your risk. Don't take over positions understand your risk appetite then take positions.

You Might Have Heard A Lot About This Hey Everyone,
Today we are again with a lot of information and a bunch of topics, so consider following us for regular ideas and market updates
Let's go Strictly into the idea
So What is a Fib Retracement ?
Now You might think it is just making lines and deciding on support or resistance but it's way too far, as shown in the thumbnail " The Major Levels " it means the levels that can be a support or resistance and can be found easily as shown.
So Now we have learned What is Fibonacci Retracement, Now Let's Know How to use It ?
To use fib retracememts we need to first find a low and a high level and then set 1.000 and 0 and then just seek at The Major Levels to Trade.
This was just an overview if you want a more detailed idea in which we will discuss Fibonacci Extensions , Fibonacci Number and Lines tell me in the comments and i will do for sure
Thanks
Bye - Bye

One candlestick pattern - The MarubozuHey everyone!
In this post, we are going to talk about a candlestick pattern known as Marubozu, along with a few exhibits that may help you solidify your understanding of this pattern.
Please remember this is an educational post to help all of our members better understand concepts used in trading or investing. This in no way promotes a particular style of trading!
The candlestick charts offer a quick picture into the psychology of buyers and sellers. Before proceeding further, a few things to keep in mind:
→ A bearish candlestick indicates the opening price of the session being higher than the closing price.
→ Similarly, a bullish candlestick indicates the opening price of the session being lower than the closing price.
→ The shadow at the top and bottom represent the high and low for the session.
→ The size of the real body is indicative of the strength of the trend.
What is a Marubozu pattern?
A Marubozu is a candlestick with a full real body and no shadows. This solid body indicates a strong trend, be it in any direction. The name Marubozu comes from the Japanese and means "close-cropped", indicating a candle with no shadow.
Marubozu can be divided into two types, depending on the bias.
∎ Bullish marubozu
∎ Bearish marubozu
A Marubozu can appear anywhere in the chart irrespective of the prior trend; the trading implication remains the same.
⚠️ Please notice the textbook definition of a Marubozu is a candle with no shadows. However, in practice, the ideal setups rarely occur. Hence, there is a little bit of wiggle room on either side.
🟩 Bullish Marubozu
→ In a bullish Marubozu, the lack of the upper and lower shadow indicates that the low and high are equal to the open and close, respectively. However, there may be some shadows in reality, therefore we must be versatile within limits.
→ A bullish Marubozu indicates that market participants are willing to buy the stock at any price point throughout the day. As a result, the stock closes near the session's high.
→ In general, the occurrence of a bullish Marubozu indicates that the sentiment has strongly shifted to the upside and we can see higher prices in the coming sessions. Hence a trader should look for buying opportunities whenever the price pulls back to lower levels.
Exhibit 1: Bullish Marubozu
Exhibit 2: Bullish Marubozu with subsequent uptrend
🟥 Bearish Marubozu
→ In a bearish marubozu, the open price is almost equal to the high whereas the session closes near the low price.
→ A bearish Marubozu indicates a strong bearish sentiment because the market participants are willing to sell the stock at any price point throughout the day.
→ In general, the occurrence of a bearish Marubozu indicates that the sentiment has strongly shifted to the downside and we can see lower prices in the subsequent sessions. Hence a trader should look for selling opportunities whenever the price pulls back to higher levels.
Exhibit 1: Bearish Marubozu
Exhibit 2: Bearish Marubozu with subsequent down trend
Thanks for reading! Hope this was helpful!
See you all next week. 🙂
– Team TradingView
Feel free to check us out on Instagram , Telegram , and YouTube for more awesome content! 💘


📚Learn More💰Earn More - Inverse Head and Shoulders in NEARUSD📚 LEARN MORE
💰 EARN MORE
Inverse Head and Shoulders Definition:
A head and shoulders pattern is also a trend reversal formation.
It is formed by a Valley (left shoulder), followed by a Lower Valley (head), and then another Higher Valley (right shoulder).
A “Neckline” is drawn by connecting the highest points of the two Peaks. Neckline resistance does not need to be strictly horizontal.
This illustrates that the downward trend is coming to an end.
When a Head and Shoulders formation is seen in a downtrend, it signifies a major reversal.
The pattern is confirmed once the price breaches the neckline resistance.
In this example, we can easily see the head and shoulders pattern.
How to Trade the Head and Shoulders Pattern:
ENTRY :
we put an entry order above the neckline.
TARGET :
We can also calculate a target by measuring the lowest point of the head to the neckline.
This distance is approximately how far the price will move after it breaks the neckline.
❤️ If you find this helpful and want more FREE forecasts in TradingView
. . . . . Please show your support back,
. . . . . . . . Hit the 👍 LIKE button,
. . . . . . . . . . Drop some feedback below in the comment!
❤️ Your Support is very much 🙏 appreciated!❤️
💎 Want us to help you become a better Forex trader?
Now, It's your turn!
Be sure to leave a comment let us know how you see this opportunity and forecast.
Trade well, ❤️
ForecastCity English Support Team ❤️

BankNifty-Twist & Turn-Will it die on Euphoria? Island ReversalDisclaimer:
This is not an Investment Advice. Trading leveraged products carries a high degree of risk and you could lose more than your initial deposit.
"Bull markets are born on pessimism, grown on skepticism, mature on optimism and die on euphoria. The time of maximum pessimism is the best time to buy, and the time of maximum optimism is the best time to sell." -John Templeton
What Is an Island Reversal?
An island reversal is a price pattern indicating grouping of days on either side by gaps in the price action.
This price pattern occurs when two different gaps isolate a cluster of trading days.
Pattern usually indicates reversal in trend - which can be short term or long term.
Check the charts
7th Sep 2022 Gap down opening as shown in circle shape & 8th Sep 2022 - Possible Gap up opening in next trading session
Check the Snapshot / Image - Island Reversal Pattern
Try to relate with the current chart of BankNifty. Check yourself where are you in the chart & what could you expect if something similar has to repeat.
Thanks for reading

Thanks to the greatest teacher 'THE MARKET' !!!This publication is dedicated to thanking one of the greatest and strict teacher the ‘Stock Market’.
The lessons of the market not only help one to succeed in the stock market but also helps throughout life.
This 5th September i.e. Teacher’s day let’s have a detailed look at 5 Great Learnings of Stock Market and thank her for these
life-awakening learnings.
-> Discipline: The most important teaching in markets is discipline. As the wording of Jim Rohn states “Discipline is the bridge between goals and accomplishment” stock market develops that bridge.
The market has its way of teaching and punishing, I think all of us had witnessed its punishment whether in form of not keeping stop loss or not following your trade system.
Discipline plays a vital role in an individual’s life. As said by Horace “Rule your mind or it will rule you. ”The disciplined person has the power to rule his mind whereas others lack this ability.
-> Patience: Another gem cultivated by markets in our personality and harvested by us throughout life. One of the familiar names of our school time Benjamin Franklin says “He that can have patience can have what he will.” market first teaches this gem to us then offer us what we wish.
We all have at least once missed taking the real profit by not waiting till the target is achieved but leaving the trade in midway though it was moving in our direction the reason is we lack patience and the market gives profit only to eligible ones so, either you be eligible or market will make you fit for it by its own way.
-> Ability to conquer 3 gateways of hell: According to ‘The Bhagavad Gita’ there are 3 gateways to hell i.e. Lust, Greed, and Anger.
The market helps its students in conquering those strong emotions. The beginner in the stock market has a strong lust for making money very quickly and greed for making lots of money without that kind of effort and when he fails in his motive anger gets born in his personality from where degradation or hell starts.
Those few people who still have not left the hands of the market get the knowledge to conquer those emotions throughout their journey in markets.
-> Faith in yourself: One of the famous quotes by Ralph Waldo Emerson is “The best lightning rod for your protection is your own spine.” market strengthen that spine so that we as its student can withstand any kind of storm in our life.
Before taking any trade based on your analysis requires self-belief on the early days people hesitate but later they rely on their analysis because the market has taught them self-belief.
-> Crush your arrogance: Market is popular in crushing the arrogant guy along with this removing any trace of arrogance in his personality. The famous wording says “Close some doors today. Not because of pride, incapacity, or arrogance, but simply because they lead you nowhere.” market as a kind teacher keep a keen eye on her student for arrogance as she knows that as soon as arrogance arises person starts his fall.
All of us had witnessed that whenever we start thinking that we have mastered markets and try to neglect discipline market slaps us badly to awaken us that we are still newbies and still had to learn a lot.
According to me, these 5 are the most valuable learnings of markets but if you have any learning of market much valuable in your life please mention in comments.
Also, comment which subjects teacher in your school life is as strict as the stock market, for me its 2nd language(Hindi) teacher.
Finally great thanks to 'The Market' for these great teachings.
The stock market gives success only to eligible ones so, either you be eligible or the market will make you fit for it in its own way.

Trading Decision Flowchart - Checklist Before placing tradeTrading Decision - Checklist Before placing trade
Traders always encounter a thought when analyzing their trade history - I would have been in this much profit if I had avoided this particularly trade/trades(mostly losing trades). There are many reasons behind why traders take up some trades which they should not be taking - reason could be fear of missing out, recovering losses, revenge trading or simply boredom trade.
One of the essential thing needed to become a good successful trader is to avoid certain trades where
- You don't have conviction
- You are Over-trading/Revenge trading
- You have already lost your day's worth of losing limit you have set for yourself
- You don't have proper setup
- You don't have a Good Risk Reward Ratio
- Target does not look easy
- Trade does not fit on your trading rules
- and so on.
Traders should try to avoid these trades- one such tool which will be useful will be a trading checklist - which should be checked before placing any trade. This idea is to share one such checklist that I use for trading NIFTY/BANKNIFTY options.I hope this is useful to some folks out here.
Cheers,
Santosh

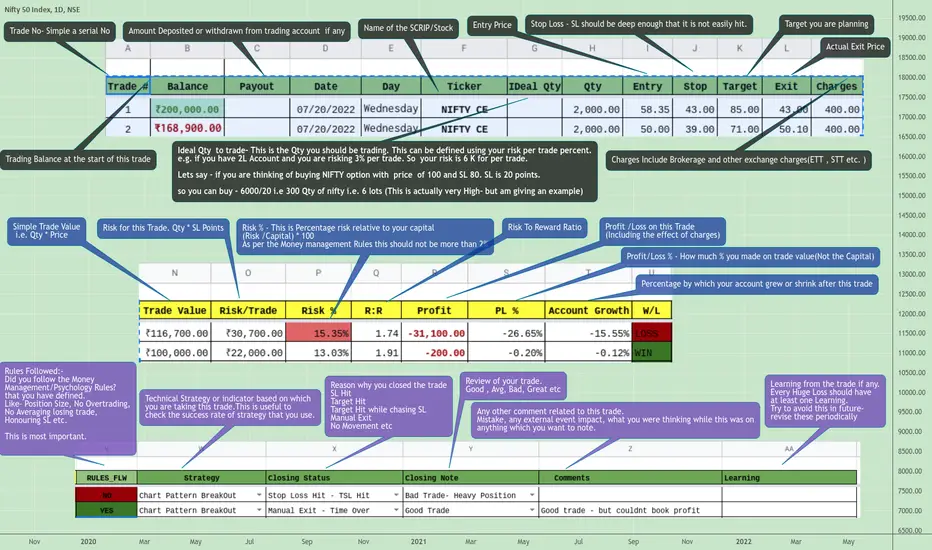
Maintaining Trading Journal.Maintaining Trading Journal :-
Maintaining Trading Journal is one of the key aspect of becoming a good trader. This is something which I have struggled to do- I always planned to keep a trading journal but after sometime I failed to maintain it or continue it(Mainly due to the losses that I incurred in between which am really not motivated to write down).
However after some time I have realized that without a journal or written records I tend to repeat the same mistakes again and again. So after spending some time on how to make a journal and looking at several templates online/copying them - I have set one for me.
This idea is to share the template to everyone.
There are three sections of journals:-
1. Trade inputs :- Inputs related to trade
2. Technical Characteristics - Columns which can be calculated using a formula and they can give some insights.
3. Takeaways from the trade:- Kind of diary to record your thought process around this trade. Strategy/ Rules/Reasons of exit/Mistakes /Learnings etc.
I hope this can help you to some extent.
** Please Note:- Content entered there is completely random and sample data.
Types Of Trader (What Types Of Trader Are You? )Thank You For Giving Giving Me So Much Support Hopefully You Also Give Support To This Idea Lets Move To The Idea And Tell Me Which Type Of Trader You are Tell Me In the Comment.
There Is Four Type Of Trader.
The First Type Of Trader Is Day Trader: Day trader refers to the market operator who indulges in day trading. A day trader buys and subsequently sells financial instruments like stocks, currencies, or futures and options within the same trading day, which means all the positions that he creates are closed on the same trading day.
The Second Type Of Trader Is Swing Trader: Swing trading is a style of trading that attempts to capture short- to medium-term gains in a stock (or any financial instrument) over a period of a few days to several weeks. Swing traders primarily use technical analysis to look for trading opportunities
The Third Type Of Trader Is The Position Trader: A position trader buys an investment for the long term with the expectation that it will appreciate in value. This type of trader is less concerned with short-term fluctuations in price and the news of the day unless they alter the trader's long-term view of the position.
And The Last Types Of Trader Is Investor: An investor is an individual that puts money into an entity such as a business for a financial return. The main goal of any investor is to minimize risk and maximize return. It is in contrast with a speculator who is willing to invest in a risky asset with the hopes of getting a higher profit.
Thank You For Giving Me Your Precious Time I Will Meet You In The Next Idea And Pls Me Your Full Support Bye Bye For Now I Will Meet You In The Next Idea Pls Like And Follow Me.

The Powerful Indicator that can lead you to SuccessHello Everyone,
Today we are again with a New Topic CRS (Comparative Relative Strength)
So Lets Start
What is Comparative Relative Strength
This chapter will share insights on a valuable lesser-known form of market analysis referred to as comparative relative strength ( CRS ). This is the study of one stock or sector in relation to other sectors or the overall market. This technical study can give a better look at where the money may or may not be flowing. Comparative relative strength is not to be confused with Welles Wilder's relative strength index or Williams Percent “R” indicators. Both of these technical tools are considered oscillators and give an indication if the stock or security is overbought or oversold relative to its past price action over a specific period of time.
WHAT IS IT USED FOR?
In using CRS , we take one market and divide it into another, and the result is a continuous close line graph. Typically, the numerator is the product that we are comparing against the denominator or benchmark. This technique is used to uncover or detect any hidden weakness or strength when analyzing one company against another in the same sector or comparing an individual stock against its related industry sector. We can also use this technique to compare individual stocks or sectors to the benchmark stock index like the Standard & Poor's ( S&P ) 500, the Dow Jones Industrial Average , the Russell 200, the Nasdaq 100, or the Nasdaq Composite . Why do traders use this analysis method? To see where the money is flowing to help confirm a trading bias. To see if a stock or sector is outperforming compared to its benchmark. To see which are the weakest sectors compared to the benchmark. As an early warning signal.
Pair Trading
A pair trade simply consists of buying one company and simultaneously selling short another similar or “like” company with the expected results to see the company one bought outperforming the company that was sold. Keep in mind that the key word here is performance. As you will see, markets can move higher or lower, but one product may not move up or down as far or fast compared to the like market. This is why a spread or relative strength chart may show an increase or decrease in the trend.
Example of Pair Trading :-
We saw a couple of months ago that when Ronaldo moved two Bottles of Coke, The share price of coke started to a downfall in this situation Pepsi will get a much profit than coke so we will select Pepsi to buy
CREATING THE CHARTS
Setting up your charting platform is relatively easy. A basic relative chart is created as a spread chart. Here are a few reasons why you want to look at a comparative difference chart. Comparative analysis or pairs-trading charts are easy to create. Again, we're only looking at the price relationship of one product against another. Logically, since the price is dictated by the laws of supply and demand , you can anticipate that when one market outperforms another, it will do so over a period of time, which lends itself to a trending condition.
As you can see with the Help of the Moving Average and the Breakout of Trend Line in CRS ( Comparative Relative Strength )
This shows with the potential of moving up The dead Company Tata power shows a big bullish than Power grid
Trader's Tip
1. When placing a spread trade, one should remember to enter the size of each side of the trade basis, and the notional value of each side of the spread. Spread trades are not necessarily placed on a “one-to-one” basis, such as selling 100 shares and buying 100 shares. In commodity spreads, for example, one platinum contract is 50 ounces and one gold contract is 100 ounces. Therefore, as a correct spread trade, a ratio of two contracts of platinum versus one contract of gold would be the correct trade per spread order. As for the S&P 500 (ES) versus the Nasdaq 100 (NQ), if the E-mini S&P is valued at 1,340 and the index is priced at $50 times the index, then the notional contract value is $67,000. At the same time, if the E-Mini Nasdaq 100 contract is valued at 2605 and the index is priced at $20 times the index, then the notional contract value is $52,100. Therefore, a correct ratio for a spread trade between the ES and the NQ would be four contracts of the S&P versus five contracts of the Nasdaq
2. Thus, using comparative RS is by definition trading metric. Once again, the question begs: How we can make money using this form of analysis? Spread charts or RS comparisons graphs can give you an idea of the best place to put your money, but perhaps it may help you decide where not to put your money. Using trend-line breaks in the RS charts helps us to uncover what we call divergence between the spread chart and absolute prices. Therefore, make sure you set up your trading platform so that you look at the two different markets that you want to compare against, as well as the spread or the RS chart.
Two definitions of metrics found in Webster's dictionary are
1. The art of metrical composition, which is pertaining to measurement.
2. Combining form means the science of measuring that specified by the initial element.
Automating Signals
Most traders and technicians ask themselves what they can do to improve their indicators so they can respond more quickly to changes in market conditions. The obvious answer is the speed at which the data is received. But for end-of-day analysis, speed is not an issue. With thousands of markets to analyze, it would be nearly impossible to detect signals in all the market combinations, a requirement of using RS analysis. Therefore, it is best to take advantage of computer technology and create an automated scanning feature. How do we create this? By using moving averages on the RS charts themselves. As a rule of thumb, when using moving averages, the shorter the time frame, the more sensitive it is to price changes. I find that using a simple moving average for shorter time periods is effective for using longer time frames. Using a weighted moving average to the nearest close is more effective. For instance, if I'm using a 3- period moving average, I would use a simple moving average . If I'm using 12 or more time periods, I would use a weighted close moving average. In the following examples, I am using a 15-period weighted moving average .
Comparing two significant charts, So that we could find which gives more profit and which gives less
Conclusion
Comparative RS analysis demonstrates the concept of sticking with stocks in the strongest-performing groups—that's not to say that you can't make money in an overall rising stock market, but your best rate of return or performance will be with the stocks that are tied to strong industry groups. It also helps identify the weaker sectors, so you may figure out what to avoid. That way you are not putting good money to use on a less productive market. I don't want to make this out to be the end-all form of analysis. As I will discuss, there is no one single holy grail of market analysis tools or techniques; that's why we look for corroborating analysis, such as trying to fine-tune our indicators and finding the need for using a moving average of the spread or RS line in addition to trend line analysis. The coming chapters will show how we can apply other tools and techniques to help pinpoint our price entries as well as exit strategies.
Hope you all Like it
Bye-Bye for now

The Secret of Sokyu Homma Related to Charts Part :- 1Hello Everyone, Today we will be talking about The Secrets of Sokyu Homma Related to Charts
So let's start with
1. The Sokyu Honma's Two Methods
1. The Samini No Den of the Market
2. The Sakata strategies
2. The first Method, The Samini No Den of the Market (The Subjective Part of the Method)
The first part of Sokyu Honma’s method, the Samni No Den of the market, seeks to develop adequate reflexes and the right attitude of a trader in us. Here is the method and its five rules:
The Five Rules :
1. Without being greedy, look at past market movements and think about the time/price ratio.
2. Try to buy a bottom and sell a top.
3. Increase your position after a rise of 100 bags from the bottom or a decline of 100 bags from the top.
4. If your forecast is incorrect, try to recognize your mistake as soon as possible. Then, close your position and stay out of the market for 40 to 50 days
5. Close 70 to 80 % of your positions, if they are profitable, closing what is left after a top or a bottom is reached.
3. Examining the Simple and Powerful Methods
(HOW TO MASTER YOUR TRADING: YOUR FIRST STEP TO SUCCESS)
Rule 1
This rule tells us to measure and study the time/price relationships. Note that this approach was at the heart of Gann’s method, for which an equilibrium between time and price is crucial.
This rule enables us to categorize the movements of the market in terms of time and price. Here is an example: the market has risen x points in y weeks from a historic bottom to a historic top. During this rise, there have been upward movements for each swing of p points and w weeks. Within this same movement, corrections and consolidations are each within a range of d points for a duration of e weeks. We follow the same procedure for the movement from the historic top to the historic bottom. This measuring technique may be applied to any time frame. The rule tells us that we must not be greedy. It is important that we do not try to obtain the maximum possible gain, as indicated by past movements. We must try to win without becoming greedy. In this way, we will avoid the risk of overstaying in the market and seeing our gains disappear. Unfortunately, this is exactly what happens to most traders. Therefore, choose an exit point that will limit your avarice and that, at the same time, is indicated by the market itself. Here, only practice will bring you knowledge. By studying the time/price ratios, you will discover things – the market itself will speak to you. Remember that the only master is the market. Remember also that it is necessary to have a practical attitude – a way to knowledge by doing. I can guarantee that this rule alone will enable you to succeed in the market. The rule has another benefit. It will make you invulnerable. No one else will have knowledge of your tactic. It will be your secret.
Rule 2
This rule does not tell us to buy bottoms and sell tops but to attempt to do it. This is something completely different. Act at the right time. Avoid the temptation to buy when it is already too late. Anxiety and impatience push us toward this kind of behavior. Learn to wait for only the best opportunities.
Rule 3
Increase your position following a rise of 100 bags from a bottom or a decline of 100 bags from a top. This rule indicates a price/volume ratio. For any given price change, there is a corresponding change in volume. Here, the market is inverted because the price was fixed and the volume was variable at the time. A rise of 100 bags means a drop in price. A decline of 100 bags means a rise in price. This rule tells us to increase our position in the direction of the market (i.e. increase our position only if the market continues to rise; we should not increase our position if the market is down unless it progressively declines). It also tells us to increase progressively only until our positions have been completed. For example, if we buy 900 shares, we must break up our buying into several purchases. We buy first, say, 300 shares at one price and the next 300 only if the market goes our way. We buy the last 300 shares only if the market continues to go our way. Do not buy everything at the same time! Exercising patience is a much worthier goal than winning in the market. Thanks to our exercise of patience, we will end up by having a much greater number of winning trades. Someone may argue, ‘But when there is an opportunity, why not place all our positions in the beginning?’ Greed has just made its appearance. A fatal mistake!
Rule 4
In case we are wrong, we must close our positions and stay away from the market for a period of 40 to 50 days. This advice is a nugget of wisdom. It conceals a secret and is a mystery in itself. Even though the meaning of the rule is to refrain from the market activity so that we can have a clear mind, the following literal sense of this rule is excellent. Not only will your mind relax and rest, but also your unconscious will have time to integrate and perfect your strategy and tactic, enabling you to see ‘clearly.’ You will receive insight that only comes as a result of patience and waiting. The secrets of trading will be made clear.5 Once again, we hear a call for patience and a warning to control greed. Understand whoever can!
Rule 5
Close 70 to 80 % of your positions as soon as you have the minimum expected gain. Wait until the end of the movement to close the others. Here, once again, it is studying the market that will tell us when to close each position. Again, this rule is a call for our patience and a warning to keep greed under control. Many traders want to close their positions as soon as they have a small gain. This leads, as a consequence, to achieving big losses and small gains. We must learn to wait and have the courage to see our position develop according to the precise plan that was prepared in the beginning. One must recognize that a plan that was prepared previously will tell us exactly when to close the first 70 or 80 % of our position and when to close the rest – taking into account the risk/reward ratio known and tested in advance. This rule contains a hidden and powerful secret. It is up to you to discover it! Up to this point, we have examined the five rules of the subjective part of the method. Their logic is consistent. Further, the five have a common denominator – a call for patience and to control greed. This is a mastery of self that has, as a result, the mastery of time, because we learn to wait for the right moment, and the mastery of price, since we learn to buy at the right price. There is a rigorous linking of the five rules. The first rule indicates the fundamental principle of the market and its fluctuations in time and price. It tells us to measure them, to measure objectively the natural market movement – its oscillators or swings. Once the extent of this movement is known, the second rule tells us when to take action within these movements. We must wait for the right time. Once we know when to buy and when to sell, we must still learn how much to buy or sell. Rule 3 tells us this. Finally, once we are engaged in a trade, we must know when to exit and close our position with a gain or a loss. Rules 4 and 5 tell us this.
4. In this way, the Samni No Den, the part of Sokyu Honma’s method which consists of the subjective five rules, will have taught us:
1. How to manage time and price.
2. How to manage buying and selling points.
3. How to decide what size of position to take.
4. How to manage losses.
5. How to manage wins.
5. The Second Method, The Sakata Methods (The Objective Part of the Method) SAKATA’S FIVE METHODS AND THEIR CORRESPONDING MARKET PHASES
The ‘five Sakata methods’ belong to the objective part of Sokyu Honma’s method and focus on the structures or phases of the market. There are five structures or basic configurations:
The Five Rules :-
1. San Zan means three mountains and is the triple top.
2. San Sen means three rivers and is the triple bottom.
3. San Ku means a triple gap and refers to the empty intervals between prices.
4. San Pei means three lines and refers to a continuously ascending trend that is composed of three time/price units.
5. San Poh means three rests and refers to a corrective movement within a trend that is made up of three time/price units.
6. Each of these strategies or methods is related to a specific market phase or configuration. These phases are: If You Don't Understand then Refer to the Picture. In the Next Part, We will Give a Complete Representation of It.
Premutation of the Five Phases :-
(a) 1 and 2: turning points, tops or bottoms;
(b) 3: gaps;
(c) 4: trends;
(d) 5: consolidations, or times when markets rest before continuing their trend.

Why holding Nifty50 on Friday over the weekend can be a bad ideaIn this analysis we are just looking at the weekly days at key turn around periods. It seems that Monday tops the list of trend change, having said that this also means option seller is trying to trap people who have taken positions (in the same direction as Thursday) over the weekend. A cut throat theta decay perhaps over the weekend, followed by a trend change on Monday is a sweet spot for sellers.
How can you plan your trade?
Look for key day in previous three swings, and check what are the smart money strategies in terms of basic days of the week. During those days, plan a reversal trade.
Dos and Don'ts for option buyer for Nifty trade setup:
1. Do not hold positions on one day prior to key date - here e.g. Monday so do not hold key overnight for Friday
2. Plan reversals based on monthly swing dates followed by trigger line method or Heikinashi Candle setup
Heikinashi Candle Setup:

Some Major Candlestick Pattern Bullish Engulfing: The bullish engulfing pattern is a two-candle reversal pattern. The second candle completely ‘engulfs’ the real body of the first one, without regard to the length of the tail shadows.
This pattern appears in a downtrend and is a combination of one dark candle followed by a larger hollow candle. On the second day of the pattern, the price opens lower than the previous low, yet buying pressure pushes the price up to a higher level than the previous high, culminating in an obvious win for the buyers.
Bearish Engulfing: A bearish engulfing pattern is a technical chart pattern that signals lower prices to come. The pattern consists of an up (white or green) candlestick followed by a large down (black or red) candlestick that eclipses or "engulfs" the smaller up candle. The pattern can be important because it shows sellers have overtaken the buyers and are pushing the price more aggressively down (down candle) than the buyers were able to push it up (up candle).
Tweezer Top: A tweezers top is when two candles occur back to back with very similar highs. A tweezers bottom occurs when two candles, back to back, occur with very similar lows. The pattern is more important when there is a strong shift in momentum between the first candle and the second
Tweezer Bottom: A Tweezer Bottom occurs during a downtrend when sellers push prices lower, often ending the session near the lows, but were not able to push the bottom any further. Tweezer Bottoms are considered to be short-term bullish reversal patterns that signal a market bottom
Doji: A Doji is a candlestick pattern that looks like a cross as the opening and closing prices are equal or almost the same. The word Doji is of Japanese origin which means blunder or mistake that refers to the rarity of having the open and close price be exactly the same
Evening Star: An evening star is a stock-price chart pattern used by technical analysts to detect when a trend is about to reverse. It is a bearish candlestick pattern consisting of three candles: a large white candlestick, a small-bodied candle, and a red candle.
Morning Star: An evening star is a stock-price chart pattern used by technical analysts to detect when a trend is about to reverse. It is a bearish candlestick pattern consisting of three candles: a large white candlestick, a small-bodied candle, and a red candle.
Hammers: The hammer candlestick is a bullish trading pattern that may indicate that a stock has reached its bottom, and is positioned for trend reversal. Specifically, it indicates that sellers entered the market, pushing the price down, but were later outnumbered by buyers who drove the asset price up.
Inverted Hammers: The inverted hammer is a type of candlestick pattern found after a downtrend and is usually taken to be a trend-reversal signal. The inverted hammer looks like an upside-down version of the hammer candlestick pattern, and when it appears in an uptrend is called a shooting star: What Does the Shooting Star Tell You? Shooting stars indicate a potential price top and reversal. The shooting star candle is most effective when it forms after a series of three or more consecutive rising candles with higher highs.
Spinning Top: A spinning top is a candlestick pattern that has a short real body that's vertically centered between long upper and lower shadows. The candlestick pattern represents indecision about the future direction of the asset. It means that neither buyers nor sellers could gain the upper hand.
Three Black Crows: What Are the Three Black Crows? Three black crows is a phrase used to describe a bearish candlestick pattern that may predict the reversal of an uptrend. Candlestick charts show the day's opening, high, low, and closing prices for a particular security. For stocks moving higher, the candlestick is white or green.
Three White Soldiers: Three white soldiers is a bullish candlestick pattern that is used to predict the reversal of the current downtrend in a pricing chart. The pattern consists of three consecutive long-bodied candlesticks that open within the previous candle's real body and a close that exceeds the previous candle's high
Three inside up: the pattern is a bullish reversal pattern composed of a large down candle, a smaller up candle contained within the prior candle, and then another up candle that closes above the close of the second candle
Three Inside Down: The three inside down pattern is a bearish reversal pattern composed of a large up candle, a smaller down candle contained within the prior candle, and then another down candle that closes below the close of the second candle.

TOP 10 CHART PATTERNS FOR BEGINNERS ?Double Top: A double top is an extremely bearish technical reversal pattern that forms after an asset reaches a high price two consecutive times with a moderate decline between the two highs. It is confirmed once the asset's price falls below a support level equal to the low between the two prior highs.
Double Bottom: A double bottom pattern is a technical analysis charting pattern that describes a change in trend and a momentum reversal from prior leading price action. It describes the drop of a stock or index, a rebound, another drop to the same or similar level as the original drop, and finally another rebound (Same Like Double Top But Work Opposite).
Head And Shoulders: A head and shoulders pattern is a chart formation that appears as a baseline with three peaks, where the outside two are close in height and the middle is highest. In technical analysis, a head and shoulders pattern describes a specific chart formation that predicts a bullish-to-bearish trend reversal.
Inverse Head And Shoulders: An inverse head and shoulders pattern is comprised of three component parts: After long bearish trends, the price falls to a trough and subsequently rises to form a peak. The price falls again to form a second trough substantially below the initial low and rises yet again.
Rising Wedge: A rising wedge is generally a signal as it indicates a possible reversal during an uptrend. Rising wedge patterns indicate the likelihood of falling prices after a breakout through the lower trend line
Bearish Rising Wedge: A rising wedge is generally a bearish signal as it indicates a possible reversal during an uptrend. Rising wedge patterns indicate the likelihood of falling prices after a breakout through the lower trend line
Bearish Expanding Triangle: a bear reversal (an expanding triangle top), does the opposite. Bears are trapped in by a lower low and then are forced out, and bulls get trapped in by a higher high, and both then have to chase the market as it reverses down for the final time.
Bullish Expanding Triangle: A Bull reversal (an expanding triangle top), does the opposite. Bears are trapped in by a lower low and then are forced out, and bulls get trapped in by a higher high, and both then have to chase the market as it reverses down for the final time.
Bearish Triple Top: A triple top formation is a bearish pattern since the pattern interrupts an uptrend and results in a trend change to the downside. Its formation is as follows: Prices move higher and higher and eventually hit a level of resistance, falling back to an area of support.
Bullish Triple Top: Triple Top is a bearish reversal chart pattern that leads to the trend change to the downside. Whereas Triple Bottom is a bullish chart reversal pattern that leads to the trend change to the upside. They are extensions of the Double Top and Double Bottom chart pattern.
