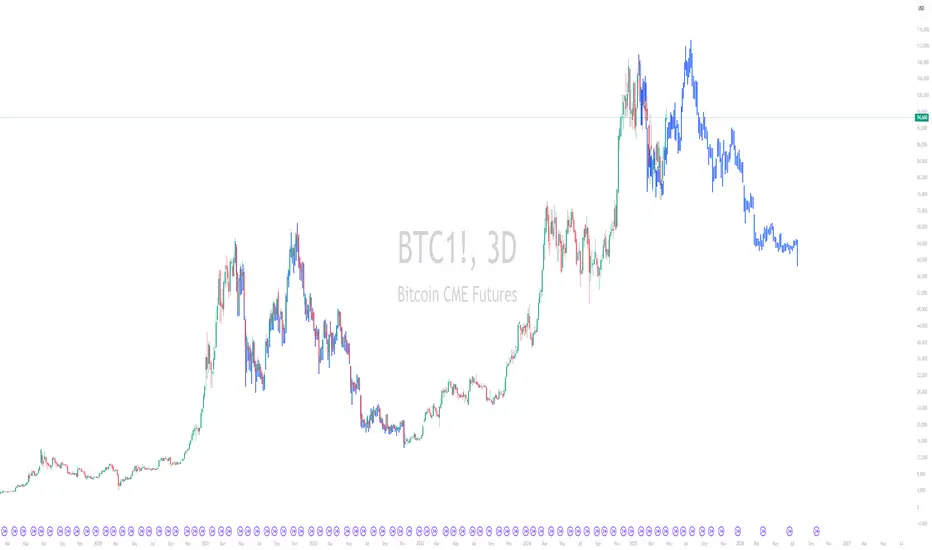
BTC 2024 Halving cycle..Using fractals to determine the BTC halving cycle of 2024.
BTC definitely has proven to be accelerated during this cycle, reaching some targets sooner than expected.
Got to see if TradFi affects this, however this is the idea now.
Contains IO script
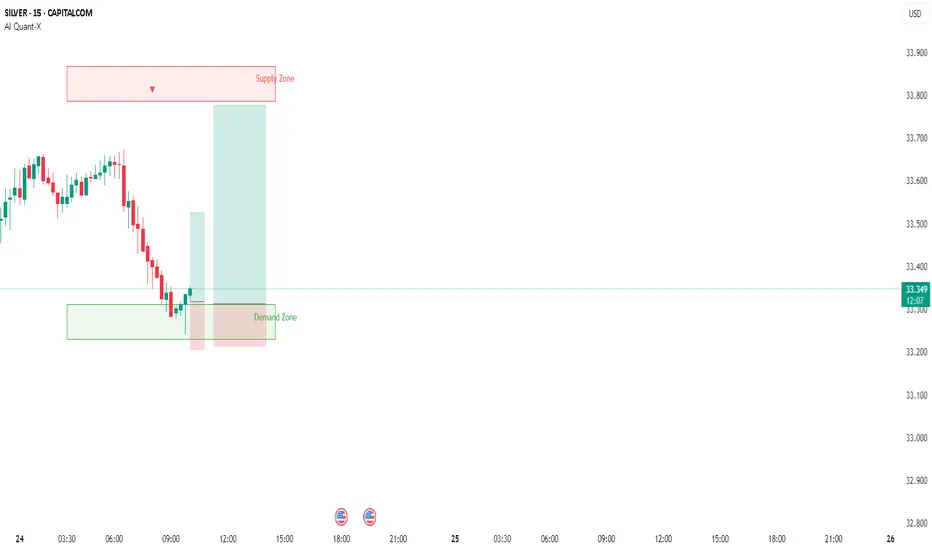
Going long in SilverSilver taking support of Demand Zone . SL below the zone target 1 and taregt 2 supply zone marked on chart .
Reason for trade price has taken rejection on Demand Zone .
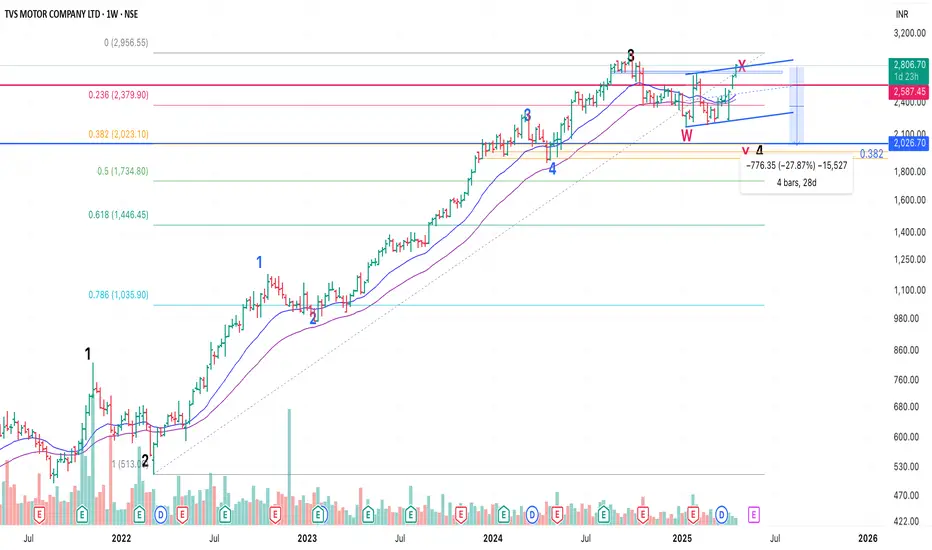
TVS Motors - Elliot Wave Counts - Good RR Short!TVS completed 5 Wave rise from March 2022 till Sep 2024, which fromed a major Wave 3.
I would have ideally wanted Wave 4 to correct at least 38.2%, which did not happen.
Now that stock is almost at ATH, it offers a good opportunity to explore a short with previous high as SL.
The entire zig zag move from Jan lows can just be an X and we get a Y down till at least 38.2% which is at 2025, a good 17% correction from today's price.
All the best!
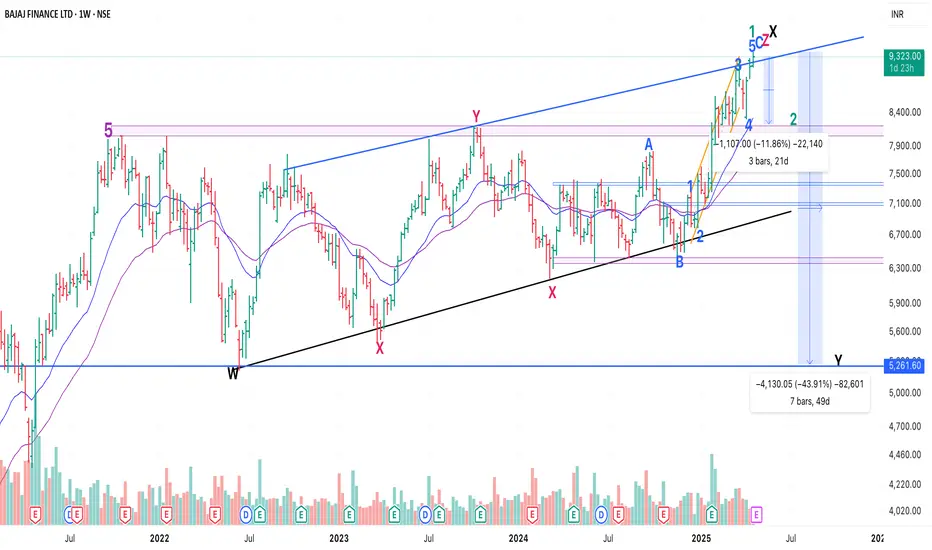
Bajaj Finance - Elliot Wave Counts - Major top done?Bajaj Finance has been in a sideways consolidation since Sep 2021, where it had completed a Major top from March 2009 lows (as per my counts).
So, there are two Possibilities from here:
P1. Major top -> sideways action -> Finall blow-out correction/ capitulation and then a start of next leg up.
P2. Major top -> sideways consolidation for 4 years (till Jan 2025) -> Next leg up started
P1: Reason could be re-rating of P/BV (which stands at 6.6), to industry avearge of around 4. Bajaj has been growing fast on account of unsercured lending. There could be bad assets building and the bubble can burst anytime, leading to the de-rating (P.S.: It has already de-rated from P/BV of 12.3 in Sep 2021 to 6.6 currently)
Elliot Counts: The correction from Sep 21 to June 22 was a W. the entire upmove from June 22 till date has been an overlapping corrective move in an X. What is to follow is Y, which should ideally re-test W at 5300 (that's a 43% fall)
P2: In this case we have completed the correction from Sep 21 till Jan 25 and started a new move up.
The five wave completion is just the Wave 1, and what is to follow is Wave 2, which can correct 38% to 50% of Wave 1 (i.e. from Jan 25 lows till the highs). Expect min 8300 to come, which again is a more than 10% correction.
Good thing is in both cases, we get a good enough correction to trade. All the best!
Gold Elliot Wave Counts - Possibility 2 (Weekly 3rd done)There are two possibilities in Gold. Possibility 1 shared in another post (Targets of Possibility 1: 0.236: $2056, 0.382: $2781)
As per Possibility 2 the spike move up was 5th of 3 and hence we have just completed a 3rd Wave in weekly time frame - ending the move from Oct 2023 lows.
In this case also, we can expect 0.382: 2850, 0.5: 2650.
Gold went up on account of multiple reasons, key of which being de-dollarization and buying by non US countries.
However, my sense is that the spike in price was on account of trades from institutions, which will get unwound when price starts correcting and fuel the correction on the way down.
The move in last 2 weeks was a typical parabolic move, which should mark the capitulation.
Probable Risk: The last move from April lows was just 1 of 5. Hence keeping SL of current high is important.
Breaking 3150 (0.618 of the move from April) should give us more confident that 5 is done.

Gold Elliot Wave Counts - Possibility 1 (Weekly 5th done)There are two possibilities in Gold. Sharing my favored possibility here. Will share possibility 2 in another post.
Gold went up on account of multiple reasons, key of which being de-dollarization and buying by Non US countries.
However, my sense is that the spike in price was on account of trades from institutions, which will get unwound when price starts correcting and fuel the correction on the way down.
The move in last 2 weeks was a typical parabolic move, which should mark the capitulation.
Hence, look for correction of entire leg up from Oct 22 bottom.
Targets: 0.236: $2056, 0.382: $2781
Probable Risk: The last move from April lows was just 1 of 5. Hence keeping SL of current high is important.
Breaking 3150 (0.618 of the move from April) should give us more confident that 5 is done.

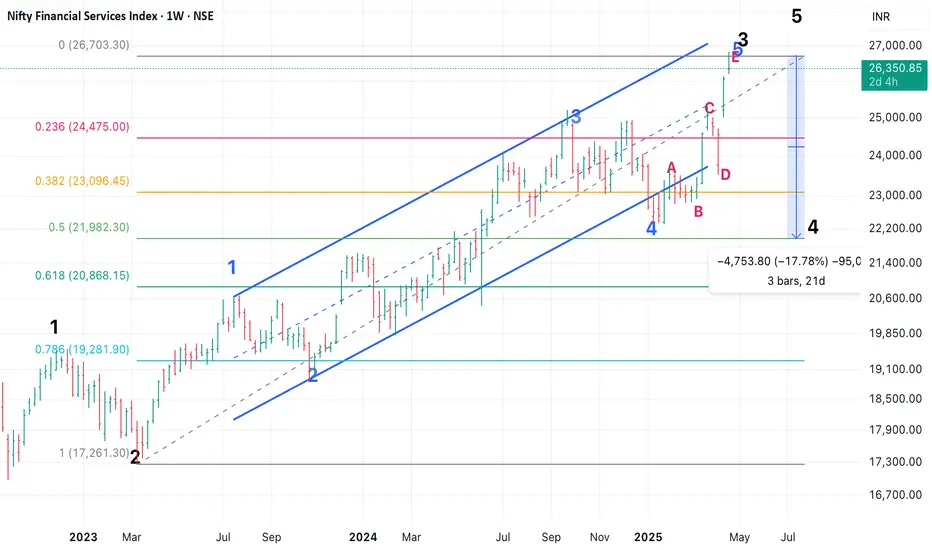
Nifty Financial Services - EW Analysis - Good RR ShortNifty Financial Services showed resilience in the entire fall and led the way up in recovery as it had a 5 of 3 up (from March 23 lows) pending, which got done in Nifty and most other indices in Dec 2023.
Now it has completed that 4 and should lead on the way down. Expecting at least a 14% correction in index till 23150 (38.2% retracement). Next target will be 22020 (50% retracement).
My bet is on 50% retracement, as Bajaj Twins and HDFC Bank and ICICI Bank have completed a corrective bounce and should test/ break recent lows.
Bajaj Twins have much larger correction possibility. Will share in other posts.
crude sell trade ideaWill sell crude when price 5522 sl marked and tareget 1 and target 2 marked reason for the sell is crude taking rejection from Supply Zone of Comex charts . our trading style is buy from demand zone and sell from supply zone . marked this levels keeping buffer according to comex charts .

gold brought from demand .gold brough from demand zone rejection . sl below the zone targeting above the supply zone till marked levels .
reason for this buy trade is rejection from demand and gap fill on MCX chart.

selling Nifty from XI zone .nifty price is taking rejection from supply zone on smaller time frame . selling nifty with SL above the XI zone and targetting Supply Zone .

long in Crude oil .crude oil has reached the demand zone . so buying crude oil from demand . sl below the demand zone and targetting supply zone . Crude taking rejection from demand zone on smaller time frame .

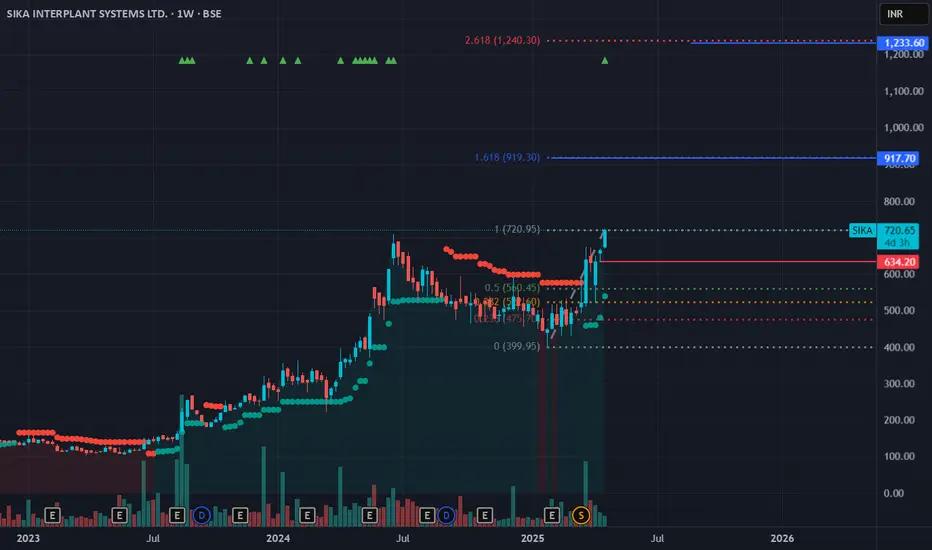
SIKA - Rounding bottom patternfresh Break out on chart. positional trader can see this as marked target and Stop loss. company is in Defense sector.
A strong rejection at 1.14800, Strongly ShortA strong rejection at 1.14800, Strongly Short at the resistance level, this is a area of interest which shows that price is going to be rejected and a long short opportunity can be seen at the price point.
Points to consider:
1. This is not a short time trade, consider it as a swing one.
2. Short between 1.14800 - 14100
3. SL: 1.5000 (as per your risk capacity).
4. Target: 1.11900 (Trail below this or close it as per your risk management).

nifty long tradebuy nifty when candle closes above demand zone . considering demand rejection . sl below the zone and target supply zone

Buy Crude OilAs crude oil has taken rejection from Demand Zone . Buying crude oil for a target of Supply zone . Sl below demand Zone . Zone to Zone trading .

buy trade in Gold As Gold has given break out of supply zone going long in crude where sl is below supply zone and target is XI zone . Zone to Zone trading

Gold Next Target 2800 and What Next Trump's tariffs?🔍 Chart Context (1H and 15M Combined View)
Trend: Bearish overall structure on the 1H timeframe, with lower highs and lower lows.
Trendline: Clearly respected and just recently tested again (price rejected at the trendline on 1H).
POI (Point of Interest): 3,030 – 3,040 zone acting as a strong supply/resistance zone.
📈 Support Levels:
2,978.949 (key demand/support zone).
2,956.129 (major support level).
📉 Resistance Zones:
✅3,020 area (15M minor supply zone, shaded red).
✅3,030–3,040 (POI level on 1H, shaded blue).
✅3,058.437 (major resistance).
🧠 Price Action Insights-1H Chart:
Price attempted to break the descending trendline but was quickly rejected (marked with a circle).
Multiple rejections from POI level suggest strong seller presence.
Strong bearish candle followed that rejection (confirmation of trend continuation).
15M Chart:
Price bounced from support at 2,978
Quick rally back to ~3,004, stalling below the minor supply at 3,020.
Could be forming a lower high (ideal short setup zone).
📌 Trade Setup Idea:
✅ Trade Type: Short (Sell)
🔽 Entry Zones (Sell Limit Ideas):
Aggressive: 3,020 (near the 15M minor supply zone)
Conservative: 3,030–3,040 (POI level on 1H chart)
🛑 Stop Loss:
Above 3,045 (well above POI and trendline breakout level)
🎯 Targets:
TP1: 2,978.949 (recent support, also previous bounce level)
TP2: 2,956.129 (major support level from 1H chart)
TP3 (Optional Swing): Below 2,950 if momentum continues
⚠️ Risk Management Tip (Beginner-Friendly):
Use position sizing based on your risk appetite (e.g., 1–2% of your account per trade).
Avoid entering late if price already breaks past POI or trendline with strong volume.
📌 Key Beginner Takeaways:
You're identifying liquidity zones, trendlines, and structure: excellent progress!
Use confluence (multiple factors aligning) to enter with higher probability.
Practice this setup in a demo account to gain confidence.
👉 Always follow TP/SL to protect your capital and maximize profits!
Disclaimer: This is for educational purposes only.
Always trade responsibly and manage your risk effectively

Crude oil sold from Supply rejection Crude oil sold from supply rejection 110 points captured till demand Zone .
Crude brought from Demand Zone trade active on buy side 80 points done
Both sl were of 25 points .

Todays Bank nifty trade sold from Supply rejection . sl was above supply zone . target Demand Zone .. 500 points
brought from Demand Zone sl was below the Zone and target Supply Zone .. 500 points
2 proper trades with small sl and 1000 points captured in total .

bank nifty sell tradebank nifty sell from supply rejection on smaller time frame . Sl above supply Zone , and target demand zone or gap fill yesterdays close .


BITCOIN BULLISH POTENTIALPrice has entered the discount zone near a weak low, signaling a potential reversal as smart money may be accumulating after a liquidity sweep. This area often serves as a launchpad for bullish moves, especially when sell-side liquidity has been taken.
Short-term sentiment is shifting bullish, suggesting momentum could be building for a move upward. With key bearish targets already met, the downward pressure may be fading, setting the stage for a corrective move or full reversal.
If bullish structure forms—such as a break of structure or a bullish order block holding—price could begin climbing toward equilibrium and possibly into premium territory. Look for confirmation through price action and volume shifts.

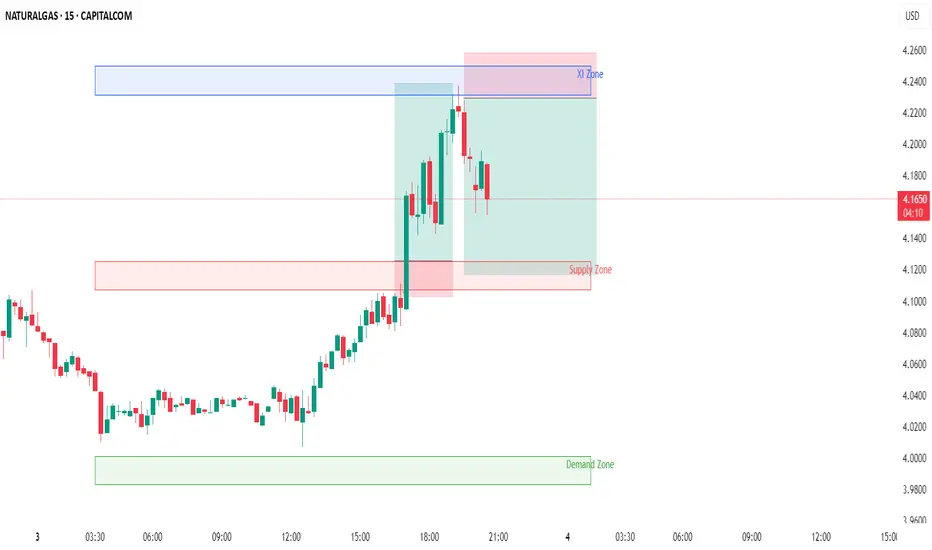
Ng Zone to ZoneBrought on break out of supply zone for target of XI zone
Sold from XI zone for the target of Supply Zone .
Power of Zones