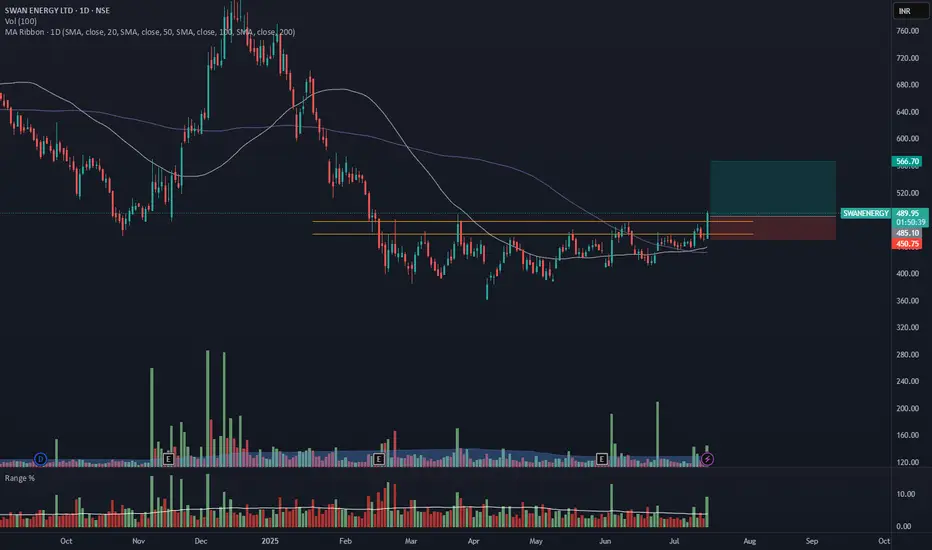
SWANENERGY - Daily Timeframe Breakout (Resistance Zone Break)SWAN ENERGY has shown a breakout above a key horizontal resistance level on the daily chart, accompanied by a nearly 2.5 times volume surge near the breakout zone, as seen earlier, supported by strong momentum.
🔍 Breakout Context:
- Price might break above the ~₹484 horizontal resistance, which had held for over 6 months.
The breakout zone has been supported by 2.5X volume and a range 3X of average near the resistance zone.
- The price is also trading above both the 50- and 100-day SMAs, indicating strong trend continuation.
- This aligns with a bullish continuation setup.
📉 Trade Plan:
- CMP: ₹485.2
- Entry: Near ₹484
- Target: ₹566 (~16.5% upside from CMP)
- Stop-Loss: ₹450
- Risk-Reward Ratio: ~ 1 : 2.3
📌 Note:
- Wait for the closing of this candle, enter the trade near 3:20 PM, or get confirmation on 75min/1Hr TF.
- Avoid chasing the extended move unless confident in intraday momentum.
⚠️ Disclaimer: This post is for educational purposes only and not financial advice. Always do your research or consult a financial advisor before trading.
Contains IO script
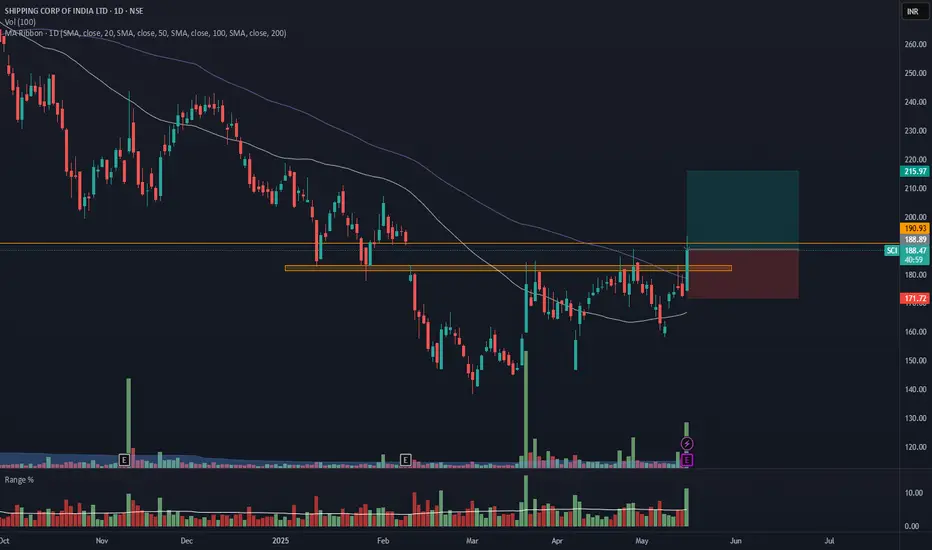
SHIPIING CONTAINERS INDIA - SCI - Breakout from DTFShipping Containers India has resistance weakening on the Daily charts and has given a breakout with good volume.
The target of this pattern signals an upside potential of 15% from the current price level in the medium term.
The stock is trading above its 50- and 100-day exponential moving averages (EMAs). The range is more than 2X, and the Volume is also 3.5X the average.
There is an old support level acting as resistance, which is why the stock won't go over 191. To be safe, wait for the closing price. If it is above 191, it's good.
CMP- Rs. 188
Target Price- Rs216 ( 15% upside)
SL - 171
Disclaimer: This is not a buy/sell recommendation. For educational purpose only. Kindly consult your financial advisor before entering a trade.
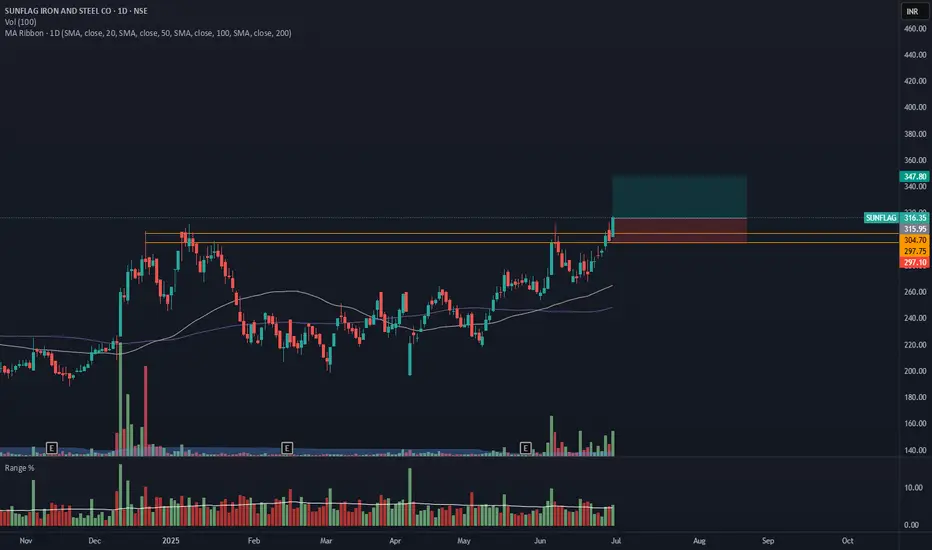
SUNFLAG- Breakout from DTFSUNFLAG has resistance weakening on the Daily charts and has given a breakout with good volume.
The target of this pattern signals an upside potential of 10% from the current price level in the medium term.
The stock is trading above its 50- and 100-day simple moving averages (SMAs). The range is more than 1.2X, and the Volume is also >6X the average.
CMP- Rs. 316
Target Price- Rs347 ( 10% upside)
SL - 297
Disclaimer: This is not a buy/sell recommendation. For educational purpose only. Kindly consult your financial advisor before entering a trade.
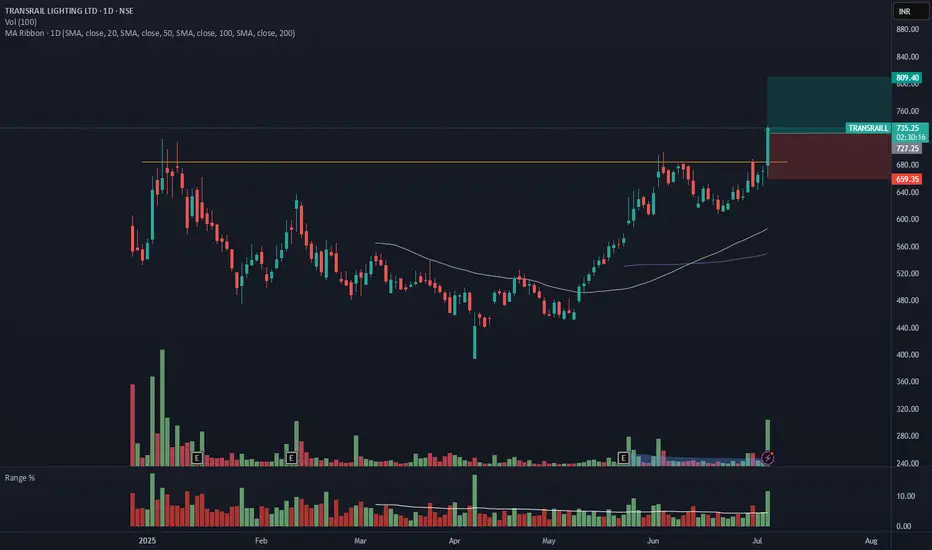
TRANSRAILL - Breakout from Daily TFTRANSRAILL has resistance weakening on the Daily charts and has given a breakout with good volume.
The target of this pattern signals an upside potential of ~10% from the current price level in the medium term.
The stock is trading above its 50- and 100-day simple moving averages (SMAs). The range is more than >2X, and the Volume is also >6X the average.
CMP- Rs. 727
Target Price- Rs.805( ~10% upside)
SL -859
Note- The breakout candle has gone up, extended, so be mindful of your position.
Disclaimer: This is not a buy/sell recommendation. For educational purpose only. Kindly consult your financial advisor before entering a trade.
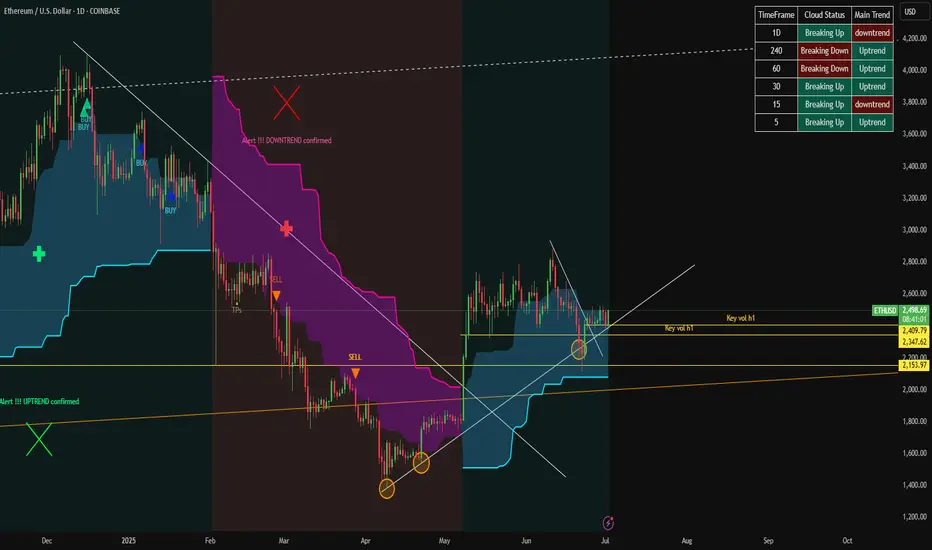
ETH/USDT strong up trend.Looking at the ETH chart, we can see one thing, the price has accumulated and moved sideways for quite a while after a strong up leg before. With the bullish price structure still maintained, with ETH we look for long positions with futures or SPOT for good positions. The price is expected to surpass $3,000 soon
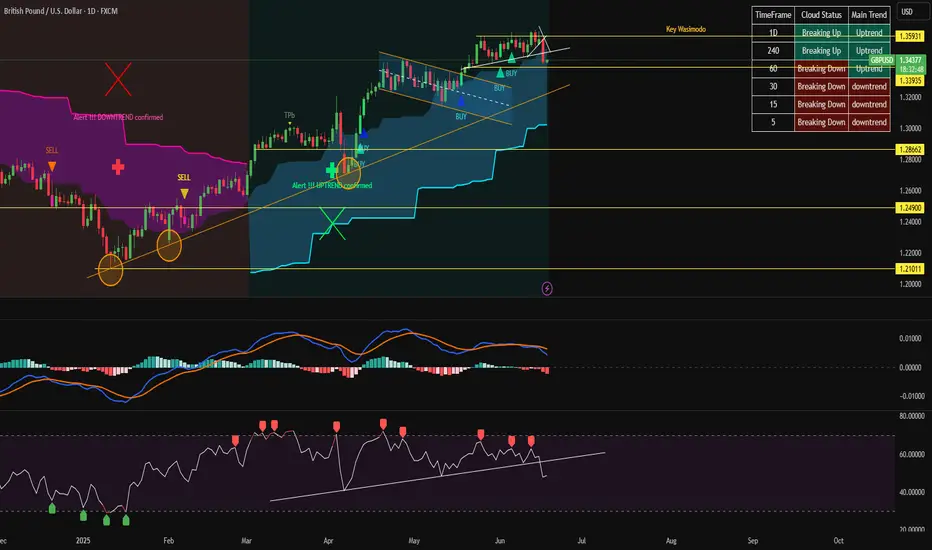
AUD.USD Strong signal up trendAfter a long period of sideways accumulation and price compression, AUD finally showed signs of breaking the downtrend line and starting to increase. Along with the weakening of USD, AUD has a bright chance for a strong price increase in time W+M

USD.JPY Strong sell all time frameas analyzed before.
USD.JPY has given strong sell signal on all time frames.
the indicator is in sync all time frame sell and now price has fallen through the trendline. signaling a strong downtrend of USD.JPY
we continue to look for sell signal when price recovers at time M15+h1

USD/JPY pair gives full time sell signal.Looking at the D1 chart, we can see one thing, USD/JPY has given a strong bearish signal, a bet expecting the price to decrease by 1,000 pips with time D1.
On h1, there is a clear bearish signal, you can also find a suitable signal on M15 for this USD/JPY bet

Nifty - Elliot Wave - Update - Stay long till proven otherwise!Our view that at least one more leg up was pending has held out well.
View shared here:
Now, Since it took longer in consolidation, I am open to considering that we did a sideways 2 and are heading up in 3.
Crossing 25700 will invalidate LD and hence increase probability that 3 up has started.
P.S.: If we are actually in 3, then 28k - 30k possible in this year. So, hold on :)

BTC goes wild. But there’s worse. With PipGuard.“BTC goes wild. But there’s worse. With PipGuard.”
Hola, hi my friends! How are you doing? Hope you're doing amaziiiing!
Today we’re having a little chat about Bitcoin, shall we?
I admit it: this time I messed up and took the USDT spot chart instead of USD… but heeey, I’m lazy and it doesn’t really matter. What counts is the trend, RIIIGHT?
But first… boost me and drop a comment <3
📈 The trend is your friend... until it messes with you
🔼 If it goes up, it goes up
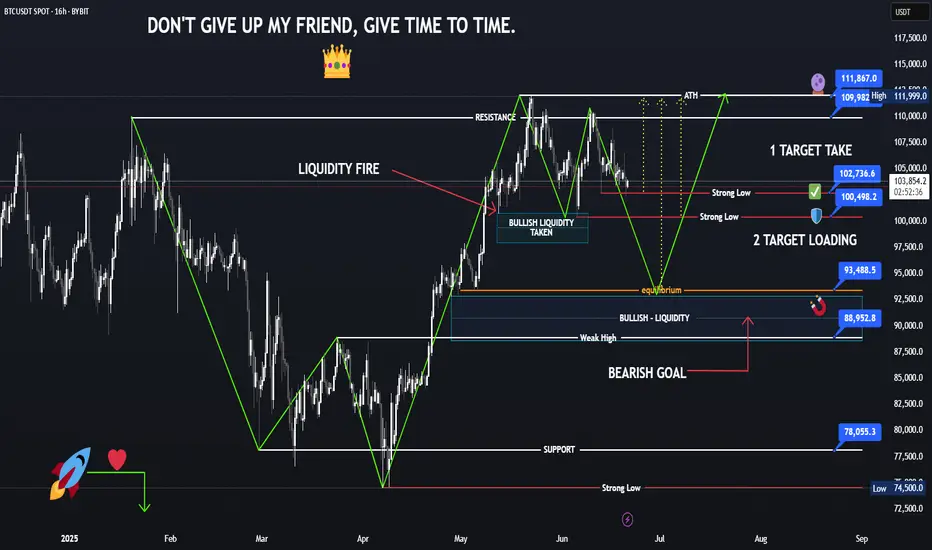
BTC is still in a strong bullish trend long term.
Nothing new? Maybe, but if it keeps going… it’s aiming for new highs. Simple.
And if not today, then tomorrow. Your loss if you miss it.
🧠 Always keep one eye on assumptions and the other on objectivity. The market will thank you.
🔽 If it drops... better be ready
And if it decides to go down?
Here come the targets: 102k , 100k , and that delicious 94k I’d love to see.
Why? Because even crypto needs a break.
And each level is potentially a reversal point , you know that already, right?
🧱 Supports, resistances... and your debts
• Resistance: 109k (rounded like those 100€ you still owe me haha)
• Serious support: 78k
• Cuddly support: 88k
• The rest is noise.
• Trend still strong, yes. But if you’re not watching… someone else will watch your wallet.
🔥 The market today? On fire, as always
• BTC did its usual trick: touched 106k , then dropped below 103k
• Liquidations? BOOM 💣: over 450 million dollars in longs
• The market shook like a noob on their first short
🌍 War, hacks, and chaos: BTC loves it
• Israelis flying around Iran bombing targets
• Iranians firing back missiles
• Israeli hackers broke into Nobitex and BURNED 90M in crypto
• The White House is silent, but the US has a “Bitcoin Reserve”
• Result? BTC pumps, dumps, pumps again… you tell me
🐍 Juicy GOSSIP
• In New York, two crypto bros kidnapped an Italian guy from Rivoli and tortured him for 17 days to get his wallet password
• Electroshock. Power saw. “Wild” sessions with madams & friends
• All this between parties, bondage, and wheelchairs
• The guy, alive by miracle, is now the new symbol of “ never give your key to anyone ”
📊 Technical Recap
🧱 Resistance: 109k
🪨 Supports: 88k / 78k
💣 Liquidations: +450M long
📉 Price Range: 106k ➝ below 103k
🌍 Geopolitics: Real bombs & BTC
😈 Gossip: Crypto-bros under pressure 😱
😂 The curtain drops…
My fingers hurt. And not just from typing… oops, I said it? I did.
If you had fun, boost and comment .
If not… next time I’ll give you support at 69k, that’ll teach you.
A hug from your loyal lunatic, PipGuard 🤣🧨
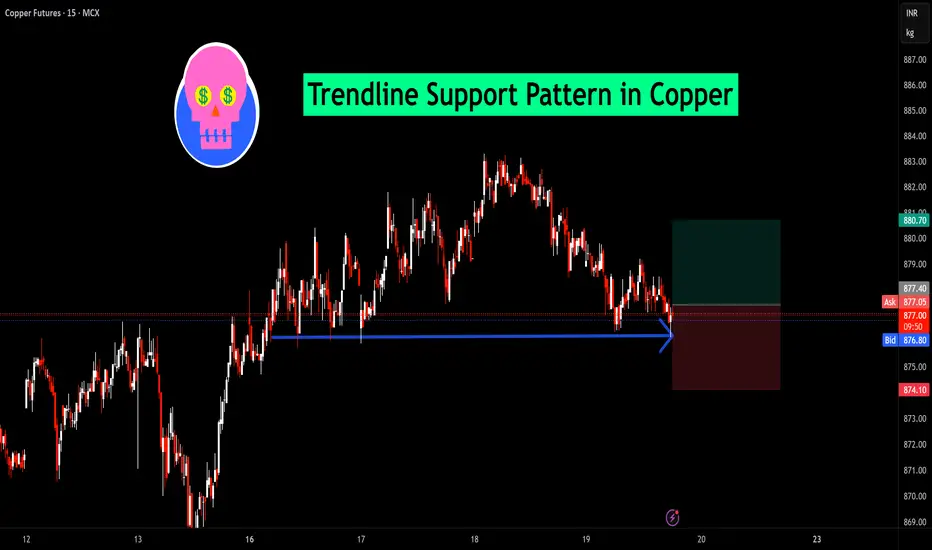
Copper Futures Update – Bullish Setup Alert!A strong trendline support pattern has formed in Copper (MCX), as seen on the 15-minute chart. Price has successfully respected the support zone near ₹876, indicating buyers are stepping in around this level.
With a positive price reaction from support and a favorable risk-to-reward setup, a potential upward move towards ₹880–₹881 is on the cards. 📈
This setup suggests a short-term bullish sentiment as long as the support holds. Traders can keep this level on radar for intraday to short-term opportunities. ✅
G.u Follow Shortbearish signals have appeared trend time D1.
H4 price has broken accumulation and has a bearish structure
continue to follow the downtrend and look for sell signals on H1
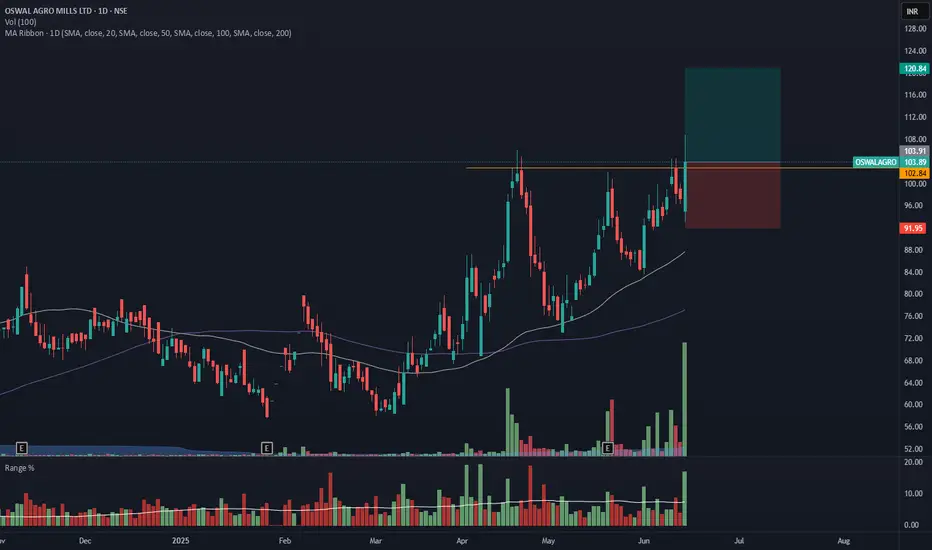
OSWALAGRO - Breakout from DTFOSWALAGRO has resistance weakening on the Daily charts and has given a breakout with good volume.
The target of this pattern signals an upside potential of 15% from the current price level in the medium term.
The stock is trading above its 50- and 100-day exponential moving averages (EMAs). The range is more than >2X, and the Volume is also >10X the average.
CMP- Rs. 104
Est. Entry price ~ 108
Target Price- Rs120 ( 15% upside)
SL -92
Note- The candle closed isn't very promising, so we have to wait for a stronger move.
Disclaimer: This is not a buy/sell recommendation. For educational purpose only. Kindly consult your financial advisor before entering a trade.
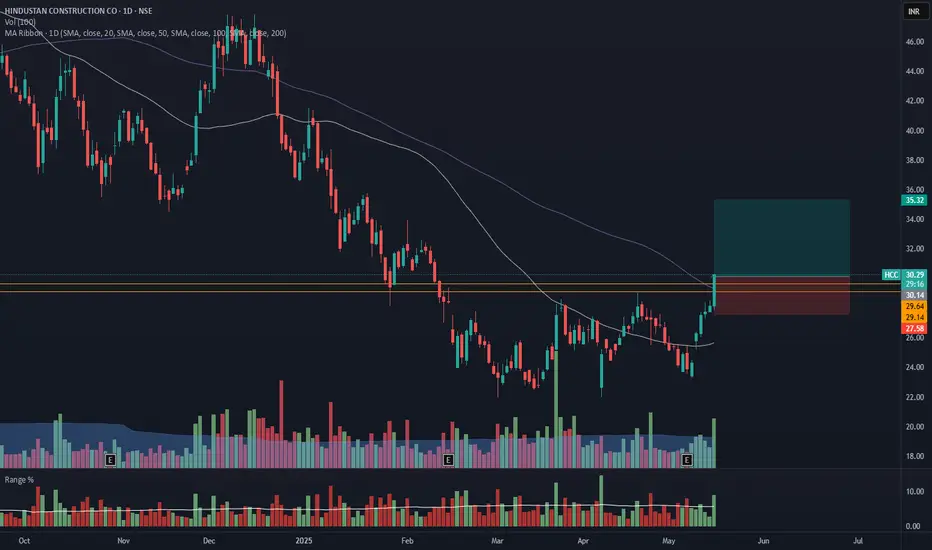
HCC - Breakout from DTFHCC has resistance weakening on the Daily charts and has given a breakout with good volume.
The target of this pattern signals an upside potential of 17% from the current price level in the medium term.
The stock is trading above its 50- and 100-day exponential moving averages (EMAs). The range is more than 1.5X, and the Volume is also 1.5X the average.
CMP- Rs. 30
Target Price- Rs35 ( 17% upside)
SL - 27.5
Disclaimer: This is not a buy/sell recommendation. For educational purpose only. Kindly consult your financial advisor before entering a trade.
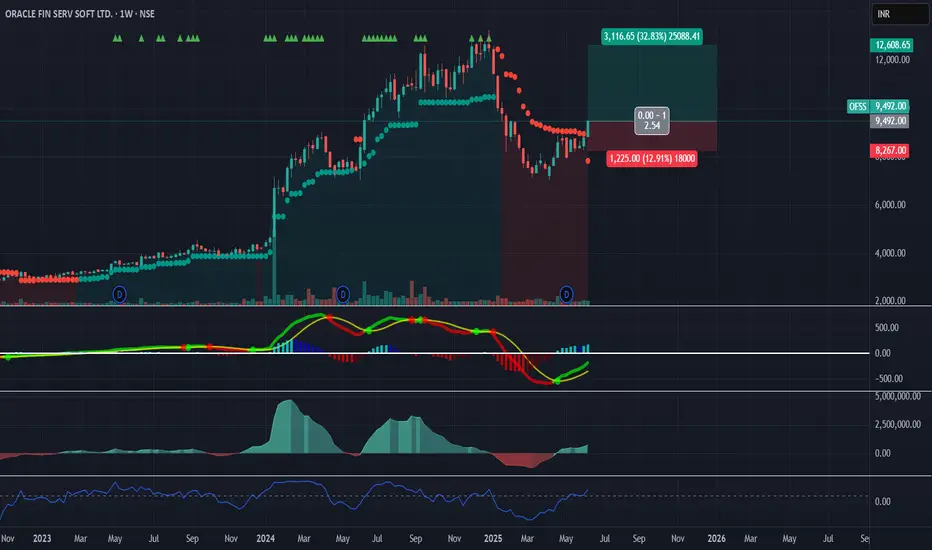
Oracle Fin Serv Soft LTD - Rounding Bottom📈 ORACLE FIN SERV SOFT LTD (OFSS) – Swing Long Setup Forming! 🚀
Ticker: NSE:OFSS
CMP: ₹9,492
Setup: MACD Reversal + Range Retest + PSAR Flip in Progress
Target: ₹12,600+
Upside Potential: +32%
🔍 Why I’m Watching This:
🔸 MACD Bullish Crossover confirmed with green dot + rising histogram
🔸 Price consolidating after a long correction – possible range breakout zone
🔸 PSAR about to flip from red to green on weekly
🔸 RSI recovering from oversold territory
🔸 Decent volume pickup after multi-week downtrend
🎯 Trade Plan:
Entry Zone: ₹9,200–₹9,500
Stop Loss: ₹8,267 (below range low)
Target 1: ₹10,800
Target 2: ₹12,600+
RR: ~2.5:1
A clean high base + confirmation across multiple indicators.
Will build position in legs – trend reversal could play out strong.
💬 What’s your view on OFSS? Are you tracking this too?
📌 Follow me for more high-probability swing setups based on momentum + structure logic.
Electrocast steel - Rounding bottom 📈 Electrosteel Castings – Weekly Breakout Watch 🧨
Ticker: NSE:ELECTCAST
CMP: ₹118.47
Setup: Base + Ema Compression + MACD Reversal
Target: ₹230+
Potential Upside: +102%
🧠 Trade Thesis
🔹 Stock has formed a clean rounding base after a long downtrend
🔹 Price has reclaimed multiple EMAs with strong volume
🔹 Weekly MACD crossover (green dot) with histogram flipping
🔹 Bullish momentum on RSI and OBV indicating accumulation
🔹 Volume increasing steadily on green candles – signs of institutional interest
📊 Risk-Reward Setup
Entry Zone: ₹110–120
Stop Loss: ₹88 (weekly close basis)
Target 1: ₹160
Target 2: ₹230+ (recent swing high)
Trade slow. Let price and volume confirm. Add on dips, ride the trend.
💬 Comment below if you're watching this setup or already in!
🔔 Follow me for more swing setups based on price-action + momentum logic.

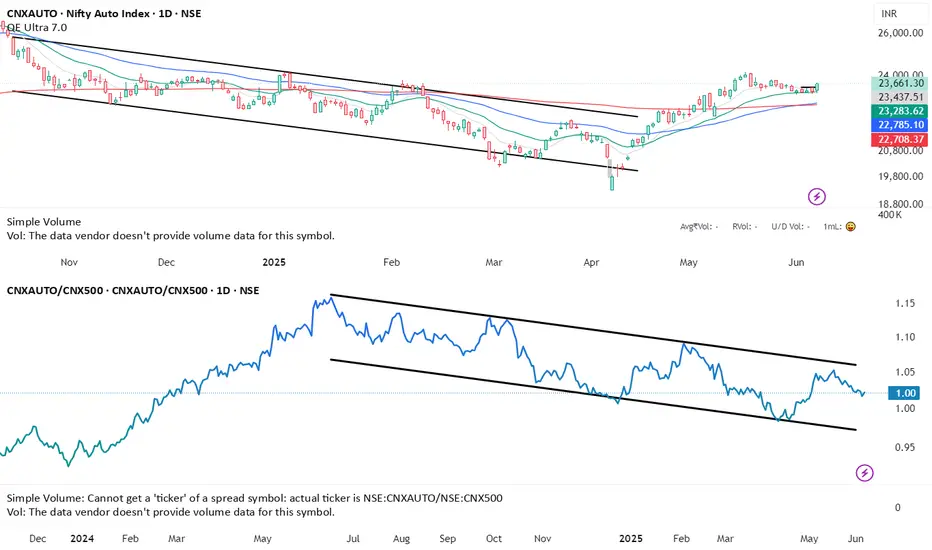
Relative Strength or weakness in Auto sectorLet's see if this makes lower high but this sector does not look the strongest for sure
Stocks in this index:
NSE:MARUTI,NSE:M&M,NSE:TATAMOTORS,NSE:BAJAJ-AUTO,NSE:EICHERMOT,NSE:TVSMOTOR,NSE:MOTHERSON,NSE:BOSCHLTD,NSE:HEROMOTOCO,NSE:ASHOKLEY,NSE:BHARATFORG,NSE:TIINDIA,NSE:MRF,NSE:BALKRISIND,NSE:EXIDEIND
Will have to check Ancillaries separately as there are many stocks which are coming in scans from Ancillaries space.
We are also facing rare magnets issue in the short term.
This is how you can use ratio charts to gain an extra edge.
Source: x.com
DISCLAIMER: NOT A SEBI REGISTERED ANALYST.
NO RECOMMENDATION TO BUY AND SELL
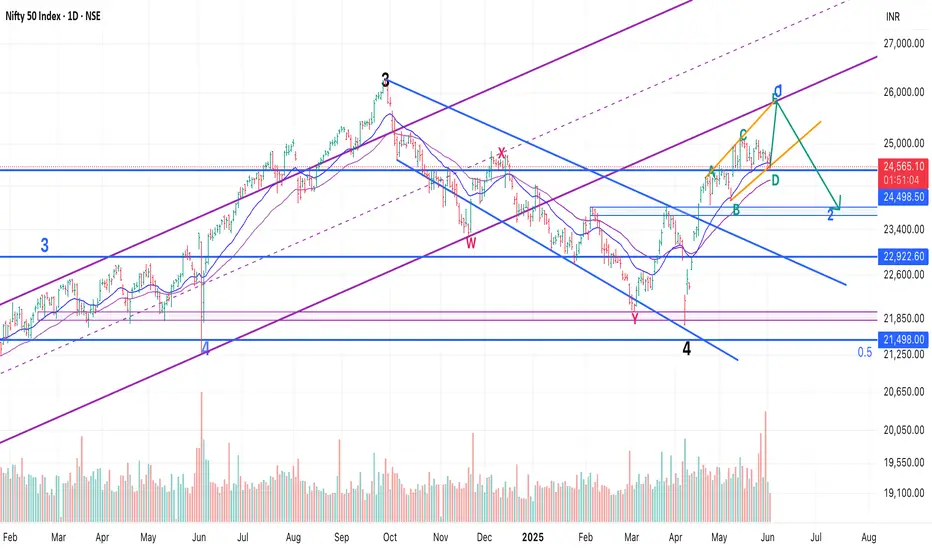
Nifty - Elliot Wave UpdateNifty has been testing patience and not letting anyone take positional trades since mid of May.
24500 has acted as a crucial support - and as we come to re-test it today for the 3rd time, I thought of updating the view after my last post on May 15th, as we have a good RR long trade here.
We had two alternates:
1. We are in 5th up/ which got done, is about to be done. In this case we head down to 23500 or so and then we review if this bounce was corrective or we are going to ATH.
2. We did 1 and 2 and have started 3 up. Within 3 we started the 3rd up today. If this is true, the run up should continue for next few days.
Now, possibility 2 remains as it is, but possibility 1 has changed to look like a leading diagonal.
So, instead of 12345 (where 1 and 4 cannot overlap), we are moving up in ABCDE (where A and D can overlap).
My view is that we have E up pending - and since we have taken so much time in D, more room is getting opened in E up (top of the wedge structure) - which was 25300 earlier, and is now looking at around 25700 - which is a good 1200 points from here.
This move up will also test the bottom of the longer channel we followed from March 2023 and broke in Jan 2025. So, a first test of that channel would mark as a good point for wave 1 to end and a correction to begin till 24000-23800.
24500 breaking and sustaining should act as SL. So, we have a good trade set-up at hand to play till 25500 or 5 wave up, whichever happens first
All the best!
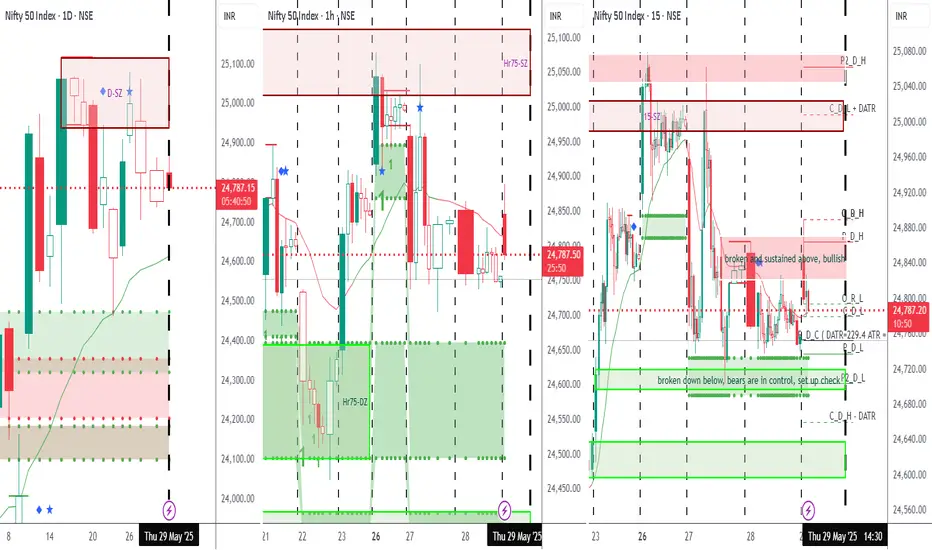
NIFTY RANGE BOUND with negative biasNIFTY IS Range bound and top of the range is rejected today and could not sustain about the resistance. and today is NIFTY expiry and cannot expect big moves for the most of the time.
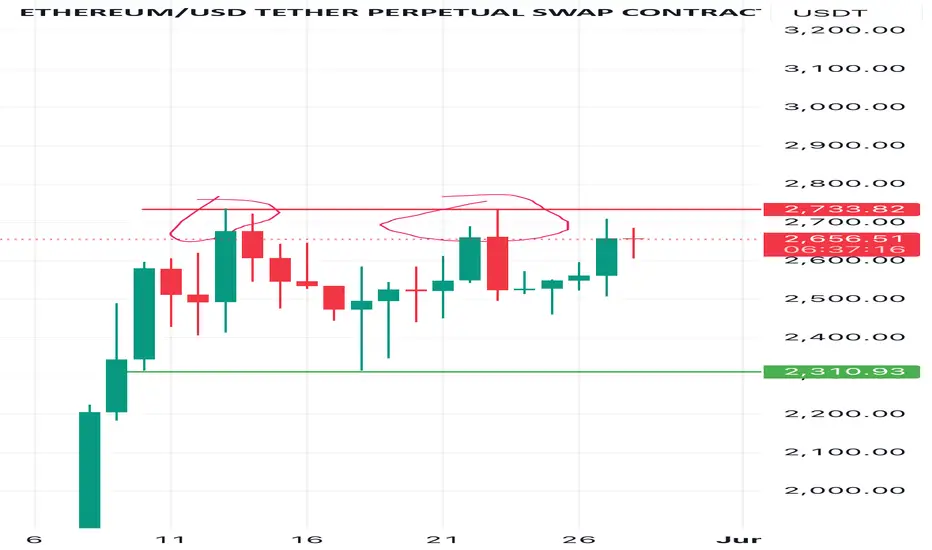
ETH massive breakout coming. Only trade i am watching for this week is this one. Huge consolidation and now looking to breakout for third test. Not entering early as too many fakeouts but yeah looks good for now.
Finding 12 Hr Virgin CPRsFinding 12 Hr Virgin CPRs - Know when to take TP1
A more favorable timeframe for scalps and daytrades

ETH Consolidation ETH in a massive consolidation zone rigjt now.
We never broke wick high we got close and rejected. If btc pushes past ath and eth moves again this would be the third test and a massive squeeze.
Not trading this range right now until confirmations but keep an eye on that wick for now

Eth - Consolidation Eth in a massive consolidation zone rigjt now.
We never broke wick high we got close and rejected. If btc pushes past ath and eth moves again this would be the third test and a massive squeeze.
Not trading this range right now until confirmations but keep an eye on that wick for now
