Gold BearishGold selling from supply rejection, SL above supply zone for target of Demand Zone .
Gold seems bearish . constant rejection from supply zone .
Simple trading setup buy from demand and sell from supply .
Contains IO script

Going long in niftyNifty taking rejection / support of supply zone .. buying nifty when prices closes above the supply zone . sl below supply zone target XI zone.
Traade based on supply break out and retest of zone .

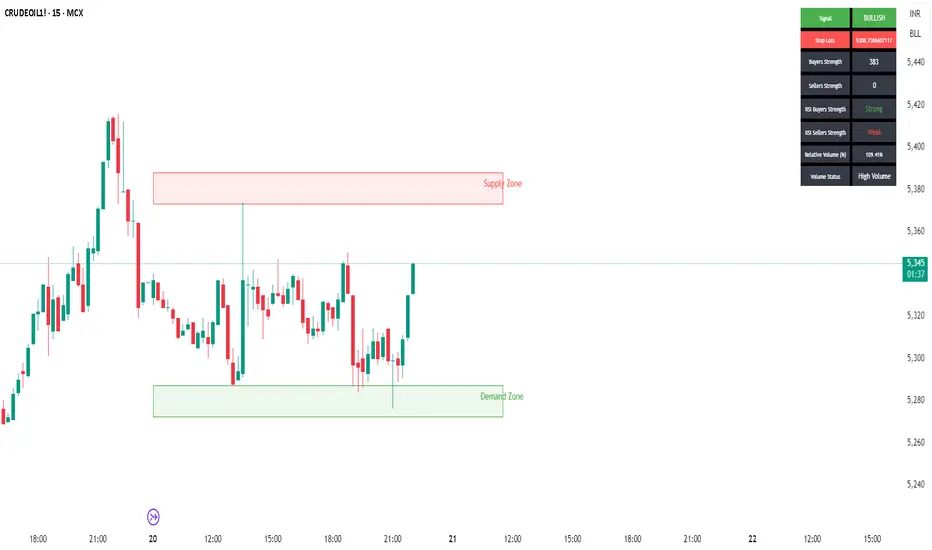
crude has taken multiple rejection from demand zone Crude is taking multiple rejection from demand zone & we can see an upward moment .
if sustains above the zone we can see target of supply zone .
Crude exac buy is from 5295 sl is below the zone 5270 target is 5350 safe 5380 final .
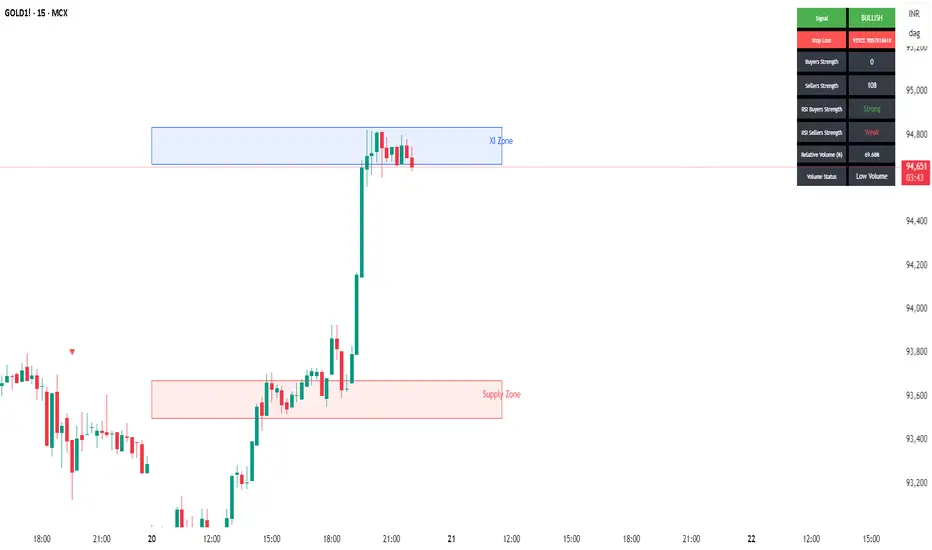
Gold facing rejectionGold is facing rejection from XI zone if sustains we can see a downside moment in gold .
Sell when price closes below the zone sl above the zone and target supply zone .
SPX/ NDX/ DJI - Elliot Wave - Change in CountsI have expected May 8th as the top of the pullback in this post:
However, it seems that there were more legs pending.
View still remains that this is a counter trend rally, and we will eventually head down again.
We are in 3rd of C and we will get another move up in 5th, which should mark the end of the entire leg up.
If I am invested in US markets - I would use this rally to book profits!
View is similar in Nasdaq and DJI, so not sharing those charts again. :)
All the best!

Nifty - Elliot Wave Update So, thankfully we have been aligning are views with the market and reviewing counts at the right time. Lucky much? :)
On May 2nd - We caught the top, when the breakout didn't look convincing
We got a good correction (Correction was even better in stocks) and booked out at around 24k on May 9th, and changed views, again as the fall wasn't as bad as it was expected after the end of 5th. Hence, it made sense to expect a 5th up.
This change in view helped us ride a good move of +1000 points in Nifty and multiple +10% moves in stocks (crazy moves there).
Now, while the view shared on May 9th still remains valid, there's an even more bullish view possible.
Ideally, I should have waited for more clarity, but thought that someone shouldn't book out of positions, if it's actually that.
So, there are two scenarios:
1. We are in 5th up/ which got done, is about to be done. In this case we head down to 23500 or so and then we review if this bounce was corrective or we are going to ATH.
2. We did 1 and 2 and have started 3 up. Within 3 we started the 3rd up today. If this is true, the run up should continue for next few days.
How to decide, I am keeping 61.8% of today's move as a deciding factor. So, if we come back to 24700, I'll be out of longs - will even book cash trades and wait for clarity to re-enter.
P.S.: You must be wondering, what the two Orange circles denote - Well they are for reminding me that this price action can be a trap, as it has happened in past. :D
Though looking at set-ups in stocks and the way they are moving after clearly defining a base - I am quite confident that the low has been made for this correction.
As usual, important to track closely and be nimble to change the view and humble to accept mistakes :)
All the best!
Rites ChartRites Ready to fly target 340. I have also given you the snapshot of the analysis done by me.

Silver MCX - Elliot Wave Counts - Long TradeSilver lagged Gold in the entire run up through the year
However, in last week Silver held quite well, while Gold has been correcting.
It seems like weekly Wave 4 is done and 1,2 of Wave 5 are done.
Wave 3 - targets 1.1L, 1.15L. Wave 5 targets + 1.2L
All the best!

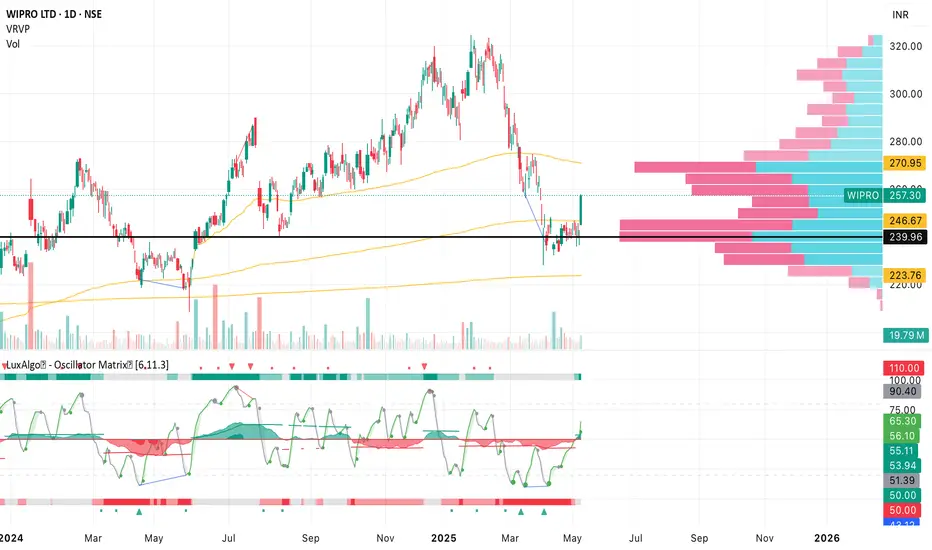
Wipro short term target for 266I will wait for wipro to slightly pull back till 251-252 and enter again for target of 266 .
Can see some big volume and bounce from good support level
nifty sell trade nifty sell once price closes below the supply zone, Sl above the zone and target is gap filling . Simple concept buy from demand and sell from supply zones .
As price is facing rejection at supply planning sell side trade with small sl .

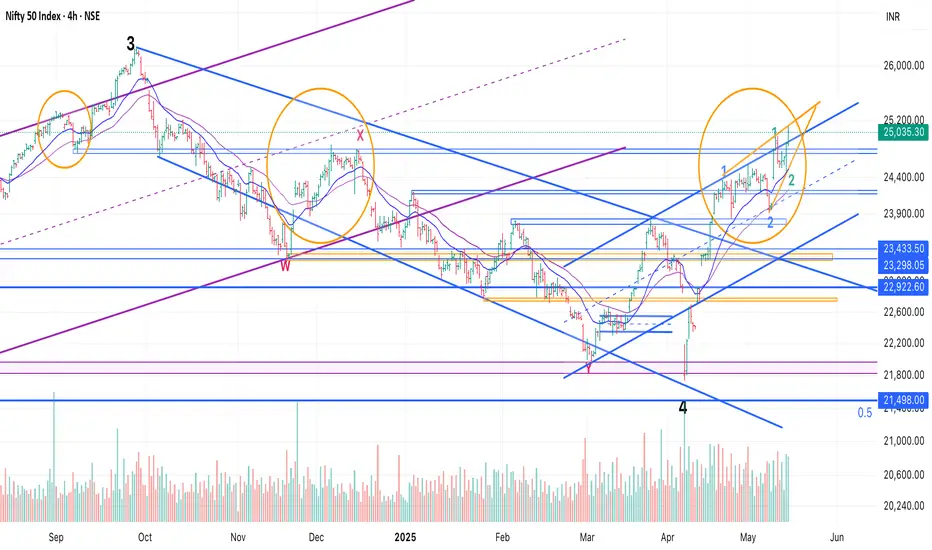
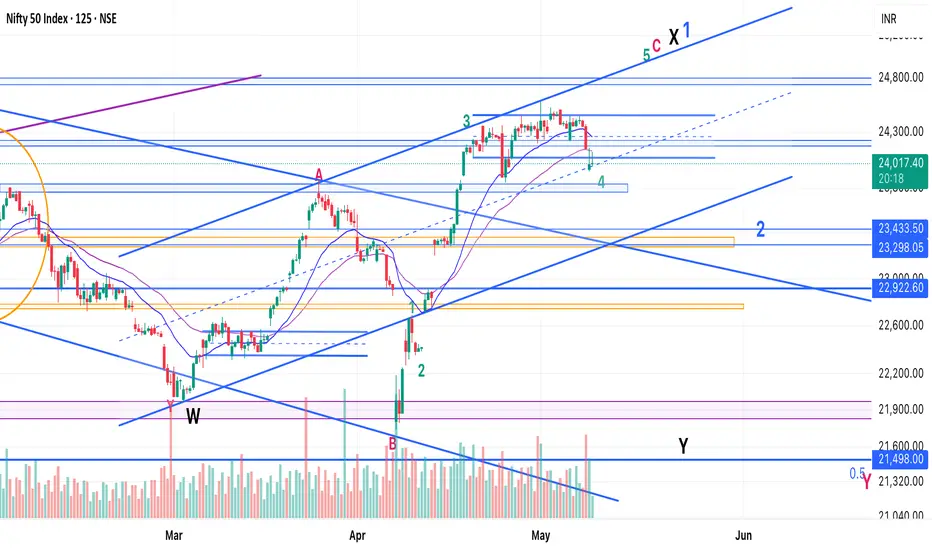
Nifty - Elliot Waves - Another PossibilityWell, Nifty is at a place that there are so many possibilities :)
This one is in line with the previous one, where I had mentioned that 5 up is pending and 25k can come.
I saw a few stocks making an expanded ED and turning, which gave the idea that Nifty could also be doing that.
So, here it goes - we go up in an E - 24800 is top of the expanded ED - we might even see a throw over to 25k - but unlikely) and then roll over.
After that there will be 2 options:
1. Bullish Scenario - We are just doing a 1 and the retracement we get is 2 (23400 target). Once this retracement is over we head to all time high.
2. Bearish Scenario - This entire leg up was corrective and we head down breaking April's lows.
In both cases we should get a decent short opportunity aroun 24800-25000.
However, now we have a minor trade for long - I would usually trade this very light and mostly intraday.
Will wait for the end of move for short trades. All the best!
Rajratan Global Wire - Flag BOCreated nice flag pole of ~72% and tightening after that and near the pivot now.
HVY during pole creation and volumes contracting during the tightening phase.
Decent results and PE expansion opportunity.

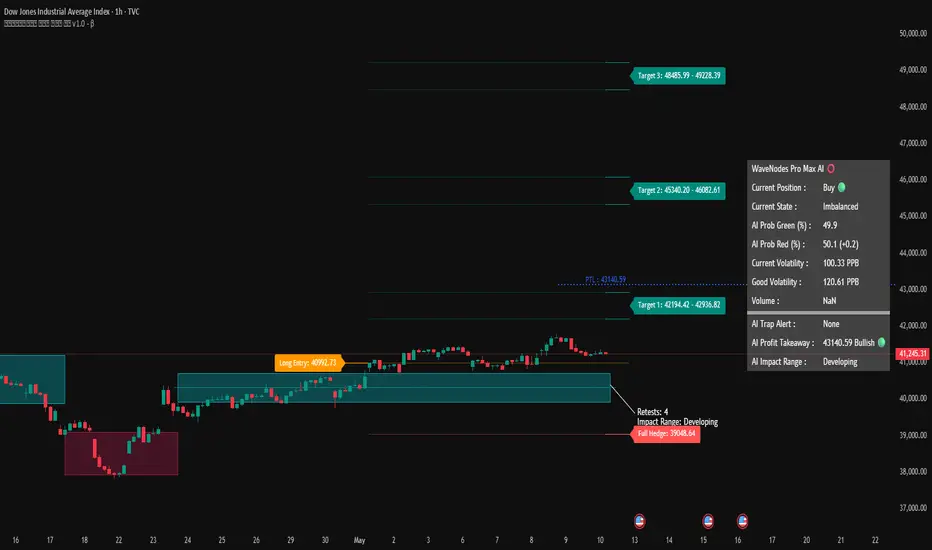
Dow Jones Outlook: Bullish View Holds as AI Trend BuildsMay 10, 2025 – WaveNodes AI Insight
The Dow Jones Industrial Average (DJI) remains in a bullish setup, with WaveNodes Pro Max AI confirming a Buy position from the Long Entry at 40992.73. However, the index is currently in a developing phase, trading near 41,245, below the AI Profit Takeaway level of 43,140.59.
The AI metrics indicate a near-balanced scenario:
AI Prob Green: 49.9%
AI Prob Red: 50.1% (+0.2)
Current State: Imbalanced
AI Trap Alert: None
Volume: Unavailable (likely a data feed issue)
Volatility: Low but building at 100.33 PPB, compared to Good Volatility of 120.61 PPB
The price has retested the AI Impact Zone four times, which is still developing. This repeated interaction with demand suggests strong underlying support.
Targets Ahead:
Target 1: 42194.42 – 42936.82
Target 2: 45340.20 – 46082.61
Target 3: 48485.99 – 49228.39
Conclusion:
The bias remains bullish, supported by a solid demand base and long entry structure. But with AI balance still forming and low volatility, traders should exercise patience and look for confirmation via a break above AI Target 1 or fresh demand breakout before scaling in.
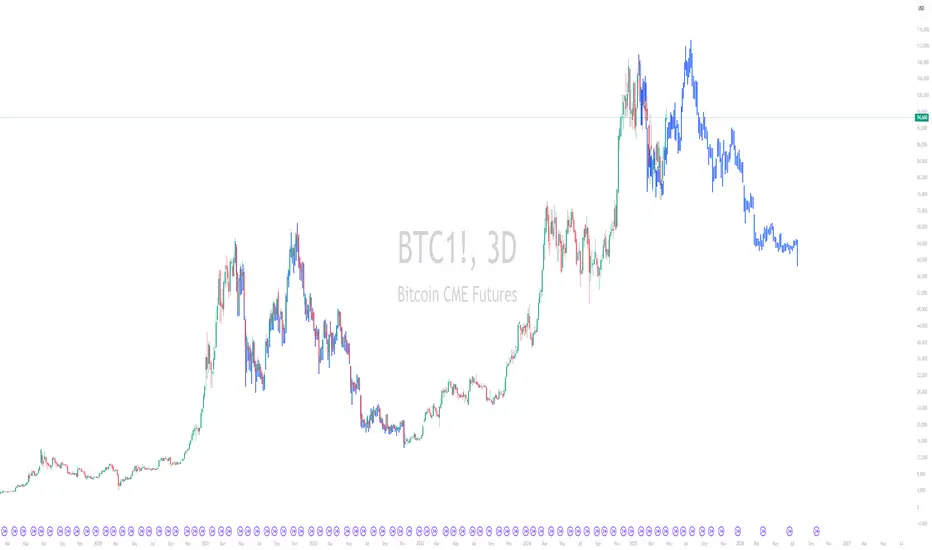
BTC - Eyes on Correction, Consolidation, & Fresh BreakoutMay 10, 2025 – WaveNodes Desk Report
BTC has surpassed AI Target 3, signaling strong bullish momentum. However, with the move now extended and the AI state showing imbalance, a phase of correction or consolidation is likely. Traders are advised to wait for a fresh breakout from new AI demand or supply zones before taking the next position.
Price action is now in "Imbalanced" territory. With volatility high at 302.72 PPB, yet below the "Good Volatility" threshold of 314.69 PPB, traders are likely to face choppy conditions in the immediate term.
The AI engine shows a razor-thin edge between bullish and bearish sentiment:
AI Prob Green: 50.1% (+0.2) <-- Reducing now
AI Prob Red: 49.9%
This close probability split, along with no current AI Trap Alert, implies an environment ripe for consolidation or minor correction rather than aggressive continuation — unless a new breakout emerges from fresh AI-defined demand or supply zones.
Key levels to watch:
Next re-entry opportunities hinge on whether price can retest the Impact Range at 95601.70 – 95915.63, or break above fresh supply zones that form post-Target 3.
Full hedge zone remains at 95776.93, serving as a critical downside invalidation area.
In summary: BTC has met its upward targets, and with the AI engine entering a balanced state, traders should now await a new structural cue — either from demand absorption or supply rejection — before initiating fresh positions.

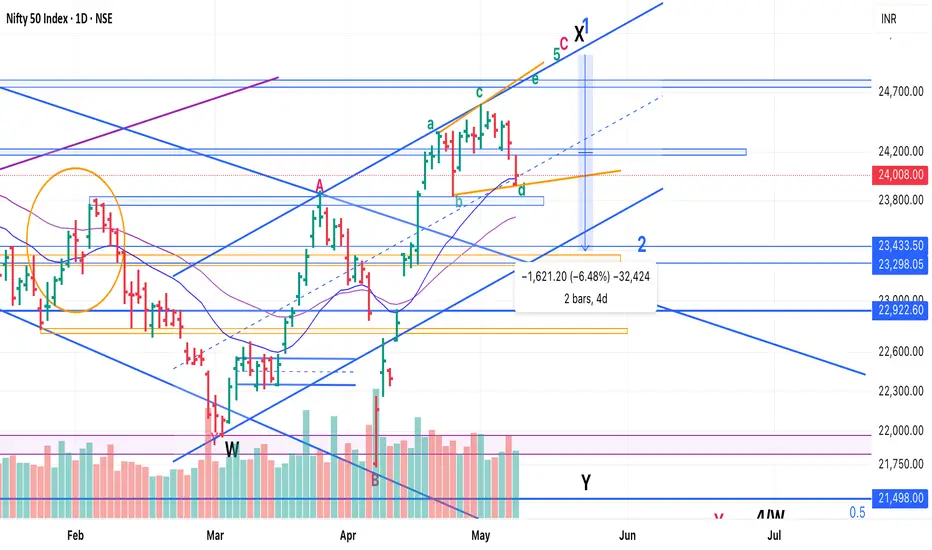
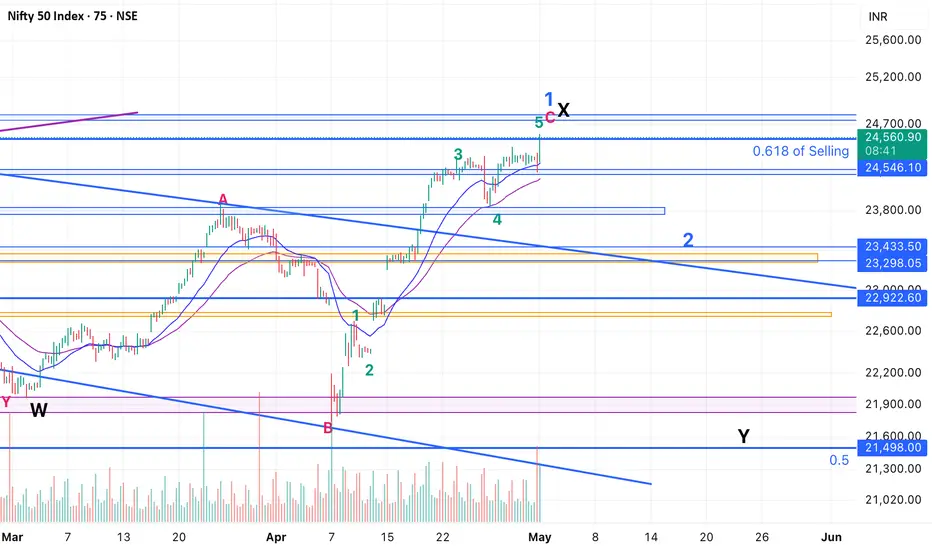
Nifty - Elliot Wave - Alternate counts - Bullish ScenarioI called a top on May 2nd as the buying looked like a trap - which usually acts as a good end of a trend move.
It worked out quite well, but we didn't get a selling momentum, that I expected.
So, contemplating if we are still in 4th and there's another leg up pending, which should be:
1. Bearish scenario - C of X - Y down should take us to new lows
2. Bullish Scenario - 1 of 5 (weekly) - We should have a 2 and then head up in waves 3 and 5 to 27-30k.
It's a tricky position to be in.
Plan: Keep position light and let the 5th up complete. In both bullish and bearish scenarios, we'll get a good retracement from there - Min 23500 (in 2) and can go till 21500 - 20500 in Y.
Ride the leg down and then take a call if it's bottoming out earlier or we are heading down?
For the time being, I have booked all of my shorts and awaiting clarity.
Cheers - All the best!
Bitcoin - Elliot Waves - Minor Counts (Last leg up)Here are the counts of the 5th of 5th that's going on. 108-110 should be max it goes.
Target after this is 60k.

BTC - Elliot Wave - Last Leg - 60k Coming AgainBTC completing the pending 5th of 5th of 5th.
God - this is going to be a painful correction.
P.S.: There could still be some steam left, but once done we are looking for 60k again!
All the best!

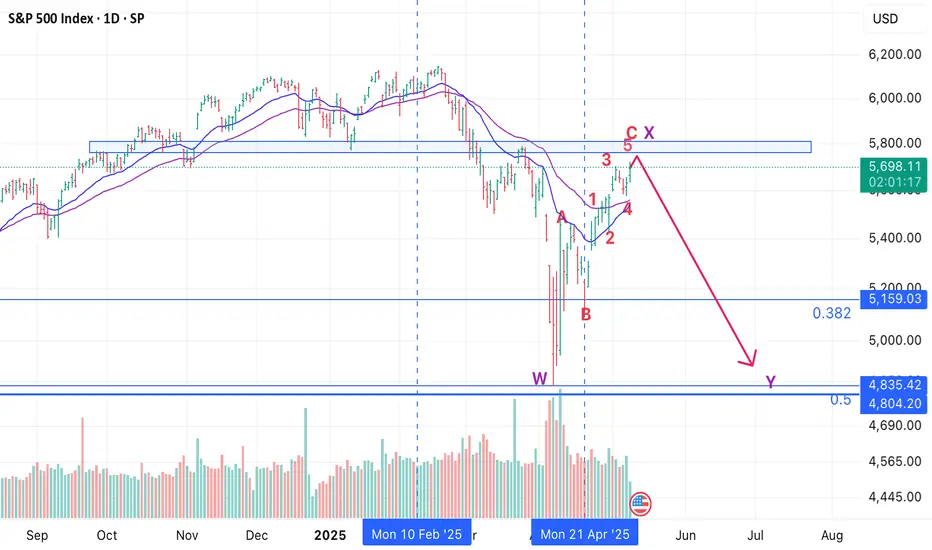
SPX - Elliot Wave Update -PullBack Over - Time for next leg downSPX has pulled back in an ABC with 5th of C going on today.
Good time to short and ride at least 10%, if lucky 15-20% :)
All the best!
What a clear sign for long@CryptoPointHindi Jahapana tussi great ho... what more clear sign a market can give. Trinity ki jai ho . Jabardast zindabad.
Please free indicator ko rehne do bhai hum jaise praja k pass

Nifty - Elliot Wave Analysis - Short Opportunity!We have had a good run-up from April lows. Today's buying seems like the last leg up which should end 5th up.
Now there are two possibilities:
1. Bullish Scenario: Nifty has completed correction in April first week and we have done Wave 1 in an impulse of 5 waves up. In this case we should retrace 38-50% of the move from April lows. So, expect 500-1000 points in Wave 2.
2. Bearish Scenario: The entire move up from April lows was corrective and part of larger X. X is formed by ABC where C is 5 waves up - i.e. the move from April first week lows.
If this is the case, then we head to new low in Y. 21500 or lower.
In both cases this is the time to initiate shorts and ride at least 500 points the move down. All the best!
Gold: Buyer Trap Alert as Rally Stalls. 20-25% Correction LikelyGold’s explosive rally may be running into exhaustion, with WaveNodes Pro Max AI flashing a Buyer Trap Alert for the first time in weeks. The metal closed at $3,220.35, shedding nearly 2.89% in the latest weekly candle, hinting at potential distribution at elevated levels.
Despite maintaining a "Buy" status with an imbalanced market condition, the system's AI probability metrics have shifted:
AI Prob Red (%) surged to 55.5%, a gap of +11 points, overtaking the Green probability of 44.5%, signaling growing downside risk.
Volatility remains elevated at 44.85 PPB, above the "good" threshold of 37.2, further emphasizing instability near the top.
Three major upside targets had been mapped:
Target 1: 2362.7 – 2430.7 (achieved)
Target 2: 2767.4 – 2871.4 (achieved)
Target 3: 3208.1 – 3312.1 (current zone)
However, with price hovering just below Target 3 and retreating sharply from highs, the momentum appears to be fading.
Technical Implication: A 20–25% correction from the recent high of ~$3,350 projects potential downside targets near $2,500–$2,600, aligning with key historical support zones and AI impact range levels.
Strategic Outlook: While long-term bulls may remain optimistic, short- to medium-term caution is warranted. A buyer trap scenario is developing, suggesting institutional unloading could be in progress. Aggressive long positions should be avoided, and profit-booking or hedging may be prudent.

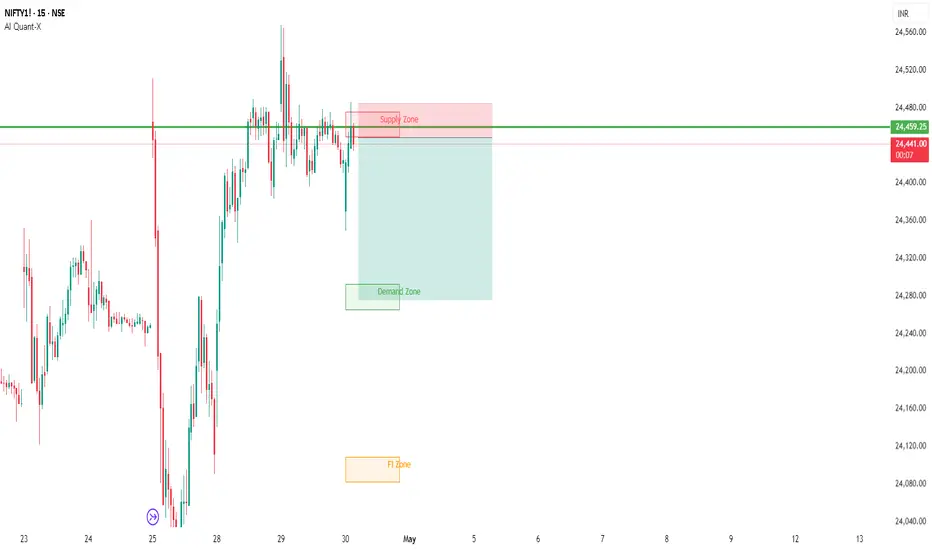
nifty can be sold .Nifty taking rejection from supply zone on smaller time frame , We can sell nifty from here . SL will be above the Zone and target will be Demand Zone .
Simple trading setup sell from Supply buy from Demand .
BTC 2024 Halving cycle..Using fractals to determine the BTC halving cycle of 2024.
BTC definitely has proven to be accelerated during this cycle, reaching some targets sooner than expected.
Got to see if TradFi affects this, however this is the idea now.