Crudeoil next structure on Track if oil prices rise too much and fuel costs increase sharply, it could put political pressure on U.S. President Donald Trump to pursue a negotiated settlement with Iran. Such a deal would likely ease geopolitical tensions and reduce the risk premium currently supporting oil prices.
5862 Acting as a resistance in 15min
Crude Oil

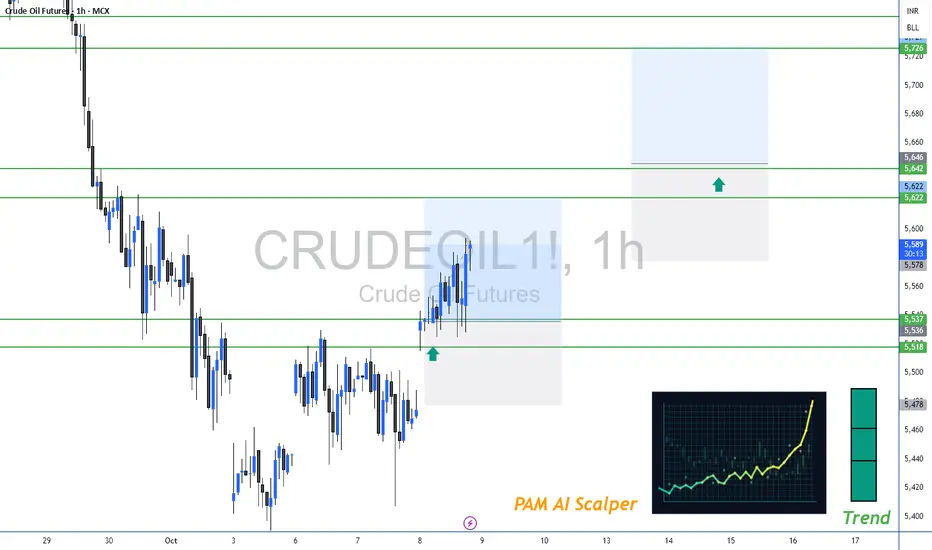
CRUDEOIL 1HR SIDEWAYS DOWNTREND Crudeoil update
Oil prices slipped a 110+ points because traders are adjusting their positions after recent news.
On the one hand, talks between the U.S. and Iran last Friday showed some willingness to continue diplomacy, which reduced immediate fears of a U.S. military strike. That calmed the market, leading to mild selling in oil. On the other hand, Iran has not agreed to stop enriching nuclear fuel and has warned it could launch missile attacks across the Middle East if the U.S. attacks. So the risk hasn’t gone away.
if tensions flare up again, crude could easily move back
Crude has seen volatile swings recently due to geopolitical drivers — U.S.–Iran tension spikes lifted prices, while easing diplomatic fears pulled them back. This creates chop on the 1-hour chart, making breaks of key levels meaningful for intraday direction.

NATURALGAS BOOM Naturalgas gas make a high of 444on 21 Jan 26. It's good move. Entry was given near 297 . Keep Trial SL don't make new entry . It's news based Rally.
Tgt 350+

Nifty ATH vs. Trump’s War: Monday Levels to watchNifty just hit a historic All-Time High of 26,340 on Friday. But over the weekend, Donald Trump sent shockwaves through the world—attacking Venezuela and capturing Maduro. This Monday, we aren't just trading charts; we are trading geopolitics. Is this the end of the rally or a massive 'Buy the Dip' opportunity? Let’s look at the pre-market levels.

Crude Oil Long ??What could be the next move for Crude Oil after yesterday's attack of USA on Venezuela taking control of their Crude reserves. What does it mean for India, US Dollar and INR ?

$CRUDE will be very RUDE in upcoming months!on a weekly timeframe Crude consolidating in paraller channel making lower highs lower lows
in other angle its making a BULLISH FLAG pattern.
keep on watchlist.

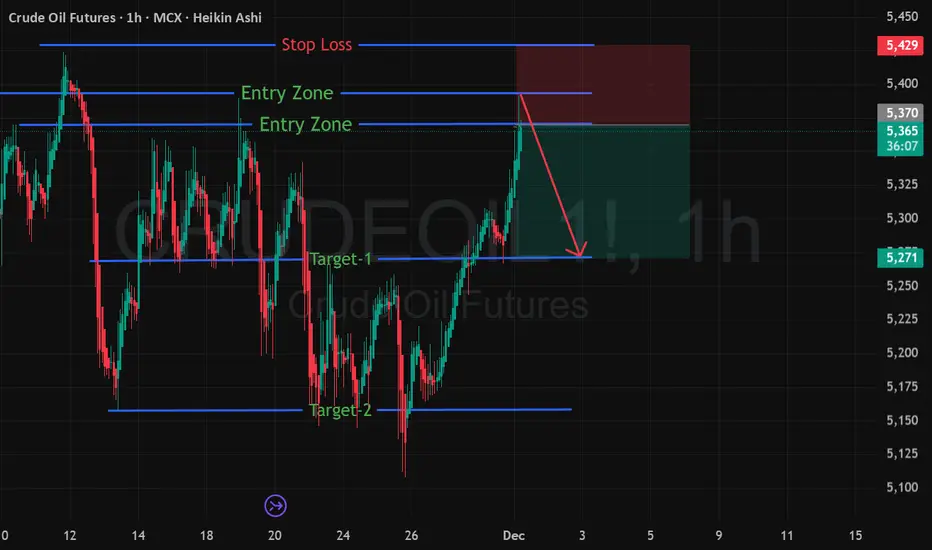
MCX CRUDE OIL (DEC-25) — Bullish Trend Setup IdentifiedA fresh Bullish Trend Entry Zone has been detected on MCX Crude Oil DEC-25, indicating a potential upside continuation from the demand zone.
📈 Trade Setup
🟢 Entry Range: 5370 – 5390
🔴 Stop Loss: 5430
🎯 Target 1: 5270
🎯 Target 2: 5170
📊 Chart Explanation
Crude Oil has recently shown strong accumulation behavior near the lower demand band. Price is now entering a bullish reversal range, supported by:
Prior demand zone retest
Higher-low structure
Increasing bullish momentum
Buyers absorbing supply near 5370–5390
This setup indicates a possible swing move towards the 5270 and 5170 zones.
⚠️ Risk Management
Keep SL strictly at 5430
Position sizing is crucial as volatility remains high
This analysis is for educational purposes—trade with discipline
📌 Summary
Crude Oil DEC-25 is showing a clean bullish continuation structure. If price sustains above the entry zone, we may see a strong move toward the mentioned targets.
Crude Oil FallImpact of fresh tarriff imposition on China by US has led to further fall in crude oil. Quoting below 200 EMA. If breaks the suppport then further fall can be seen this week.

CRUDE OIL By KRS ChartsDate: 2nd July 2025 / 19:35
Why Crude Oil ?
1. Starting with 1H Tf. Accumulation is visible with LLs to Sideways and now HHs & HLs
2. Crude oil Price is currently in Buy Zone with strong support.
3. Recent Gap Dow is likely to be Shakeout for Buyers.
4. In Bigger Timeframe price has made Low in March is likely to be the bottom as per Wave thoery.
5. After that bottom price on Higher low side price accumulating.
6. From Here it seems like bullish side trades will be better option for Crude Oil for Targets which are mentioned in Chart. (Medium Term View).

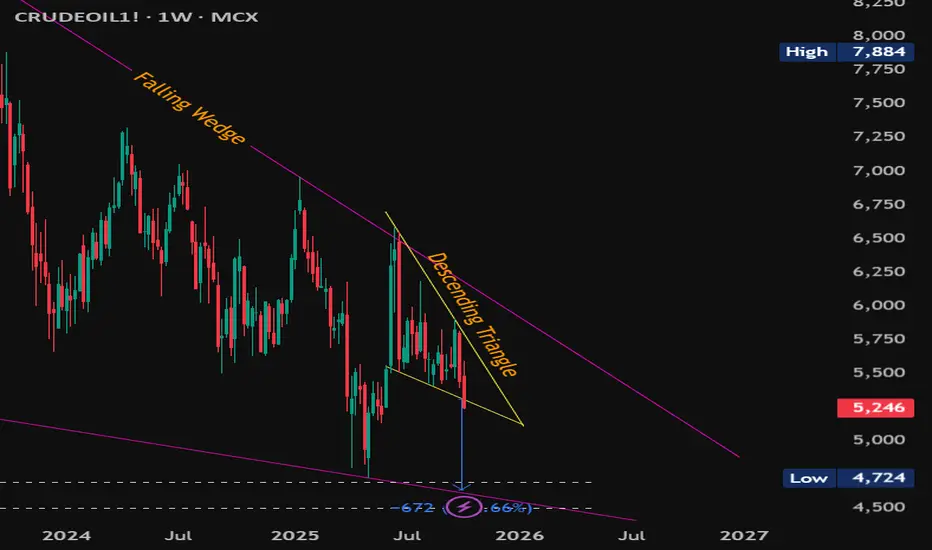
#MCXCrudeOil Weekly – Breakdown into Major Support Zone#MCXCrudeOil Weekly – Breakdown into Major Support Zone
CMP: 5,246
Crude Oil has broken down from a descending triangle with a confirmed weekly close below 5,308 , triggering target of 4,636 . This move unfolds within a larger falling wedge pattern , adding confluence and signaling potential volatility ahead.
This breakdown aligns with two key confluences :
📉 The falling wedge lower trendline.
🟠 A major historical demand zone at 4,692 – 4,499 , which was previous resistance turned strong support on multiple occasions.
This make-or-break support zone could act as:
🔄 A reversal zone , potentially triggering a bullish breakout from the wedge.
📉 Or, if breached, it may invalidate the wedge and lead to extended downside.
Key Levels:
Resistance: 5,903 & 6,184 (price action + wedge top)
Support: 4,692 – 4,499 (confluence zone)
Breakdown Target: 4,636 (descending triangle pattern)
Watch weekly candle behavior near this zone closely for signs of either rejection or continuation .
#CrudeOil #MCXCrude #ChartPatterns #FallingWedge #DescendingTriangle #PriceAction #BreakdownAlert #SwingTrading #CommodityTrading
📌 Disclaimer: This analysis is shared for educational purposes only. It is not a buy/sell recommendation. Please do your own research before making any trading decisions.
Crude Oil Levels For October 2025Important support and Resistance Levels For Crude Oil.
When Market touches the level, the price action plays important roles.
For More Learning Reach out to us.
Will crude drop to $61.70?hello,
according to my analysis on 2h time frame there is high probability that crude oil futures could drop to 61.7 IN FEW HOURS,

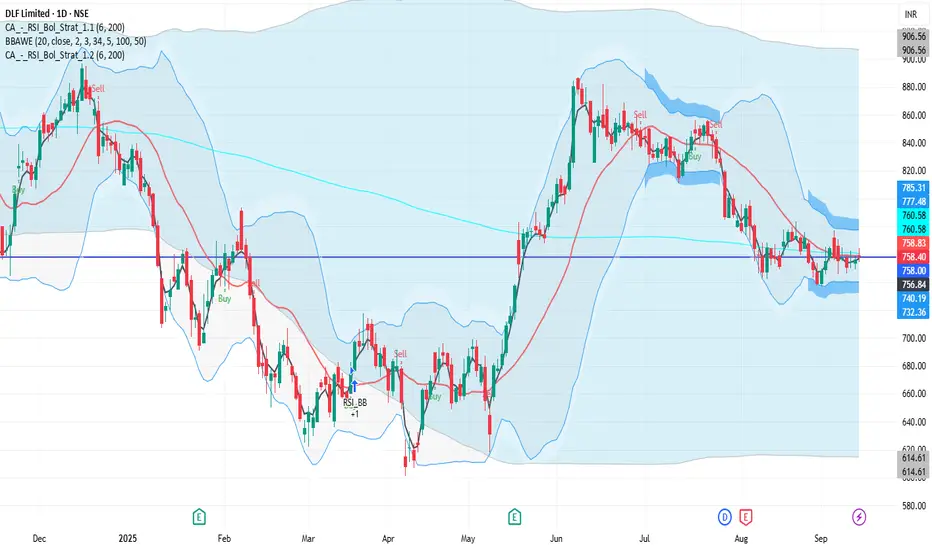
DLF 1D Time frame📉 Current Market Snapshot
Current Price: ₹758.40
Previous Close: ₹756.35
Day's Range: ₹754.20 – ₹764.40
52-Week High: ₹929.00
52-Week Low: ₹601.20
Market Cap: ₹1.87 lakh crore
P/E Ratio: 41.85
Dividend Yield: 0.79%
ROE: 10.76%
Debt-to-Equity Ratio: 0.10
Beta: 1.78
EPS (TTM): ₹18.12
Book Value: ₹172.51
Face Value: ₹2.00
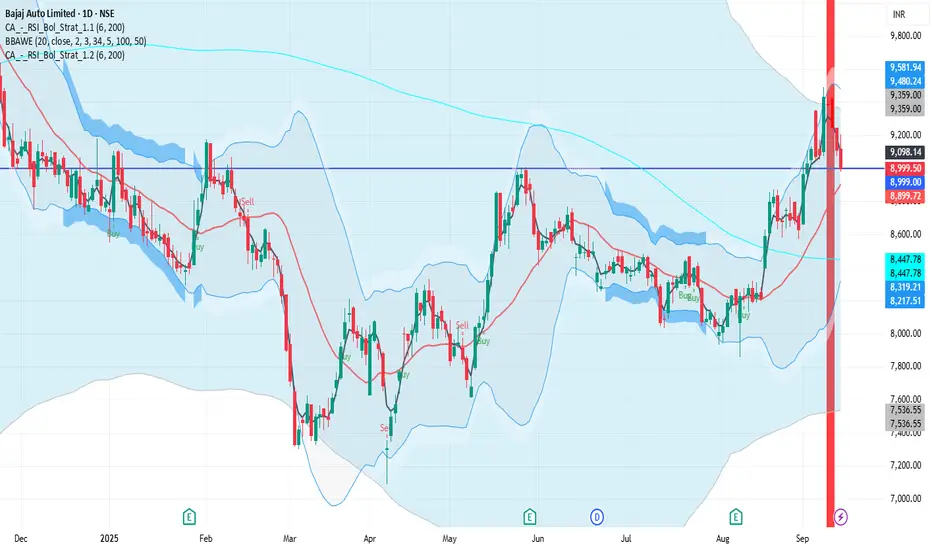
BAJAJ_AUTO 1D Time frame📉 Current Market Snapshot
Previous Close: ₹9,113.50
Today's Range: ₹8,979.50 – ₹9,205.00
Current Price: ₹8,999.50
Market Cap: ₹2,51,318 crore
P/E Ratio: 33.1
Dividend Yield: 2.33%
52-Week High: ₹12,774
52-Week Low: ₹7,089.35
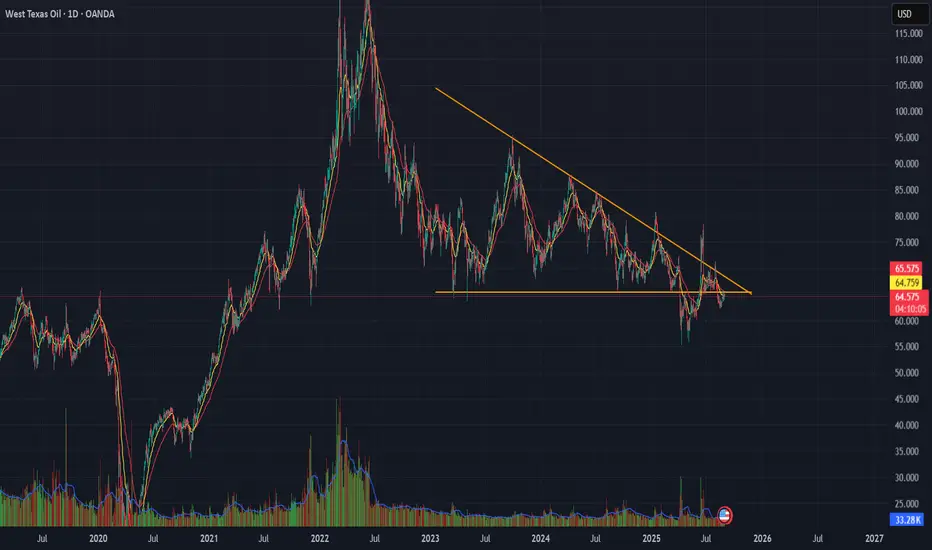
WTI Crude Oil Descending Triangle Pattern
WTI is forming a Descending Triangle pattern near recent support.
📊 Technicals : Flat base with lower highs compressing price action.
🔎 Key Levels: Breakdown below support 65 Leads To bearish continuation;
bounce above resistance 71 Leads To reversal setup.
⚠ Risk View: Energy fundamentals remain mixed — confirmation with volume is essential.
👉 Tactical takeaway: Wait for a breakout from the triangle before committing directionally.
CRUDEHello & welcome to this analysis
USOIL / CRUDE (MCX) after a very sharp rally till the slanting channel have now retraced to very strong support levels as per the ICHIMOKU indicator in daily time frame.
One could look for a 4hrs reversal candle confirmation between $64.50 - 63.75 / INR 5625 - 5450 for a resumption of rally till $77 / INR 6900 with resistance on its path at $68.50 & $74 / INR 5825 & INR 6400
Remember enter only after you get a bullish candle confirmation from lower time frame.
All the best


CRUDE LONG at 73.08 spotSL is 72.
CRUDE get some support at 73.08 in hourly chart.
Target could be 76.
1:2

CrudeOil in major resistance area may give breakout*$$CrudeOil is trading near major resistance area with positive news around the world for it. If Iran block Strait of Hormuz then it will give breakout from this area for target of 6655-6722 area & then 6988, 7301, 7500,7750.
If Iran problem solved with USA then it may fall also from this resistance area with fast momentum for target of 6033, 5633, 5155, 4733.
Please consult your advisor before taking any trade & with proper risk management.
Thank You

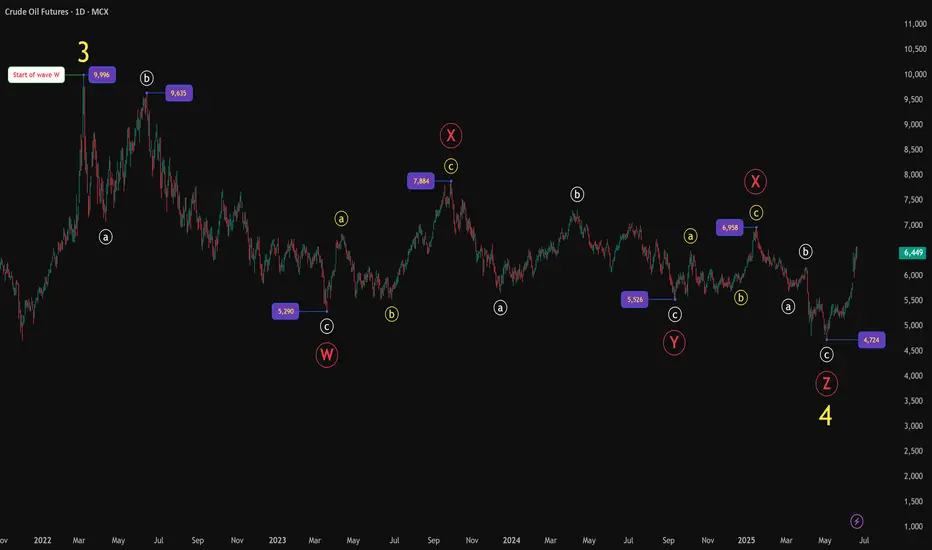
MCX Crude Oil: Complex Correction Complete?Big Picture Structure — Daily Timeframe
After peaking at 9996, Crude Oil entered a prolonged complex corrective phase, unfolding as a W-X-Y-X-Z structure, reflecting a Elliott Wave complex correction pattern.
Wave W formed via an initial abc decline.
Wave X delivered a corrective bounce.
Wave Y unfolded into another abc leg down.
A second X followed, creating further complexity.
Finally, Wave Z completed with a terminating abc decline, bottoming near 4724.
With this, the entire larger degree Wave 4 correction appears to have completed, setting the stage for a potential higher-degree advance.
Zoom In — 4H Timeframe Analysis
Zooming into the rally from 4724, price action unfolds very cleanly:
A strong 5-wave impulsive advance has developed.
Wave 3 displayed strong extension — a healthy sign of impulsive strength.
Wave 5 pushed to a higher high near 6585, completing a likely Wave (1) at smaller degree.
Notably, the final leg of this upmove developed with RSI bearish divergence, often an early warning of short-term exhaustion, suggesting a corrective Wave (2) pullback may now be developing.
Outlook Ahead
With higher degree Wave 4 likely behind us, attention shifts to the ongoing development of the larger degree Wave 5.
A corrective Wave (2) pullback may offer attractive entry zones for the next bullish impulsive leg.
As long as price maintains structural integrity above the 4724 low, the broader bullish outlook remains intact.
Summary
Complex W-X-Y-X-Z correction likely complete.
New bullish sequence underway.
Short-term corrective pullback (Wave 2) anticipated.
RSI divergence signals caution for immediate upside, but larger bullish trend remains intact.
Chart will be updated as price action evolves.
Disclaimer :
This analysis is for educational purposes only and does not constitute investment advice. Please do your own research (DYOR) before making any trading decisions.
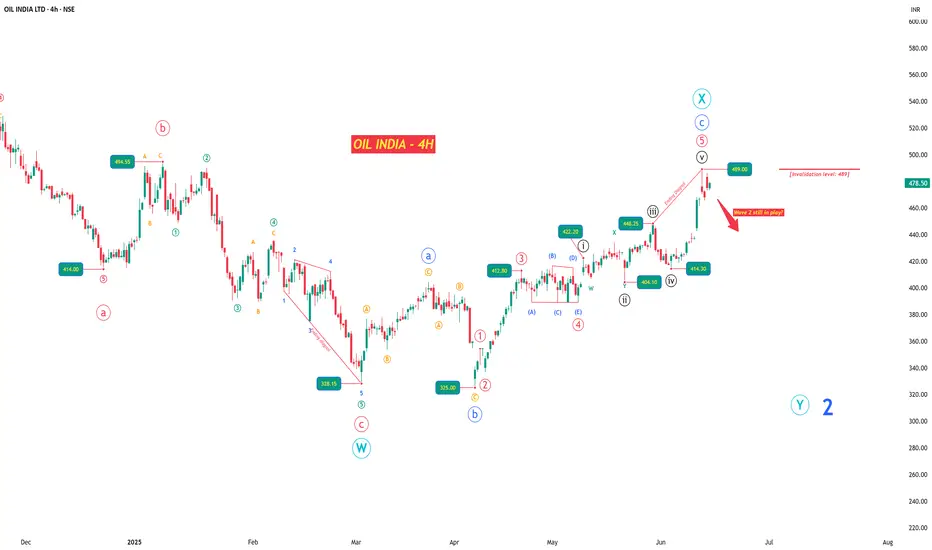
OIL INDIA LTD – Structure Tiring as Crude Starts Firing?What began as a heroic rally from ₹42 to ₹767 in a powerful impulse now finds itself wobbling under its own weight. OIL INDIA LTD’s chart tells a story of exhaustion — both structurally and contextually — just when crude oil is flexing again on the global stage.
Amid rising geopolitical tensions and war-like murmurs pushing crude prices higher, the Indian oil sector may be sailing into headwinds. And this isn’t just a macro hunch — the waves themselves are flashing caution.
After a Wave 1 climax near ₹767.90, price action has shifted into a corrective mode. I interpret the ongoing structure as a W-X-Y double zigzag , and within it, a key event unfolded: a classic ABC flat correction, beginning in March.
The April rally — which at first glance looks like a fresh impulse — is in fact the C leg of that flat. While it did unfold in 5 waves, the fifth wave formed an ending diagonal , complete with overlapping internals and fading momentum. This could be the last gasp .
Zooming into the 4H chart, the rise from ₹325 to ₹489 fits neatly into a corrective framework, not an impulsive one. That makes ₹489 a crucial invalidation level . If price stays below it, we likely begin Wave Y of the broader correction — a move that could push OIL INDIA back toward or even below ₹325.
However, if price breaches ₹489 and sustains, that’s your early signal that this entire bearish setup is off, and a new bullish sequence may be unfolding instead.
The stop-loss is tight, the downside wide. If this count holds, the risk-reward setup is highly favorable.
Further analysis continues in the notes below — covering multi-timeframe wave counts, internal structures, and confluences from RSI, volume, and Bollinger Bands.
Crude may bounce up to 5522 level.Crude oil is on bounce, As per chart Crude is showing divergence with morning start. It is at demand zone and add more if come down to 4900 level. It may test minimum 5522 level soon.

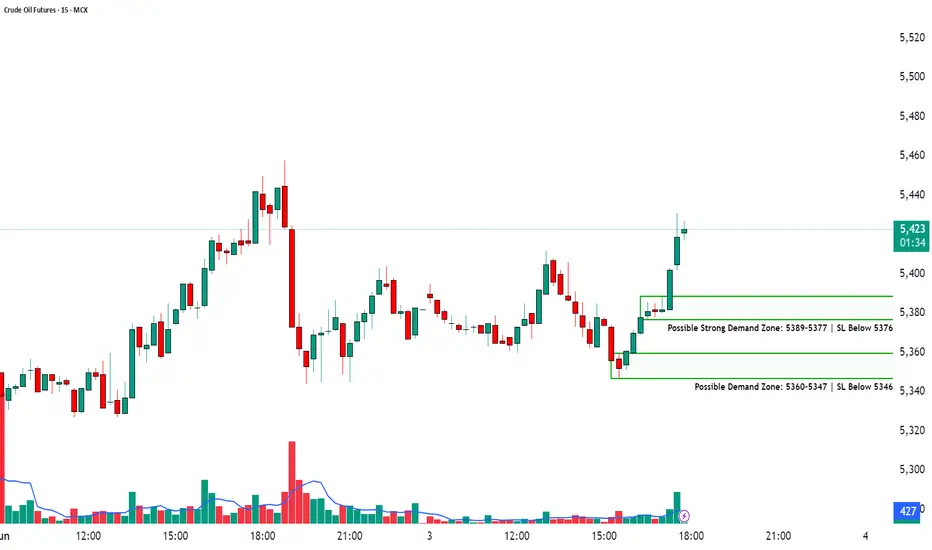
Demand Zone Breakdown + Trade Strategy📈CRUDE OIL FUTURES | 15-Min Chart Analysis
📆Date: June 3, 2025
Ticker: MCX:CRUDEOIL!
Chart Overview:
The chart highlights a bullish reversal from previously marked demand zones. Price sharply bounced with volume confirmation, indicating renewed buying interest.
Two demand zones have been marked for observation:
Possible Strong Demand Zone: ₹5389–5377 | SL Below ₹5376
Possible Demand Zone: ₹5360–5347 | SL Below ₹5346
Price is currently trading around ₹5,425, showing a significant up move post-demand zone test, suggesting buyer dominance in the short term.
Demand Zone Breakdown:
🟩🟩 Strong Demand Zone (₹5389–5377):
Strong volume-backed bullish engulfing formed after price dipped here.
Ideal zone for aggressive long entries with SL below ₹5376.
🟩 Lower Demand Zone (₹5360–5347):
Acts as deeper support and a conservative re-entry zone.
Long entries possible with SL below ₹5346 if retested.
How to Trade Demand Zones (Long Trade):
Wait for a retest of the zone.
Watch for bullish confirmation candles (hammer, bullish engulfing, etc.).
Enter long near the bottom of the zone.
Place SL just below the demand zone.
Stop-Loss Placement:
For Strong Demand Zone: SL below ₹5376
For Lower Demand Zone: SL below ₹5346
Targets: Use Risk-Reward Ratio
🎯 Use a 1:2 or 1:3 RRR to set logical target levels.
📌 Example: If risk is ₹10, target should be ₹20–₹30 above entry.
💡 Why Use Risk-Reward?
Sets clear and objective targets
Keeps emotions out of trading decisions
Helps maintain long-term profitability with disciplined risk control
⚠️ Risk Management Tip:
Always trade with a clearly defined stop-loss. Avoid impulse entries. Start with small quantities and increase size only with confirmation. Capital protection comes first.
📢 Disclaimer
This post is intended for educational and informational purposes only. It does not constitute investment advice or trade recommendations. Trading in commodities and financial markets involves risk. Please consult a SEBI-registered advisor before making financial decisions. The author is not SEBI registered and shall not be liable for any losses. Always use proper risk management and do your own research.
👉 Follow for more trade setups, chart breakdowns, and educational content to improve your trading edge. Stay informed. Trade smart. 📊📈