Crude Oil
Berger Paints : Beginning to peel off...!The meteoric rise that we have witnessed over the past two months in this counter by 80% has been nothing short of a spectacle. However, now it looks like the paint is beginning to loose its sheen and the formation of bearish harami with a trendline breakdown is hinting at a potential reversal to the downside. The momentum indicator RSI is clearly signaling serial divergences that could drag the prices lower. The sharp rise seen till date could now reverse and the profit booking could result in some sharp decline too. With the support emerging only around 463-468 one could look at initiating some shorting opportunity or atleast exit from long positions if any.
Idea Sourced From Neotrader
trade.chartadvise.com
A beautiful text book pattern A beautiful 2-day relationship pattern seen in crude WTI since morning. MCX crude last closed at 3804. Let us see how we react to the pattern now.
It's a pure textbook pattern tested and proven by the world's topmost traders.
Pattern name: OLHV
To learn the 7 (2 days relations) message me.
Thank You.
Crude oil 4h chart, technical looks weak.Crude oil 4h technical-looking weak. Bear pennant on the price itself and a rising wedge on 4h RSI both combination suggests a strong bearish sentiment. upcoming week we can witness so many stupid repeated news like economic slowdown, trump - china, Iran war, trade war,. and so many never-ending shits. so, technically we have to gauge the price where it's heading next.
Expected short term target 50 and 48.
Reasons and Confluences:
1. Bear pennant on the price itself.
2. Rising wedge on the 4h RSI.
3. Elliott Wave ABCDE pattern.
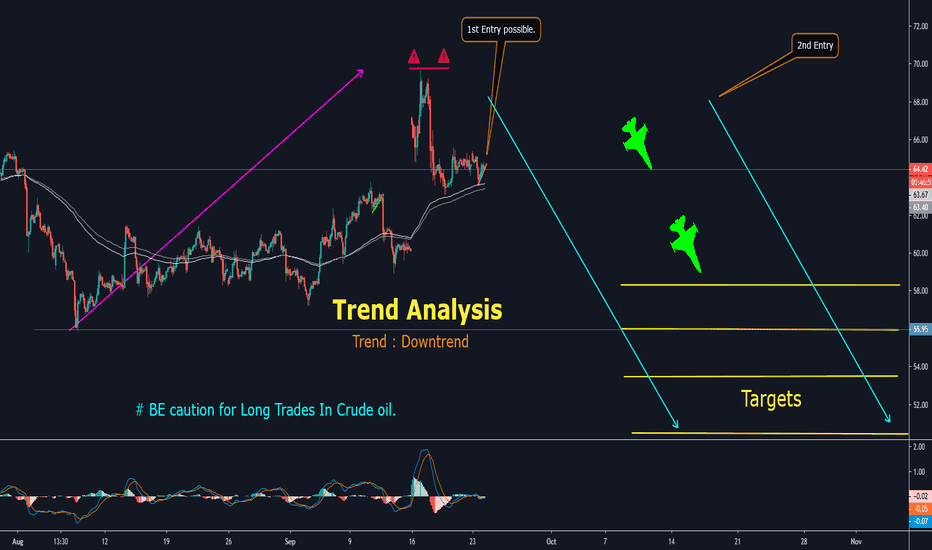
Crude Oil Downtrend & Trade Setup !!TREND ANALYSIS
Follow Chart Instruction.
Do not be Hurry for entry.
Wait for Proper Entry Setup.
Buy/Sell with Best Risk Reward.
Educational Chart Only.
You can Comment and ask the TREND ANALYSIS of any STOCK/SCRIPT/INDEX/FOREX.
Wait for 2nd entry setup, if available then short.
R:R is 8 to 15 times.


