BTC 1H: Rejection at Supply, Bearish Continuation RiskChart Analysis (1H BTC/USD):
Major Supply Zone (~90,000–90,200):
Price was strongly rejected from this area, confirming it as a key overhead resistance. Sellers remain active here.
Fair Value Gap (FVG) / Mid Resistance (~89,000–89,500):
The red FVG zone above current price acts as a likely pullback target, but also a strong sell zone if revisited.
Current Structure:
After the rejection, BTC broke down and is consolidating below short-term EMAs, indicating bearish momentum on the 1H timeframe.
Key Support Zones:
Near-term demand: ~86,700
Major downside target: ~84,600
Loss of the 86.7k support increases probability of a deeper move toward 84.6k.
Projected Path:
The dotted projection suggests a possible pullback into resistance (87.8k–89k) followed by continuation lower, unless price reclaims and holds above the FVG.
Bias:
Below 89k: Bearish / sell rallies
Above 90.2k: Bearish bias invalidated, trend may shift bullish
Cryptocurrencysignals

Solana Technical Reversal: MA Compression Resolves to the UpsideSolana is trading around 126 levels and there is a support which is being respected around 125 levels.
For last few weeks, no considerate candle is there. Only doji are being formed which shows the sideways moment in the charts.
If the market cycle changes, turning bullish, an entry can be made above 127 levels expecting a 10-11% movement in the crypto.
Major trend is bearish, Minor trend sideways.
The major support is around 100-110 level zone and there is not much of fall to capture as it has fallen 50% since Sept 2025.
On the hourly charts, there is a liquidity grab, taking out the bullish positions created on previous occassions.
A moving averages gate is also being created on the hourly charts as all the four EMAs (20, 50, 100 & 200) are moving in small range.
Now as per my view the market is trading in a range and it is also respecting a falling resistance line. A good R:R trade is there on the bullish side.
As per the plan, bullish position can be created in the assest once it crosses 127 levels.
Stop Loss :- 122.5
Target :- 144
R:R = 1:4
Multiple confluence there to enter the trade on the bullish side. Wait for the price action near the levels before entering the trade.

ETH Setup You Can't Ignore:4k FVG to 5k Seller Zone ⚠️ ETH Setup You Can’t Ignore: 4K FVG to 5K SELLER ZONE!
ETHUSD – Fair Value Gap & Liquidity Sweep Setup
Ethereum is trading within a critical range, presenting a potential ICT-style setup:
Fair Value Gap (4000–4200) – Key demand zone with a “Golden Line” midpoint; price may dip to fill this imbalance before reversing.
Seller Zone (~5000) – Major supply zone where profit-taking or distribution could trigger.
Bias – Expect a sweep of downside liquidity, a reaction within the FVG, and a possible rally toward the 5000 zone if higher timeframe confluence supports it.
⚠️ Always wait for confirmation and manage risk before execution.

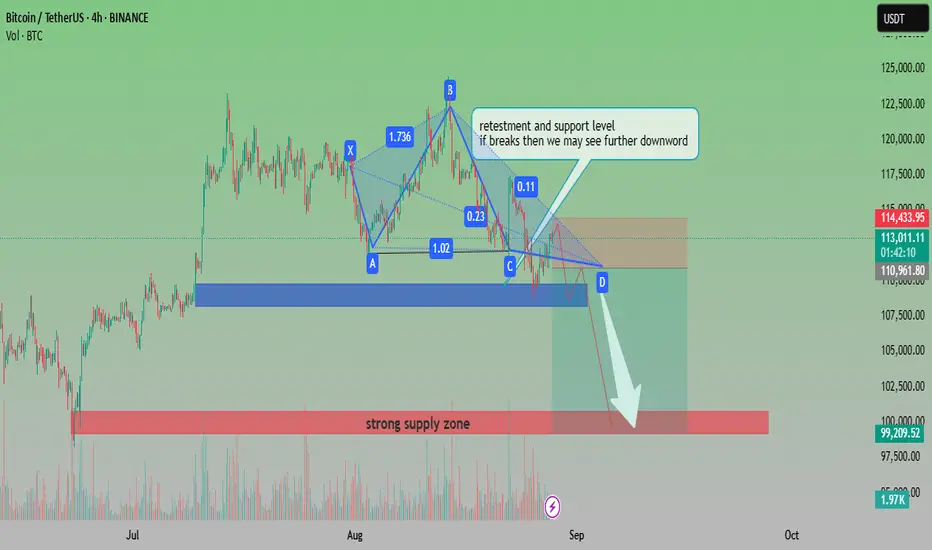
BTCUSDT Bearish Pattern with Key Support RetestAnalysis:
The chart shows Bitcoin (BTCUSDT) forming a harmonic pattern that signals potential bearish continuation. Price is currently retesting a critical support and resistance level around the 113,000–114,000 zone. If this level fails to hold, further downside movement is expected.
Pattern Formation: The harmonic structure (XABCD) suggests a bearish setup.
Support Zone: Around 110,900–111,000, a crucial level to watch.
Downside Target: If support breaks, the price could move toward the 99,000–100,000 strong supply zone.
Volume: A noticeable volume build-up supports potential continuation to the downside.
📉 Outlook: Bearish bias. A breakdown from current retest levels may accelerate selling pressure toward the 100k psychological zone.
BTC/USD Eyeing Breakout Toward $121.5K – Supply Zone Retest ?Current Price: ~$119,872 showing consolidation just above the 0.618 Fibonacci retracement level.
Structure: Price has bounced from the supply zone (~118.4K–118.6K) and is currently pushing upward.
Ichimoku Cloud: Price is trading within a cloud breakout attempt, indicating potential bullish momentum.
Fair Value Gaps (FVG): Two unfilled FVGs above suggest liquidity targets at ~$120.6K and ~$121.5K.
Support Levels:
Strong Support: ~$115.8K–116.5K.
Local Supply Zone Support: ~$118.4K.
Target: Main upside target sits at $121,533, aligning with a prior high and liquidity pool.
Trade Plan (Long Setup):
Entry: $119,700 – $119,900 (current consolidation zone)
Stop Loss: Below $118,400 (below supply zone)
Take Profit 1: $120,600 (first FVG target)
Take Profit 2: $121,533 (major resistance/liquidity target)
Risk/Reward Ratio: ~2.8
Notes: Wait for a bullish confirmation candle or 1H close above $119,900 before entering. Avoid chasing if price spikes without retest.
This plan follows the chart’s bullish structure and aims to ride the move into the untested liquidity areas above.
If you want, I can also give you a short scenario plan in case price rejects here. That would make this a full two-way trade setup.

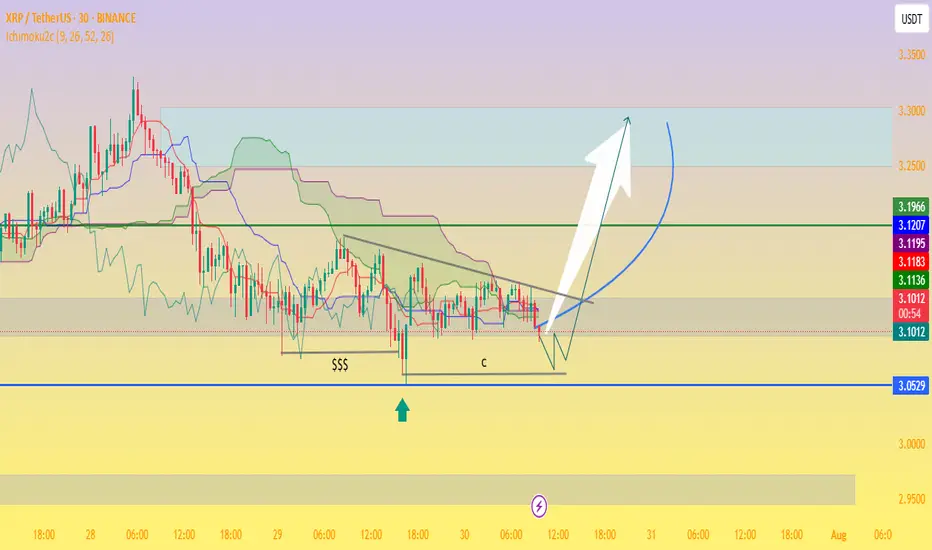
XRP/USDT Potential Reversal Zone — “Bottom Tested, Bullish!📉 Chart Analysis Summary
The divided chart indicates XRP trading between a critical support zone near $3.05–$3.09 and overhead resistance around $3.19–$3.23, forming what could be a bullish pennant or descending wedge setup on the 30-minute timeframe:
Support Zone (~$3.05–$3.09):
Price retested this level multiple times (labeled as “$$$” and “c”), clearly identifying a demand zone.
Ichimoku cloud support lies nearby, adding technical relevance to the floor.
Resistance Trendline & Green Line (~$3.19–$3.23):
A descending trendline is visible, showing lower highs and building compression.
A breakout above this resistance zone is necessary to signal bullish continuation.
Projected Path:
The schematic arrow suggests a bounce off support, followed by consolidation, and then a breakout above resistance, targeting the $3.25–$3.30+ zone and potentially higher.
🔍 Context from Recent Market Commentary
Support Holding Above $3.11–$3.15: Analysts highlight strong support around $3.11–$3.15, where institutional and retail interest appears concentrated
TradingView
+13
TradingView
+13
CoinCentral
+13
.
Resistance & Consolidation at $3.30: While XRP briefly surpassed $3.30, it encountered rejection and remains rangebound. A confirmed break beyond this level could validate the bullish carry-forward
CryptoPotato
CoinDesk
.
Wave-Elliott Bull Case: Various Elliott Wave scenarios forecast targets as high as $5.25, $6.85, or even $10–$15 should Wave 5 materialize, though this depends on market strength and momentum
CoinCentral
.
✅ Trading Outlook
Bullish Scenario:
Bounce off $3.05–$3.15 support.
Break above $3.23–$3.30 resistance.
Potential upside targets:
Near term: $3.30–$3.40.
Medium term: $4.64 or $5–$6, with strong case for $6.85 if momentum and on-chain demand strengthen
CryptoPotato
+15
TECHi
+15
CoinGape
+15
.
Bearish Scenario:
Failure to hold $3.05–$3.11 risk retest toward $2.95 or lower zones ($2.30–$2.70)
TECHi
.
🧭 What to Watch
Key Level Role
$3.05–$3.11 Critical support/demand zone
$3.19–$3.23 Short‑term resistance/framing compression
~$3.30+ Confirm bullish breakout — key trigger for Wave 5 and higher targets
🧠 Overall Take
This chart is painting a classic consolidation near strong support with a visible descending upper boundary. If XRP holds the ~$3.05 zone and breaks above $3.23–$3.30 with conviction, it could initiate a bull move toward $3.40–$4.00, and potentially even $5–$6+ depending on volume and momentum.
However, breaks below $3.11 may open deeper downside risk. For many traders, this is a simple risk-reward setup: entry near the lower channel with a stop under $3.05 and initial profit targets at $3.30–$3.40.
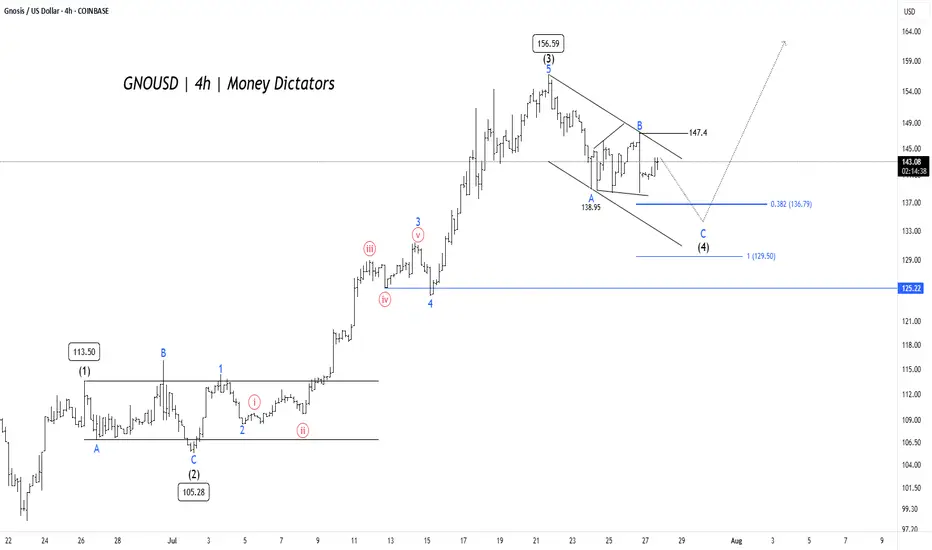
GNO/USD Price Action Aligns for Final Wave 5 PushGNO/USD pair is unfolding a clean Elliott Wave impulse pattern on the 4-hour chart. The rally began with Wave (1) reaching 113.50, followed by a corrective Wave (2) that bottomed near 105.28. This set the stage for a powerful Wave (3) that surged to 156.59 , aligning well with Elliott Wave theory where Wave 3 is typically the strongest and steepest leg in the sequence.
Wave (4) is now in progress, taking the form of an A-B-C correction inside a descending channel. Interim support was found at 138.95 during Wave A, and Wave C could extend toward the 0.382 Fibonacci retracement level at 136.79 or the deeper support zone near 129.5. These levels are crucial, as they often mark the end of a corrective phase and the beginning of the next impulse. A confirmed breakout above 147.4 would signal the start of Wave (5) and the return of bullish momentum.
Short-term targets have the potential to reach 135 – 128 , while 125.22 remains the invalidation level for this bullish setup. After the completion of Wave (4), traders can look for long opportunities targeting 147 – 154 – 172 . As long as the structure holds and price respects key supports, the outlook remains favorable for a fresh push higher in Wave (5).
GBPUSD BUY LONG!!!!!As per my view,
Price retrace to 0.618 area and shows good support from that area.
So the upside liquidity areas are 1.3729 and 1.3789.
Plan your trade according to this with your own risk.
Bonus point ----- if today candle close bullish means then the target will definitely reach.

Bitcoin Bounce Alert: Holding the $100K Fortress! 📉 Market Context & Technical Levels
Key support at ~$100K: As the chart shows and multiple analysts confirm, this level continues to act as a strong defence zone. Cointelegraph noted bulls have been “defending the $100K key support level strongly,” triggering bounces during dips
Descending channel overhead: Bitcoin has retraced into a downward channel. A clean breakout above ~107K–109K (past recent peaks) is needed to signal a bullish shift .
Liquidity target at ~106K: Plenty of orders await in that region—flipping it to support may pave the way for another push higher .
📊 Indicators & Momentum
RSI dip near 25 during the latest drop indicates oversold conditions—often a precursor to rebounds
.
Volume surge on rebounds suggests absorbing sell pressure and strong accumulation interest at lower levels.
🚩 Key Price Zones to Watch
Level Significance
$100K Crucial support; losing it risks a slide toward $95K–97K or even $92K
.
$105K–106K Liquidity zone; flipping here as support could confirm upward momentum .
$107K–109K Resistance from channel tops and prior highs; a successful break is key to next leg up .
$112K–$112K+ If breakout occurs, upside targets extend toward prior ATH near $112K and beyond .
🎯 Chart Analysis Summary
Your chart shows three distinct bounces from the $100K–100.7K supply zone (highlighted in blue) and the latest one includes a sharp wick and rebound. This aligns with broader market dynamics emphasizing support at $100K and building liquidity at $106K. The arrow projection signals a probable retest of ~106K, with room to challenge ~107–109K after consolidation.
🧭 Trade Outlook
Bullish scenario: Hold above $100K → reclaim $106K → trendline breakout → potential rally to $112K+.
Bearish risk: Fails support at $100K → breakdown toward $95K–92K region.
📌 Bottom Line
Support $100K is alive and well. Bounces have been crisp and volume-backed.
Next test lies at $105–106K. That’s the battleground—flip it, and we may see bitcoin reclaim recent highs.
Watch the channel overhead (~107K–109K). A breakout could open the door to fresh records.
✅ Conclusion: BTC is defending its psychological base firmly. If this zone holds once more, the path to $106K and beyond is in focus. Breaking above demands conviction, but it’s the pivot to watch.

Advanced Institutions Option Trading - Part 8Institutional Option Trading Strategies
Let’s dive deeper into how big players operate:
🔶 Volatility Arbitrage:
Take advantage of IV mispricing across strikes/months.
Long low IV, short high IV – Net neutral delta.
🔶 Dispersion Trading:
Buy individual stock options, short index options.
Profit from correlation divergence.
🔶 Box Spread (Synthetic Arbitrage):
Arbitrage between synthetic long/short positions.
Very low risk, used by HFT desks.
Institutions use algorithms to run thousands of such strategies in real time.

Advanced Institutions Option Trading - Part 6 Volatility Tools in Options
Understanding volatility is central to success in option trading:
🌀 Types of Volatility:
Historical Volatility (HV): Based on past prices
Implied Volatility (IV): Market’s expectation of future movement
📊 Volatility-Based Strategies:
High IV: Sell premium – strategies like Iron Condor, Credit Spreads
Low IV: Buy premium – strategies like Long Straddle, Long Call/Put
Tools like IV Rank and IV Percentile help traders choose the right strategy based on volatility regime.

Option Trading Master classIntroduction to Investing and Option Trading
Investing and option trading are two pillars of wealth creation and risk management in modern finance. Investing focuses on long-term growth by acquiring assets that appreciate over time, while option trading involves strategic bets on price movements within a defined period using derivative contracts. Together, they offer investors a combination of growth, income, and hedging capabilities.
What is Investing?
Definition:
Investing is the process of allocating money into financial instruments (like stocks, bonds, ETFs, or real estate) with the expectation of generating a return over time.
Key Objectives:
Wealth accumulation
Passive income generation
Capital preservation
Beating inflation
Common Asset Classes:
Equity (Stocks): Ownership in companies
Fixed Income (Bonds): Lending capital to earn interest
Real Estate: Physical properties generating rental income
Mutual Funds/ETFs: Pooled investments
Commodities and Gold: Inflation hedges

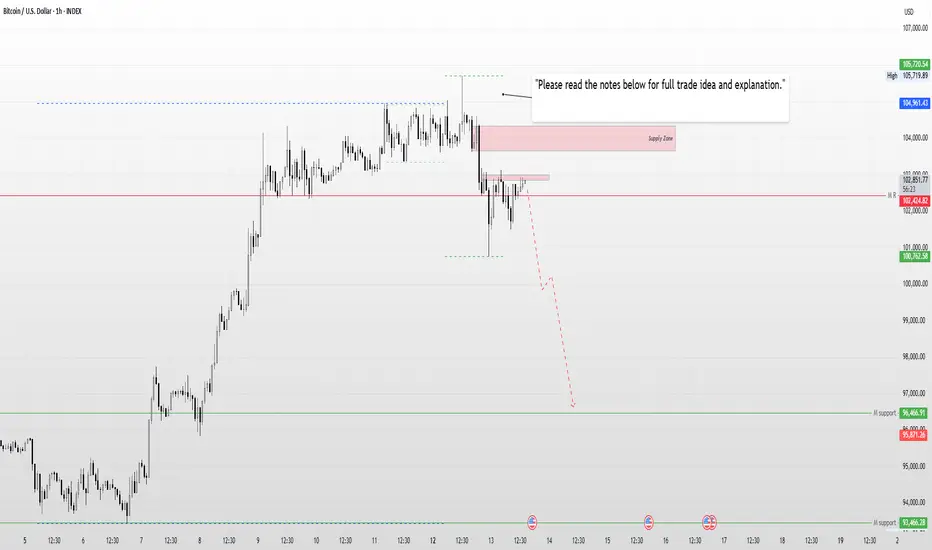
Bitcoin (BTC) Technical Outlook – Caution Advised for Retail Tra🪙 Bitcoin (BTC) Technical Outlook – Caution Advised for Retail Traders
The broader market structure for BTC remains bullish, no doubt. However, on the daily timeframe, we’ve observed a clear bearish move, indicating potential short-term weakness.
Key Resistance Levels to Watch:
First Resistance: 102,851
Second Resistance: 103,665
Both of these levels could act as potential zones for a sell-off, especially if BTC shows signs of exhaustion near these zones. If price reacts bearishly here, we could see a corrective move towards the 96,466 level, which serves as a reasonable downside target.
Important Scenario to Monitor:
If the market attempts a liquidity hunt above the second resistance at 103,665, the situation could get tricky. While this might look like a breakout, it may not sustain bearish momentum beyond that level — indicating market indecision or a possible trap.
⚠️ Final Note for Retail Traders:
BTC is currently creating confusion, and retail traders should exercise extra caution. The market might visually appear to be setting up for a sell, but could quickly reverse, shaking out early entries. Avoid trading emotionally and wait for clear confirmation before entering positions.
importance of trendlines & how to spot winning trade through itTrendlines are a fundamental part of technical analysis and are used to identify the direction of an asset’s price movement over a specific period. They act as visual representations of market sentiment and help traders make informed decisions about entry and exit points. Let's break down the **importance of trendlines** and how to spot **winning trades** using them:
**Importance of Trendlines**
1. **Identifying Market Trends**:
- **Uptrend**: A trendline drawn below the price action (connecting the lows) shows that the market is in an uptrend. This means that the price is generally moving higher over time.
- **Downtrend**: A trendline drawn above the price action (connecting the highs) shows that the market is in a downtrend, indicating that the price is moving lower over time.
- **Sideways/Range-bound**: If the price is moving sideways without a clear direction, trendlines can help outline support and resistance levels and the range within which the asset trades.
2. **Support and Resistance Levels**:
- Trendlines act as dynamic support (in an uptrend) and resistance (in a downtrend) levels. They help to predict where price might reverse or consolidate.
- **Support**: In an uptrend, a trendline can serve as a floor where price bounces upwards.
- **Resistance**: In a downtrend, the trendline can act as a ceiling where the price may struggle to rise past.
3. **Trend Continuation or Reversal**:
- When the price reaches a trendline (either support in an uptrend or resistance in a downtrend), traders watch for signals of either trend continuation or reversal.
- If the price breaks through the trendline with volume, it can signal the end of the trend and the potential for a trend reversal.
4. **Visualizing Price Patterns**:
- Trendlines help you spot classic chart patterns like triangles, wedges, and channels, which are essential for predicting price breakouts or breakdowns.
- Patterns like ascending triangles (bullish) or descending triangles (bearish) often form when the price is approaching trendlines, giving traders opportunities to enter trades.
### **How to Spot Winning Trades Using Trendlines**
1. **Confirm the Trend**:
- The first step is to identify the overall market trend using trendlines. This could be an uptrend, downtrend, or sideways trend.
- **Uptrend**: Draw a trendline connecting higher lows (supports). Only enter long positions in this case.
- **Downtrend**: Draw a trendline connecting lower highs (resistances). Only consider short positions when the price is near the trendline.
2. **Breakout/Breakdown Points**:
- The most significant trading opportunities arise when the price breaks through a trendline. A **breakout** (in an uptrend) or **breakdown** (in a downtrend) signals a potential change in market sentiment.
- **Breakout**: When the price breaks above a descending resistance trendline in an uptrend, it’s often a bullish signal, suggesting the price may continue higher.
- **Breakdown**: When the price breaks below an ascending support trendline in a downtrend, it’s a bearish signal, suggesting the price could move lower.
3. **Trendline Bounce**:
- If the price approaches the trendline but doesn’t break it, this could be a sign of trend continuation. A **trendline bounce** occurs when the price hits the trendline and reverses in the same direction as the trend.
- In an uptrend, a price bounce off an ascending trendline indicates continued buying pressure, and a trader might enter a long position.
- In a downtrend, a bounce off a descending trendline signals continued selling pressure, and a trader might enter a short position.
4. **Confluence with Other Indicators**:
- Combining trendlines with other technical indicators like moving averages, RSI, MACD, or candlestick patterns improves the reliability of your trade signal.
- For example, if a price bounce off an uptrend trendline coincides with an oversold condition on the RSI, this increases the probability of a winning trade to the upside.
- Similarly, if a price breaks below a trendline and is confirmed by a bearish MACD cross, that signals a stronger likelihood of a downtrend continuation.
5. **Volume Confirmation**:
- Volume is a critical tool in confirming the strength of a trendline breakout or breakdown. A **breakout with high volume** suggests that the price move is supported by strong market interest and is more likely to continue.
- A **breakout with low volume** could indicate a false signal or a lack of commitment to the price move.
6. **Trendline Reversal Patterns**:
- Watch for trendline reversal patterns like **head and shoulders** or **double tops/bottoms**. These patterns often signal a trend reversal when the price fails to break through a trendline and instead forms a new price structure.
- A **head and shoulders** pattern in an uptrend often leads to a trend reversal to the downside. Conversely, a **double bottom** at a trendline support level might signal a reversal from a downtrend to an uptrend.
**Example of Using Trendlines in a Winning Trade**
#### Step-by-Step Process:
1. **Identify the Trend**:
Draw a trendline connecting the lows in an uptrend, or the highs in a downtrend.
- Example: You see the price is in an uptrend, consistently forming higher lows.
2. **Look for Trendline Bounce or Breakout**:
- As the price approaches the trendline, observe whether it bounces off the trendline or breaks through.
- Example: The price approaches the trendline support and bounces off, signaling that buyers are still in control.
3. **Confirm with Indicators**:
Look for confirmation using other indicators. If the RSI is above 30 (indicating bullish momentum) and the price is bouncing off the trendline, the setup looks favorable for a buy.
4. **Enter the Trade**:
- **Long Trade**: You enter a long position after the bounce from the trendline, with a stop loss just below the trendline (to protect against a breakout below).
- **Target**: Set a profit target based on the previous resistance level or use a risk-reward ratio of at least 2:1.
5. **Monitor Volume**:
Check if the volume is increasing, indicating strong participation. If volume is higher during the bounce, the trend is likely to continue, and your trade could be successful.
**Summary**:
- **Trendlines** are vital for determining the direction of the market, identifying potential support and resistance levels, and confirming trend continuation or reversal.
- **Winning trades** are spotted when price action interacts with trendlines — either by bouncing off them (continuation) or breaking through them (reversal).
- Always combine trendline analysis with volume and other indicators to improve the reliability of your trade decisions.
Using trendlines consistently and understanding their significance can greatly improve your trading strategy and help you identify high-probability trading setups.

Bitcoin Trading Strategy for 15th November 2024 IST 1630 HRSBitcoin Trading Strategy: Buy Above 89,800 / Sell Below 86,600
Current Price: 89,506.00 USD
Key Levels:
Buy Signal: If the price closes above 89,800 on the one-hour candle, it indicates an upward momentum, suggesting a good time to consider buying.
Sell Signal: If the price closes below 86,600 on the one-hour candle, it suggests a downward momentum, indicating it might be a good time to consider selling.
Market Analysis:
The current price is around 89,506.00 USD, indicating potential bullish activity.
Pay close attention to the range between 86,600 to 89,800 for support and resistance levels.
Recommendations:
Buy: If the price sustains above 89,800 on the one-hour candle close, consider entering long positions. Book partial profits at 89,700 levels or use a trailing stop loss to protect your profit, with targets at 90,000 and 90,500.
Sell: If the price breaks below 86,600 on the one-hour candle close, consider short positions. Book partial profits at 86,700 levels or use a trailing stop loss to protect your profit, with targets at 86,000 and 85,500.
Disclaimer: This analysis is for educational purposes only. Please conduct your own analysis before making any trading decisions.

Bitcoin Weekly TA & Commentary- Bitcoin is currently trading at 79,446$
- Bitcoin has printed a new All Time High today and we can expect this rally to continue until 84,120$ or 89,333$
- Bitcoin is currently carrying a huge parabolic momentum where we can expect large expansions and retractions this week
- From an accumulation perspective you should wait for dip and the point of interest lies at 70,000$ and 73.5k, if you see 70k getting breached then we can see 66,000 coming in play
- If you are already holding Bitcoin and confused where to lock in partials then you can watchout these 2 zones
- 84,120$
- 89,333$
- Lock in partials to roll over the same money in dips to either add BTC or Alts its upto you

SUI ATH Technical Analysis & Commentary- SUI is currently trading at 3$ and printed another new All time high
- SUI is driving a lot of FOMO amongst retailers
- SUI has shown real outperformance when compared to Altcoins
- SUI is currently in a price discovery mode
- Accumulation Zones for Spot Buys: I have drawn 2 accumulation zones that you all can keep your radar on these two zones are highly conservative and efficient in terms of spot buys
- Short Term Targets: 3.5$ and 4.1$
- Note: If you are already holding SUI and if you are in a massive profit start locing in partials and utilize the same money to add in dips. Never leave gains on the table

Solana Next Target is 174 USD, Gain +20% ProfitIn Solana, Triangle Pattern formed and Expecting Breakout. So Next Target is Top of the Triangle Pattern, Target price is around 174 USD. Potential to Achieve a +20% percentage Profit.
I want to help people to Make Profit all over the "World".

NEIRO/USDT Neiro Limit Long. A nice retracement on Neiro, it has now approached the main support I was waiting for, the Risk to Reward ratio is good here. Entry and Sl as per the chart.

Ethereum 1D Technical Analysis & Commentary - Ethereum is currently trading at 2614$
- Ethereum got exactly rejected from the same point of interest where it showed us a bearish rally from
- Ethereum has the last FVG left around 2500-2550$ and once that is filled, I anticipate the huge demand side Imbalance to get filled.
- We have a huge imbalance from 3600$ where we saw Ethereum flat falling from, that will soon be covered once we see a weekly close above 2800$
- Study Price Behaviour and Price Action as of now, for spot buyers ethereum under 2700$ is a gift and you shouldn't miss that
- Spot Accumulation Zones: 2400-2580$
- Once ETH/BTC turns bullish you will see ETH and its whole ecosystem flying
- Till then hold it and you will soon see this moving impulsively, always manage risk.

Solana Long Term Analysis- Solana is currently trading at 146$
- Solana is building up a strong base where I easily see Solana purging 200$
- Solana from a Spot Accumulation perspective is sitting at a very bargained price if you are still fiat then add 50% Sol here
- From a swing trade perspective Solana can easily yield 20% from its current price and go up to 163-178$
- Solana's fundamentals are strong so in a major bull run you can expect Solana to easily move up to 500%
- Solana tops all the crypto when it comes to transactions
- Solana also tops all the cryptos when it comes to meme coins listing
- After considering all these points, please avoid becoming overly optimistic and thinking that Solana at this price is the only great option, so you should invest all your funds. Instead, consider adding 50% of your desired investment size here and wait for a significant price drop. If the price doesn't drop further, you can still benefit from the 50% you've invested and let it reach your financial goals.

Ethereum 1D Technical Analysis & Commentary- Ethereum is currently trading at 2448$
- Ethereum has been moving in a range since August 2024
- Ethereum has also underperformed Bitcoin after its ETF approval that's another thing to notice
- Ethereum/BTC has been slaughtered like anything and that's another way to track when ETH will outperform BTC
- ETH/BTC is currently in a free fall and I see 2 Major areas where I expect a reversal from
: 1st - 0.029
: 2nd - 0.021
- Ethereum's ecosystem and Altcoins will only pump hard the ones related to the ETH ecosystem when we see Ethereum flipping 2800$ and making a weekly close above it post that we might see a strong recovery in Alts like OP, ARB, Matic, and so on.
- Meme coins based on the ETH ecosystem are already performing nicely, but if ETH takes over then they will also turn parabolic so watch out PEPE it's a narrative play
- Ethereum has started building a base now, the bigger the consolidation the larger the expansion is going to be, mind that
- Spot Ethereum accumulation at this price is best from a conservative approach you can easily expect 100% in a quarter if your average price is 2500$

BITCOIN LONG 67k!!!!!!!!!!Price rejecting from weekly fvg
Price already taken fvg in daily timeframe
So there is no resistance in up side until 67k
make your strategy so simple to trade simple
Learn it and do it.
