BTCUSDT Perpetual – Short Idea (FVG + Supply Rejection)BTC price faced rejection from a higher timeframe resistance zone and left a visible Fair Value Gap (FVG) above. Current structure shows consolidation below supply, increasing the probability of a downside continuation if the zone holds.
Trade Plan
🔻 Short Entry Zone: 93,300 – 93,500
🛑 Stop Loss: 94,000 (above resistance)
🎯 Targets:
• TP1: 92,400
• TP2: 90,500,
Confluence
HTF resistance rejection
FVG acting as supply
Weak follow-through after bounce
Range low liquidity resting below
📌 Risk Management :
Wait for confirmation on lower timeframe. Invalidation only above the marked supply.
⚠️ Not financial advice. Trade responsibly.
Cryptomarket

#ETH.P Guns loaded and ready for the big battleThe ETH is turning around after a good consolidation zone. After erasing the 2025 gain, the ETH is not set for running the next major cycle with the support from the whales. This cycle will be huge for ETH. Are you in the game already?
Disclaimer:
It does not constitute financial advice, investment recommendations, or trade signals.
The creator and Systematic Traders Club are not responsible for any financial losses resulting from the use of this indicator.
Trading and investing involve risk. Always do your own analysis and use proper risk management.

#BTC.P Up for next super cycle?
BTC is in a corrective downtrend within a defined channel and is currently reacting from a higher-timeframe demand zone. The setup anticipates a potential trend reversal contingent on a confirmed breakout and acceptance above the descending trendline and mid-range resistance. Upside expansion is expected only after structure flip and consolidation; failure to hold demand invalidates the bullish bias. This is a conditional re-accumulation setup, not a blind bottom call.

ETH Looks Bullish .Why No one is talking about this? What is see : strong 💪 breakout . Better to enter on retest.

Bitcoin Is Quiet Again — That’s Usually When Big Moves BeginBitcoin spent multiple sessions moving sideways inside a clearly defined accumulation range.
This kind of price behavior usually signals one thing, strong hands are building positions while weak hands get shaken out.
Sideways markets are not random. They are preparation phases.
Price remained compressed inside the accumulation zone, showing balance between buyers and sellers with declining volatility.
The breakout candle was decisive and impulsive, indicating acceptance above the range rather than a fake move.
After breakout, price pulled back into the prior range high, which is a classic bullish retest behavior.
As long as price holds above the breakout base, the structure favors continuation toward the expansion zone marked on the chart.
A failure back inside the range, would invalidate the breakout and shift momentum back to neutral.
If this helped you read price better, like, follow, or comment, more clean structure studies coming.
⚠️ DISCLAIMER: This analysis is for educational purposes only and is not financial advice. Markets involve risk. Always manage your position size and do your own analysis.

BTC Technical Outlook – Cycle High WatchBitcoin is potentially entering the final push of the current cycle, with price action forming a Head & Shoulders (H&S) structure near the newly formed ATH. While this pattern is not confirmed yet, it does raise caution for a possible local top.
📈 Upside Scenario:
Our immediate focus remains on the $111,000 zone, which aligns with a potential liquidity grab area. A push into this region followed by strong rejection would strengthen the bearish case.
📉 Risk Zone to Monitor:
If rejection occurs near $111K, attention will shift to the neckline area, which will be crucial in confirming the H&S breakdown.
⚠️ Key Takeaway:
Bullish continuation remains valid until rejection is confirmed
$111K = key upside target & decision zone
Neckline break would confirm trend exhaustion
_Wait for confirmation. Trade the reaction, not the prediction._

Solana Technical Reversal: MA Compression Resolves to the UpsideSolana is trading around 126 levels and there is a support which is being respected around 125 levels.
For last few weeks, no considerate candle is there. Only doji are being formed which shows the sideways moment in the charts.
If the market cycle changes, turning bullish, an entry can be made above 127 levels expecting a 10-11% movement in the crypto.
Major trend is bearish, Minor trend sideways.
The major support is around 100-110 level zone and there is not much of fall to capture as it has fallen 50% since Sept 2025.
On the hourly charts, there is a liquidity grab, taking out the bullish positions created on previous occassions.
A moving averages gate is also being created on the hourly charts as all the four EMAs (20, 50, 100 & 200) are moving in small range.
Now as per my view the market is trading in a range and it is also respecting a falling resistance line. A good R:R trade is there on the bullish side.
As per the plan, bullish position can be created in the assest once it crosses 127 levels.
Stop Loss :- 122.5
Target :- 144
R:R = 1:4
Multiple confluence there to enter the trade on the bullish side. Wait for the price action near the levels before entering the trade.

Weekly Analysis of BTC with Buy/Sell scenarios...We analyzed three weeks back that BTC would be in range for some time before taking any further move, And BTC is following same analysis and trapped within a small range since then. BTC prediction of last week also worked perfectly well and market kept in consolidation mode itself. BTC is still in consolidation zone and may spend some more days. It may develop ABC pattern or reversal at identified daily FVG level, if price has to change its delivery and take turn from here. This zone is kind of make or break. If price is not able to sustain and breakdown, then it may witness ~65-70K levels as well.
We hope for reversal from this level as price is developing the pattern at higher time frame.
1. Price has taken liquidity or 82K and almost touched 80K.
2. It has inversed 1Day FVG and now price is consolidating in the range between EMAs.
3. We may expect price retracement till 1D iFVG and then reversal.
4. Before to that we may see sweep of 92900 (1D CISD) level and then a retracement short trade till 1D FVG
5. Most probably price will take liquidity of FVG/RDRB level and create MSS/CISD/TS/iFVG in LTF.
6. Price should show rejection/reversal in respective LTF (5m/15m) at FVG zone.
7. Take the trade only once clear entry model i.e. turtle soup. iFVG break, CDS or MSS happens on LTF
All these combinations are signaling a high probability and ~8R trade scenario.
Note – if you liked this analysis, please boost the idea so that other can also get benefit of it.
Also follow me for notification for incoming ideas.
Also Feel free to comment if you have any input to share.
Disclaimer: This analysis is for educational purposes only and does not constitute investment advice. Please do your own research (DYOR) and check with your financial advisor before making any trading decisions.

Zoom Out: Bitcoin’s 14-Year Structural Expansion Explained!Hey Everyone, let's analyse long term structural view on Bitcoin as it is once again sitting inside the same structural expansion channel it has respected for more than 14 years.
Zooming out removes the noise, what looks random on lower timeframes reveals a very consistent long-term pattern.
Most traders focus on headlines. Long-term moves are built on structure.
Bitcoin has never moved randomly on higher timeframes. Every major cycle since 2011 has expanded inside a rising macro channel driven by demand, time, and liquidity.
Each cycle looks different on the surface, but the internal structure remains the same, higher lows forming on macro support, followed by exponential expansion phases.
Current price is still respecting the long-term rising structure, with buyers consistently stepping in near the lower boundary of the channel.
The upper zone shown is not a prediction. It represents the historical expansion boundary where previous cycles matured and volatility peaked.
As long as the macro structure remains intact, the probability continues to favor structural continuation rather than random collapse.
Key takeaway:
Markets don’t repeat perfectly, but they rhyme .
And Bitcoin has been speaking the same structural language for over a decade.
Conclusion:
This is not about catching tops or bottoms.
It’s about understanding where you are in the cycle , and acting accordingly.
If this structural perspective helped you, like, comment, and follow for more long term market studies.
Analysis By @TraderRahulPal | More analysis & educational content on my profile.
⚠️ DISCLAIMER: This analysis is for educational purposes only and reflects a long term structural view. It is not financial advice. Always manage risk and do your own research before making trading or investment decisions.

"ETH/USDT Forecast""ETH/USDT Forecast"
The market shows evidence of strong participation earlier, where price moved with speed and consistency, reflecting clear intent. That phase established direction and control without prolonged hesitation.
As price progressed, momentum began to ease. Movement slowed, reactions became more frequent, and volatility compressed. This change indicates a shift from active pressure to evaluation, where participants reduced aggression and allowed price to stabilize.
The subsequent recovery unfolded in a measured and uneven manner. Advances were short, overlapping, and lacked continuation, suggesting limited commitment behind higher prices. Opposing flow remained active, preventing expansion.
Currently, price behavior is defined by balance and compression. Activity reflects positioning rather than resolution. Until behavior shifts from overlap to decisive movement, the market remains in a waiting state, with continuation favored once imbalance returns.

ETH UNDER PRESSURE - BREAKDOWN Ethereum slipped below the $3,000 support, following heavy selling in spot ETH ETFs. Net outflows hit $224.7M in a single day, the largest exit in weeks, extending total ETF selling to $286.5M over the past three days. Notably, BlackRock and Grayscale led the withdrawals, with zero inflows recorded across funds.
This breakdown triggered a liquidation cascade, wiping out nearly $168M in ETH long positions and driving price down toward the $2,895 zone.
📉 Technical View:
ETH remains under bearish pressure, forming a bearish flag while a confirmed death cross keeps downside risk elevated. Unless price reclaims resistance near $3,170, the structure points toward a potential move to the $2,620 support zone.
⚠️ Market Takeaway:
Momentum favors the downside for now. Bulls need a strong reclaim of key resistance to shift sentiment — otherwise, volatility remains skewed against longs.

MARAL Execution Example — WIFUSDT.P 1H (Short 0.01234 → 0.01196)MARAL Execution Example—Discretionary SHORT (Entry 0.01234 → Exit 0.01196) in Binance
This post is not about prediction. It’s about execution quality — how MARAL guides a trader before entry, during the hold phase, and into the exit decision using context + risk controls.
Trade Snapshot
Position: SHORT (manual)
Entry: 0.01234
Exit: 0.01196
Move captured: ~0.00038 (≈ 3.1%)
1) Pre-Entry: Why MARAL allowed the trade
Entry Checklist (Permission Layer)
MARAL’s checklist was green across core pillars:
HTF Alignment: OK
Structure: OK (Bear Structure)
Momentum: OK
Volatility (ATR + ADX): OK
Liquidity Confidence: WARN
Score: 93 / 65 → ENTER SHORT
Important: “Liquidity = WARN” is not a “no-trade.”
It means nearby liquidity pools exist, so the trade may include wick risk / stop-sweep behavior, and execution must be disciplined (no FOMO entries, no oversized risk).
2) Signal vs Framework: What the Master Engine confirmed
MARAL didn’t just show “short.” It confirmed the internal quality of the short context:
Last Signal: SHORT
Direction: Bearish
H1 / H4 / Daily Bias: Bearish alignment
Structure: Bear Structure
Short Score: 93 (A++)
Trend Probability: 93%
Reversal Probability: 7%
This is the key difference:
MARAL doesn’t “tell” you to trade — it grades the environment so your entry is not emotional.
3) Execution Board: What happened AFTER entry (the real value)
Post-entry, the Execution Board shifted into execution guidance:
Execution State (Holding Logic)
Trade Status: VALID
Market Phase: CONTINUATION
TP Probability: HIGH
Obstacle Ahead: NO
Exit Pressure: LOW
Momentum Health: STRONG
Score Trend: Stable / Improving
Active Window: ON
Action: HOLD
Trade Age: FRESH
This is execution intelligence:
VALID + CONTINUATION = trend conditions still supportive
Obstacle Ahead: NO = fewer immediate barriers in path
Exit Pressure: LOW = no urgent reason to panic-exit
Action: HOLD = stay in trade as long as structure remains intact
4) Risk State: Why “OVEREXTENDED” matters even in a VALID trade
MARAL showed:
Risk State: OVEREXTENDED
This does not mean reversal.
It means:
“The move is mature / extended relative to volatility. Continuation can happen, but holding requires risk-managed behavior.”
Execution behavior under OVEREXTENDED:
Don’t add to position (no stacking late)
Protect profits (tighten or trail logically)
Expect wicks/pullbacks even if trend remains bearish
Prefer partials / controlled exits near objectives
5) My exit decision (0.01196): Execution > greed
Even though MARAL was still VALID / HOLD, I chose to exit at 0.01196 to:
Lock a clean capture (~3.1%)
Respect OVEREXTENDED risk
Avoid giving back profit during possible liquidity reaction / mean-reversion
This is exactly what MARAL is designed for:
Stay in when the environment is valid — but exit like a risk manager, not like a gambler.
6) What would invalidate the HOLD (how MARAL helps you stay objective)
For me, a HOLD becomes questionable if MARAL starts flipping these:
Trade Status: VALID → RISKY/WEAK
Exit Pressure: LOW → RISING
Obstacle Ahead: NO → YES
Momentum Health: STRONG → WEAK
Score Trend: IMPROVING → DETERIORATING
Active Window: ON → OFF
That’s the execution framework in action: no emotions, only conditions.
Due to TradingView attachment limitations, the full chart is shared via the link below.

XAU/USD Outlook TodayThe latest data paints a pretty clear picture of where XAU/USD stands today, and the market tone is cautious but still bullish overall.
## 🟡 XAU/USD Outlook Today
### 1. **Price Action & Market Mood**
Gold is trading around the **$4,300** zone, with traders showing hesitation ahead of key U.S. economic data releases. This pause is driven mainly by expectations around inflation and jobs numbers, which could shift Federal Reserve rate‑cut expectations.
- Gold recently eased slightly as traders took profits and reduced exposure ahead of U.S. jobs data.
- The metal is still holding above the **50‑day moving average at $4,127**, keeping the broader uptrend intact.
### 2. **Key Levels to Watch**
- **Resistance:**
- **$4,353–$4,381** remains a strong ceiling where recent rallies have stalled.
- **Support:**
- **$4,127** (50‑day MA) is the key line that keeps the “buy‑the‑dip” bias alive.
### 3. **Macro Drivers Today**
Markets are waiting for:
- **U.S. CPI data**, expected around **3.1% headline** and **3.0% core**. This is the biggest catalyst for gold today.
- A softer CPI print could weaken the dollar and push gold higher; a hotter print could pressure gold.
### 4. **Short‑Term Forecast**
Based on current sentiment and technicals:
- **Bias:** Mildly bullish
- **Expected range:** **$4,260 – $4,350**
- **Breakout potential:** A close above **$4,353** could open the door to retesting the **$4,381** record area.
If you want, I can also give you:
- A **1‑hour intraday technical setup**
- A **swing‑trade plan**
- Or **automated chart levels** based on your trading style

HFCL BY KRS CHARTS17th September 2025 / 9:21 AM
Why HFCL?
1. First of all, its second time it's in my radar, previously we had more than 40% Return on this one and still long-term Target has been still loading 225 Rs.
2. 1M TF is making Higher High with current price level previously it breaks from flag pattern and gave upside move.
3. As we cand see in chart i have mentioned FVG range for 1M tf which was expected fall to be fill that FVG and it did.
4. Further, along with FVG filling 1W & 1D tfs is showing bullish divergence within range.
5. Volume is above avg with Morning Star Candle Breakout showing more bullish signs.
SL & Target is mentioned ‼️
** Attached Previous View on HFCL also go check it out**

ETH Possible scalping opportunity On this trend line, M15 if we see any Bullish Signal, we can cover quick upside Scalp. Keep an eye 👁

BTC Market Update – FOMC Range ModeBitcoin is stuck in FOMC limbo — no clean pump, no dump, just tight consolidation as markets wait for Powell’s cue. Volatility is coiling, and a big move is loading.
Key Levels to Watch:
Support Zone: $92K–94K (must hold for bullish continuation)
Bullish Trigger: Break & hold above $94.6K
🎯 Next upside: $100K retest
Bearish Trigger: Break below $87.7K
🎯 Downside risk: Low $80Ks before a rebound attempt
Market View:
This is a classic decision range — expect sharp expansion once direction is chosen. Stay alert around FOMC headlines; volatility can spike fast.
Bias: ⚖️ Neutral → Breakout pending
Disclaimer:
For educational purposes only. This is not financial advice. Trading in Forex, Gold, Crypto, and markets involves high risk. Do your own research and trade at your own risk.

ethereum longs activated im in long manage your riskim in eth longs from this level of entry and long targets risk your capital that ytou can lose and make profits as your levels its just a trade idea thats it

The Most Important Bitcoin Level of This Cycle — Don’t Miss It.Bitcoin is once again testing its multi-year rising support trendline, the same zone that has triggered every major rally since 2020. Price has repeatedly formed higher lows, showing that long-term buyers are still defending this structure.
What makes this zone special is the confluence:
A macro rising support trendline that has held for nearly 4 years.
A fresh institutional demand zone between 88k–92k.
Volume spike indicating renewed accumulation.
Rejection from macro rising resistance , resetting liquidity below.
This type of setup usually appears before expansion moves. As long as BTC holds above this macro support, the market continues to favor upside targets:
1st Target: 106,770 (conservative)
2nd Target: 124,250 (mid-term)
3rd Target: 135,800+ (macro breakout zone)
But here’s the key point:
A clean breakdown below the structure would delay the bullish cycle, until then, dips into the demand zone remain high-probability accumulation opportunities for long-term traders.
History rarely repeats perfectly…
but it often rhymes, and BTC is back at the same place where big moves begin.
Analysis By @TraderRahulPal | More analysis & educational content on my profile.
Disclaimer:
This analysis is for educational purposes only and is not financial advice. Markets can change quickly always manage risk, do your own research, and trade according to your plan.

BTC: Liquidity Sweep SetupBTC: Liquidity Sweep Setup
Bitcoin continues to operate inside a broad equilibrium zone after completing a prolonged downward phase earlier in the month. The decline lost momentum as price entered a high-participation area, where trading activity became increasingly balanced and rotational. Since then, the market has developed a wide consolidation band, signaling a temporary standoff between directional conviction and liquidity accumulation.
Recent sessions show price repeatedly rotating through the center of this zone, forming alternating impulses that lack continuation. This pattern reflects a market focused on collecting orders rather than trending. Each short-lived push quickly transitions back into the range, indicating absorption on both sides and limited willingness from participants to sustain directional movement.
The lower portion of the range has begun attracting more activity, suggesting interest from larger players seeking efficient fill zones before any expansion. Price behaviour here is characterized by controlled sweeps, shallow recoveries, and frequent re-tests of the mid-band — signs of liquidity harvesting rather than aggressive distribution.
Forward behaviour on the chart implies that the market may first dip into the lower liquidity pocket to finalize order collection. Once this pocket is satisfied, conditions become favourable for a transition into an expansion phase targeting the upper boundary of the current equilibrium. This type of structure is common before major repricing, as it reflects the buildup of untriggered positions awaiting execution.
Overall, Bitcoin is in a preparation phase where energy is being stored, volatility is compressing, and liquidity is reorganizing. The next significant development is likely to emerge once the market completes its sweep of inefficient areas inside the range and finds a stable base for expansion.

ETH 1H Outlook: Key Support Retest With Potential Downside RiskKey observations:
1. Support Level Under Pressure
ETH is retesting this support multiple times.
The annotation suggests: “SUPPORT IF BREAKS THEN WE CAN SEE MORE DOWNWORD” — meaning a breakdown could trigger further selling.
2. Downside Targets
If the current support fails, the next liquidity zones highlighted are:
FVG (Fair Value Gap) around $2,950–$2,900
Extreme POI zone around $2,880–$2,850
Major support at $2,787 (marked as “next support”).
3. Upside Scenario
If support holds, ETH could bounce toward:
$3,078
$3,134
High resistance around $3,225
4. Market Structure
Several CHoCH and BOS labels indicate mixed structure, showing recent weakness but with potential for rebound if buyers defend support strongly.

long ETH now buys deep buy activatedim in buys for real account deep buys for good profits yes do it now

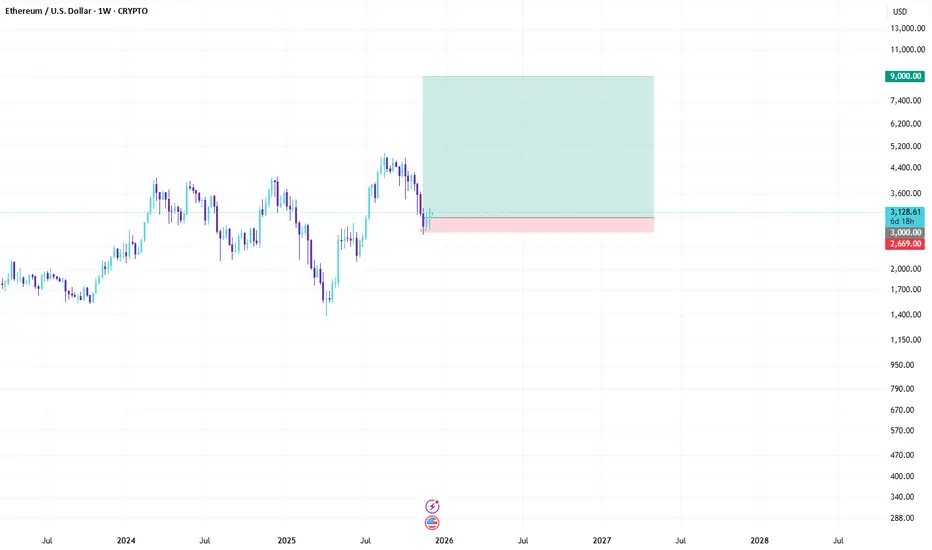
ETH Bullish Outlook: Tokenization Boom to $9K in 2026CRYPTO:ETHUSD
Asset: ETH/USD
Timeframe: Weekly
Hey traders! 🚀 Ethereum's dipping into December around $3,100 after some post-ATH consolidation, but the setup screams reversal. Fundstrat's Tom Lee is calling for a monster rally to $9,000 by 2026, fueled by tokenization exploding across finance. That's nearly 190% upside—ETH's about to steal the spotlight from BTC!
Key Analysis:
Macro Tailwinds: ETH's riding BTC's coattails but with extra juice from spot ETF inflows and real-world asset tokenization. As Wall Street piles in, expect ETH to decouple upward—watch for Nasdaq sync and weakening USD to amplify the move.
Technical Setup: Rock-solid support at $2,800, the recent higher low that's holding like a champ. Daily RSI oversold, bullish MACD crossover brewing, and on-chain metrics show whales accumulating. Smash $3,500 resistance, and we're blasting toward $4,500 next.
Risks: Near-term volatility if broader risk assets falter, but ETF demand and layer-2 scaling keep the floor intact for the long haul.
Trade Signal:
Entry: Long ETH/USD at $3,000 (confirmation above $2,800 support).
Target 1: $4,000 (short-term, ~30% gain).
Target 2: $9,000 (Tom Lee tokenization target by mid-2026).
Stop Loss: $2,700 (below key support to guard the downside).
Risk/Reward: 1:4+ on the primary target. Position size: 1-2% of portfolio.
Chart snapshot: Weekly candles forming a bullish pennant at $2,800, with Fibonacci retracement eyeing $9K extension. Overlay ETH ETF flows for that institutional vibe! (Pro tip: Compare with BTC dominance to spot ETH's breakout edge.)
Idea by Signal Squad
Published: December 8, 2025
What do you think, squad? ETH outpacing BTC in 2026, or more sideways grind? Drop your takes below—let's squad up! #ETH #CryptoSignals #SignalSquad
BTC Bullish Outlook: Riding the Wave to $170K in 2026CRYPTO:BTCUSD
Asset: BTC/USD
Timeframe: Weekly
Hey traders! 🚀 With Bitcoin kicking off December on a softer note around $85K, the market's digesting some Q4 turbulence, but we're eyeing a major reversal. Drawing from JPMorgan's fresh take, BTC could mirror gold's trajectory and surge to $170K within the next 6-12 months. That's an 84% upside from here—don't sleep on this!
Key Analysis:
Macro Tailwinds: BTC's negative correlation with the USD is flashing green as the dollar weakens. Pair that with its risk-on dance with stocks (watch Nasdaq for cues), and we're primed for a breakout.
Technical Setup: We've got support holding firm at the $80K psychological level—classic round-number magnet for BTC. RSI is oversold on the daily, MACD showing divergence, and options data screams "range-bound now, explosive later." Break above $90K, and it's game on toward the next roundie at $100K.
Risks: Short-term chop if stocks wobble further, but long-dated option builds suggest stability before the boom.
Trade Signal:
Entry: Long BTC/USD at $82,000 (confirmation above $80K support).
Target 1: $100,000 (short-term, ~20% gain).
Target 2: $170,000 (JPM moonshot by mid-2026).
Stop Loss: $75,000 (below key support to protect downside).
Risk/Reward: 1:3+ on the primary target. Position size: 1-2% of portfolio.
Chart snapshot: Imagine a weekly candlestick with a bullish engulfing at $80K, Fibonacci extensions pointing to $170K, and gold overlay for that JPM vibe. (Pro tip: Overlay GLD on your BTC chart for visual confirmation!)
Idea by Signal Squad
Published: December 8, 2025
What do you think, squad? Bullish breakout or more consolidation? Drop your thoughts below—let's discuss! #BTC #CryptoSignals #SignalSquad
