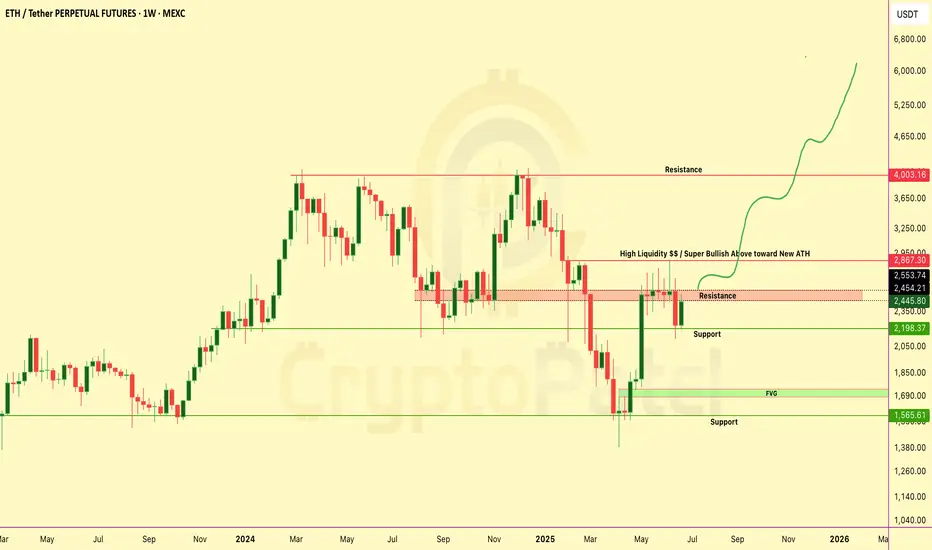
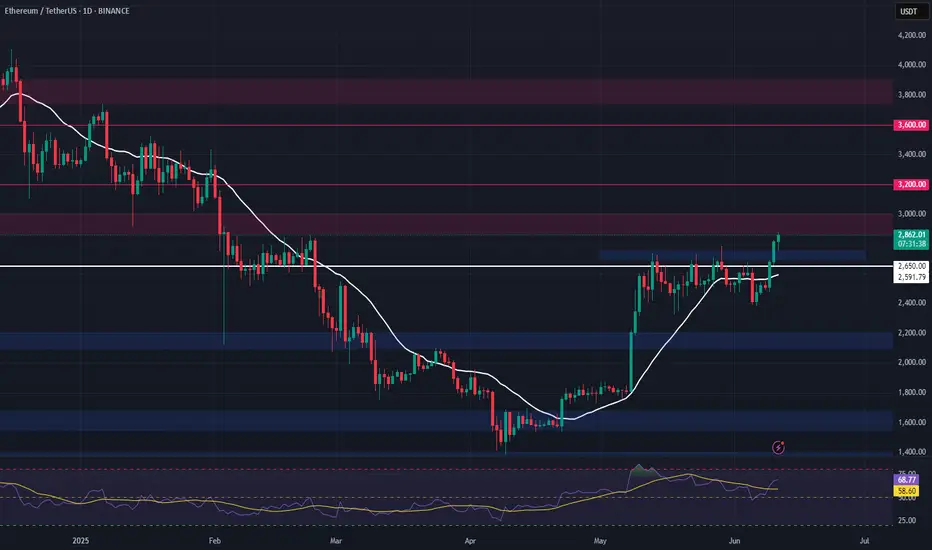
ETHEREUM Weekly Chart Breakdown – Massive Move Loading?ETHEREUM Weekly Chart Breakdown – Massive Move Loading?
ETH just pumped +9.9% this week... but it’s what comes next that really matters 👇
Key Resistance Wall → $2,867
🔹 This zone is packed with liquidity traps and past rejections.
🔹 Break this level = Unlocks ATH push toward $4K–$6K-$10k
Why This Chart Matters:
✅ Bullish structure reclaim
✅ Targeting “High Liquidity” zone above
✅ Possible parabolic rally if breakout confirms
Dips = Opportunities
If ETH dips from here... don’t panic.
→ Every dip = fresh accumulation zone
→ Below $2,000 = golden buy zone for long-term bulls
Liquidity Zone Break it = ATH rally incoming
Reject it = Buy the dip and ride the next wave
Comment & tag a friend who needs this alpha!
NFA & Dyor
D-ETH
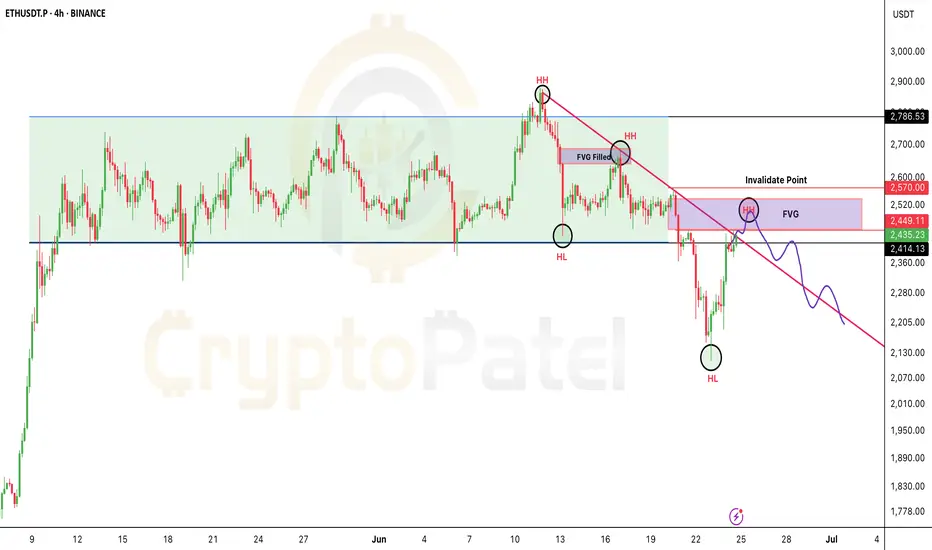
If you're shorting Ethereum, watch $2570 closely.If you're shorting Ethereum, watch $2570 closely.
If a candle closes above $2570, that invalidates the short — time to exit.
Why?
Because above this level, the risk/reward flips against you.
Better to wait for a cleaner entry with less risk, more reward.
Target: $2000
Retweet if this helps your trade plan.
NFA & DYOR
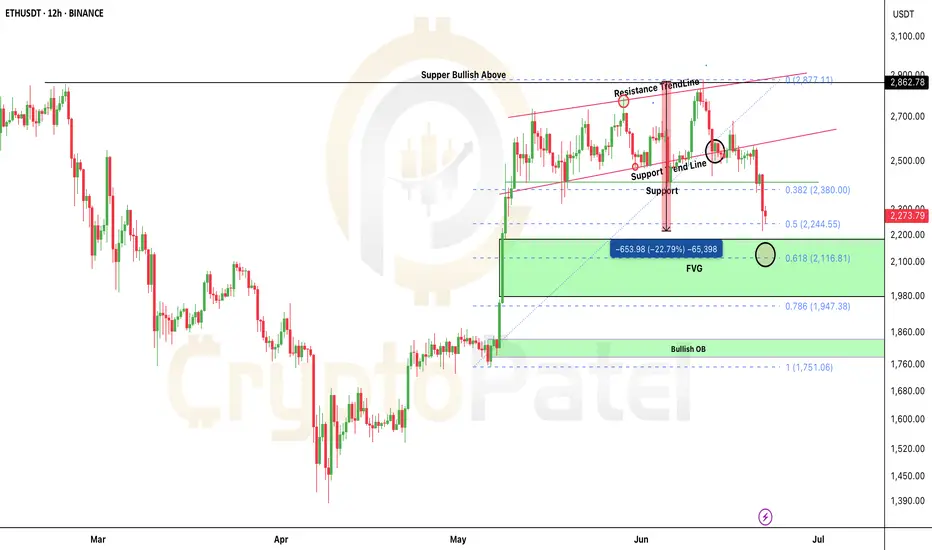
ETH/USDT Dumped hard as I predicted and next Target?ETH SHORT HIT — As Predicted!
Hey fam
Hope you enjoyed the ETH short setup I shared earlier when price was around $2700–$2800
ETH is now down 22% from that level.
Broke support just like we discussed…
And remember I said — if $2500 breaks, we could see $2200.
Well… we’re already there now ✅
What Now?
This is where we start accumulating on spot.
Why?
Because ETH is currently at the 0.5 Fib level — could hold.
If not, we target 0.618 Fib for next entry.
Best Accumulation Zone: $2200–$1800
Strong bullish OB around $1782–$1840
If price drops there, expect a solid bounce!
I’m personally watching this zone for spot entries targeting $8000–$10,000 next run 🚀
Let me know below if you're buying this dip!
And as always… stay tuned for the next sniper setup.
NFA & DYOR
BTC Traders: Crucial Levels Incoming 🚨 BTC Traders: Crucial Levels Incoming 👇
Bitcoin is hovering around $105,399 — and things are heating up.
$106K = Resistance.
A clean break could send us to the Bearish Order Block ($108K–$108.95K).
But here’s the danger zone:
🟥 OB = Last drop's origin.
Rejection here = major sell-off risk.
🔻 $102K = Liquidity pool.
Lose this level, and sub-$100K is on the table.
Current Bias:
– Hold below OB = Bearish
– Reclaim OB = Relief bounce
– Drop below $102K = Trend Accelerates Down
What’s your game plan here?
💬 Comment your next move
🔁 Retweet if useful
🔖 Bookmark for later

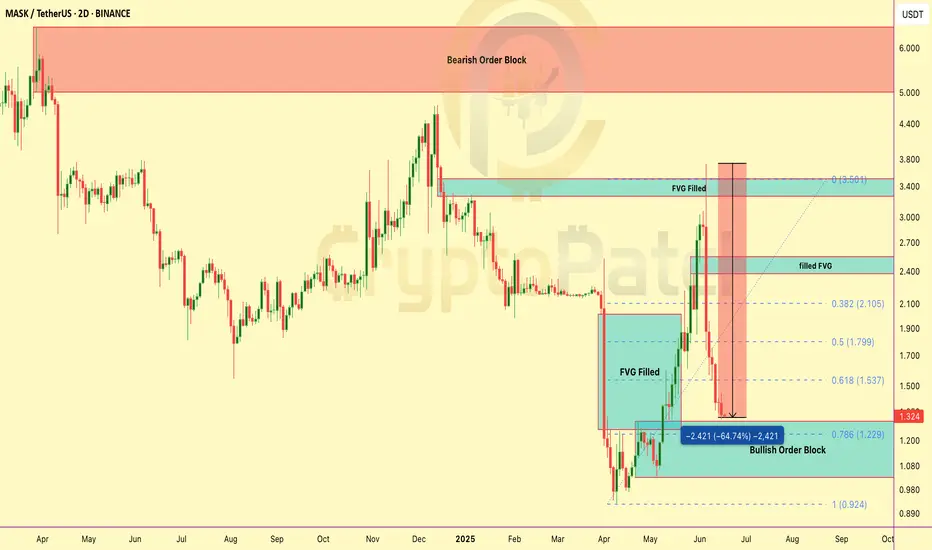
$MASK dropped 65% in 12 days — but I’m still buying, here’s why?NASDAQ:MASK Crashed 65% — I Sold at the Top, Buying at the Bottom, and Aiming for 10x
The NASDAQ:MASK token has crashed -65% in just 12 days — that’s a massive drop, and honestly, no one saw it coming. Even I didn’t expect this much of a dump.
But remember — no one can predict the market 100%.
✅ I did post a chart earlier to short NASDAQ:MASK around $3.50, and that call hit perfectly. If you took that short, it was a high-profit setup.
Now here's the important part
I mentioned earlier — if price drops below $1.50, that’s a good entry point for long-term spot buyers (NOT for leverage).
Personally, I’ve started accumulating from $1.30, and if we see a deeper dip, I’ll be buying more for the long run.
My long-term target for NASDAQ:MASK is $10+.
NFA — always DYOR
ZKJ COIN DUMPING HARD — What’s REALLY Going On?ZKJ COIN DUMPING HARD — What’s REALLY Going On?
The price of Polyhedra Network’s $ZKJ has dropped sharply — falling over -87% in just a few days. But what’s really causing this?
A big reason is the token unlock on May 19 — over 15.5 million ZKJ tokens (worth around $30 million) were released into the market. That’s a lot of new supply, and many holders started selling.
At the same time, trading volume fell by 40%+, meaning fewer buyers and more pressure on price.
In total, ZKJ is down about 95% from its all-time high — and panic selling made things worse.
But here’s something most people are missing:
The project itself is still strong.
They have partners like Google Cloud, Revolut, Bima
zkPyTorch is live
📅 Heads up: Another big unlock is coming on June 19, so stay alert!

$ETH BLOODBATH: -15% Dump! Next Stop $2100? CRYPTOCAP:ETH BLOODBATH: -15% Dump! Next Stop $2100?
I shorted right from $2862 — nailed the move.
Now trading below critical $2550 support.
👉 Hold $2550? Reversal towards $3000-$4000 possible.
👉 Lose it? We likely fill $2100-$2200 FVG — 0.618 fib at $2116.
$2860 remains THE level to watch for a New ATH.
💬 Comment your ETH target!
🔁 Retweet if this helps your gameplan.

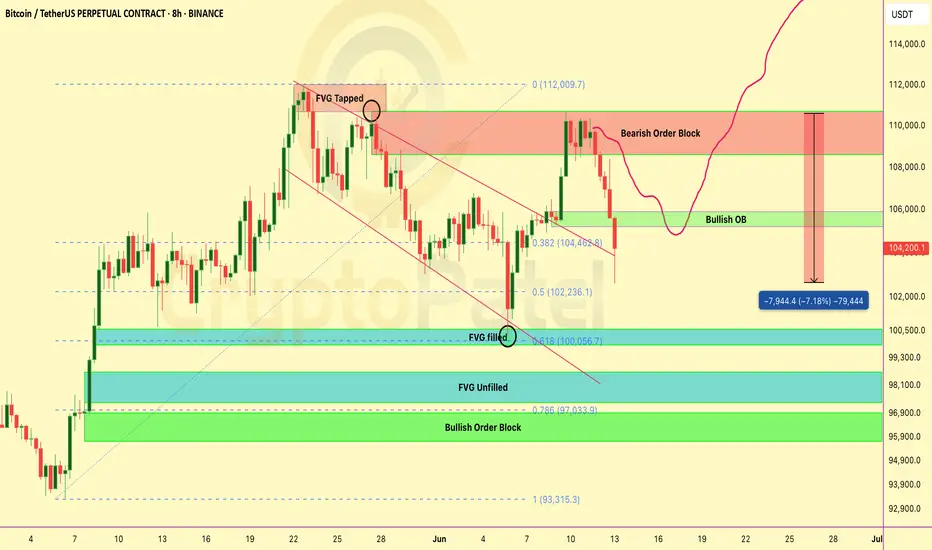
BITCOIN ANALYSIS UPDATE — READ THIS CAREFULLY!🚨 BITCOIN ANALYSIS UPDATE — READ THIS CAREFULLY! 🚨
Hope you followed our last BTC analysis — and DID NOT open any longs at the top.
If you followed: Congrats — you either made big profits on the short, or at least saved your money by not longing.
✅ We clearly warned when BTC was around $110K — more correction was coming.
Result? Bitcoin is now 7% DOWN since that call.
❗ Now the situation is DANGEROUS:
👉 BTC broke my Bullish Order Flow at $105K.
👉 If this $105K support doesn’t hold soon → we may see a deep correction towards $90K.
$105K is the level to watch like a hawk.
👉 Iran-Israel news just accelerated the fall — but we already predicted this move before the news.
🚫 NEVER gamble with your hard-earned money.
✅ Always wait for solid confirmation before entering trades.
👉 Stay smart. Stay safe. Stay patient.
💬 Comment your thoughts below.
🔁 Forward this to your crypto friends — they NEED to see this!
ETH Long Swing Setup – Breakout Retest of Key ResistanceETH has broken above the critical $2,750 resistance, signaling bullish momentum. We’re now watching for a retrace into the $2,700–$2,750 zone, which is expected to act as support for a continuation higher.
📌 Trade Setup:
• Entry Zone: $2,700 – $2,750
• Take Profit Targets:
o 🥇 $3,000
o 🥈 $3,200
o 🥉 $3,700
• Stop Loss: Daily close below $2,650
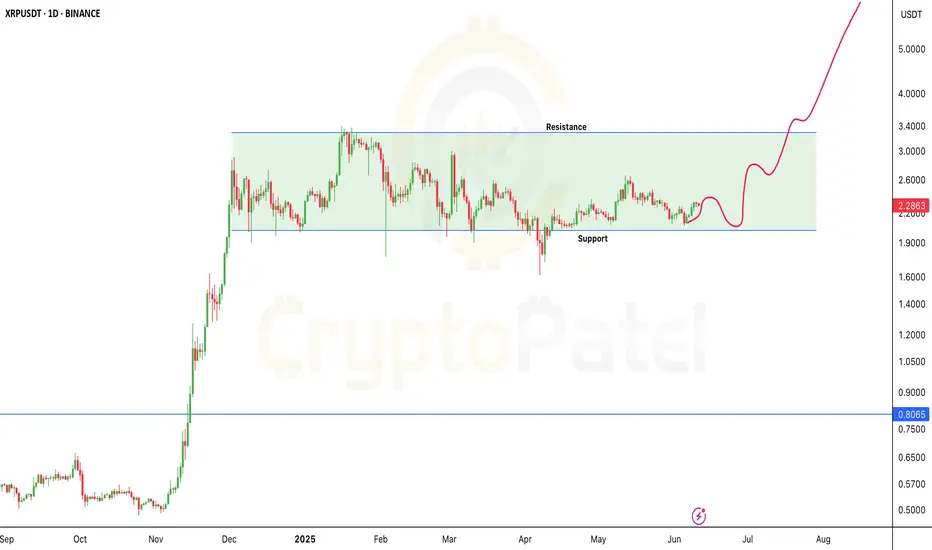
XRP Breakout Watch — Will June 16 Trigger a Bull Run?🚨 XRP Breakout Watch — Will June 16 Trigger a Bull Run? 🚨
CRYPTOCAP:XRP is holding above the key $2 support.
👉 A breakout above $2.65 → $3.00 is in play.
👉 Whale accumulation rising. Volume tightening.
👉 Ripple vs SEC ruling expected soon.
Targets if bullish: $3 → $8 → $13 🚀
Downside risk: Below $2 → $1.50 or lower.
Note: NFA & DYOR
#Ethereum Breakout Attempt #Ethereum Breakout Attempt 📢
After weeks of consolidation inside this range → CRYPTOCAP:ETH is now testing a breakout above major resistance $2750
👉 If this breakout holds → we could see a BIG upward rally toward $3500–$4000 in the coming weeks. 🚀
Keep an eye on this level — the next move could be massive.

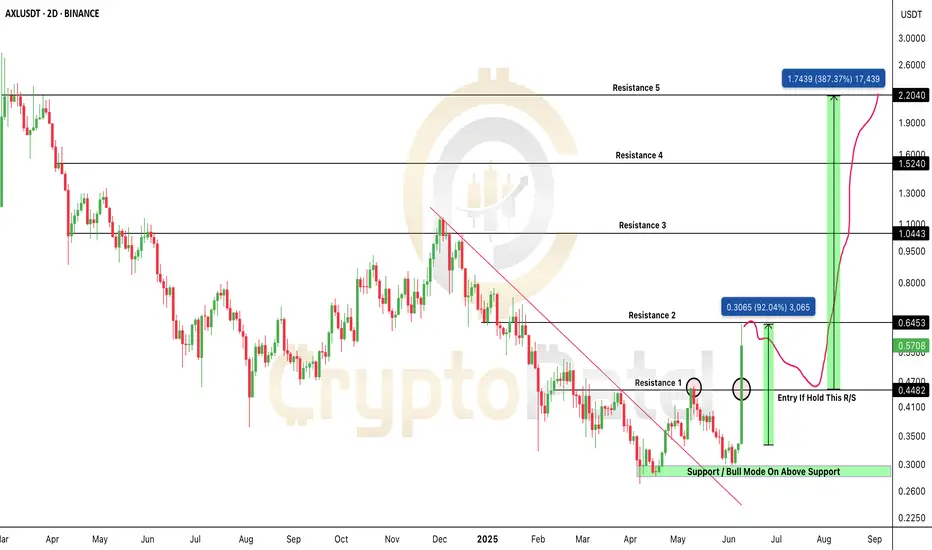
$AXL/USDT — Massive 90% Breakout, But Is It Time To Buy?$AXL/USDT — Massive 90% Breakout, But Is It Time To Buy?
NYSE:AXL has exploded +90% in just 2 days, breaking out of a long-term downtrend with huge volume.
The chart looks fire — but traders, beware:
High volatility = high risk at these levels.
Here’s the technical read:
✅ Downtrend broken
✅ $0.4482 resistance flipped → acting as strong support
✅ Structure is bullish — but a healthy correction is expected
My current view:
→ I do NOT suggest entering at this level.
→ If already holding → now is a good time to book partial profits.
👉 I expect a ~30% pullback from here.
👉 A 2-day close above $0.4482 will confirm strength and create a good accumulation zone.
👉 If not → deeper pullback toward $0.44–$0.34 zone likely.
Best Accumulation Zone:
$0.44–$0.34 — patience required — don’t chase tops.
Targets after correction: $1 → $2 → $3 → $5
Stop Loss: below $0.31
Bottom line:
The trend shift is real — but after a parabolic +90% move, entering now is chasing risk.
NFA & DYOR
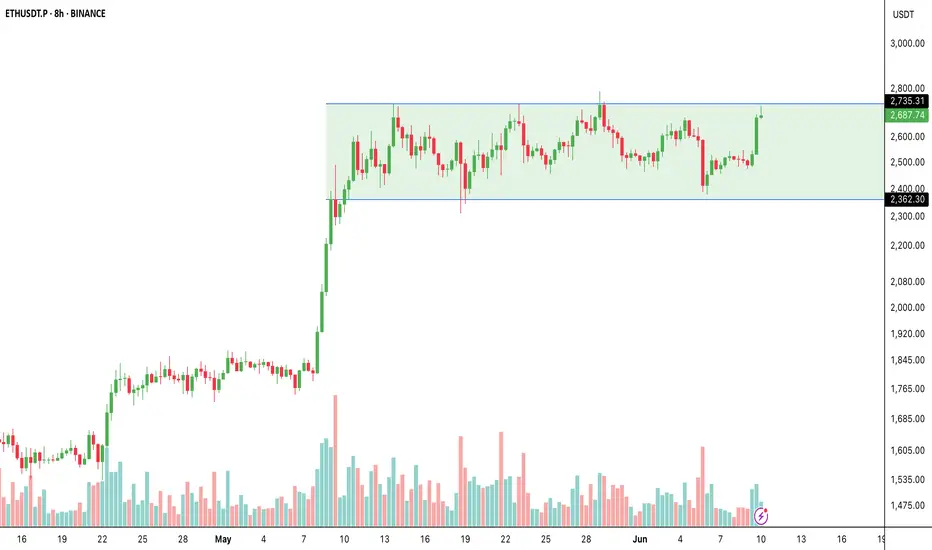
Ethereum Breakout Imminent?🚨 Ethereum Breakout Imminent?
CRYPTOCAP:ETH has been trading in a wide range:
👉 Support: ~$2,362
👉 Resistance: ~$2,735
Now ETH is once again testing this critical resistance zone with higher lows and rising volume — a classic breakout setup in play.
What to watch:
✅ Break & close above $2,735 → $2,800 → $2,900 → $3K
❌ Rejection → back to $2,400–$2,500 range.
Summary:
Ethereum is building momentum → next move could be explosive.
Will it break out or rotate? Stay sharp!
NFA & DYOR
Bitcoin is just 2% away from a new all-time high —will it break?Bitcoin is just 2% away from a new all-time high — will it break or fake? 🚀
BTC is currently trading near $109K–$110K, only 2% below the $112K ATH level.
Strong supports: $94,000 / $80,000
Bullish Case:
If BTC breaks $110K–$112K with strong volume + a bullish weekly close → we could see a rally toward: $135K → $150K
Bearish Case:
If BTC rejects at $110K–$112K, a deep retracement below $100K is possible. Watch for strong support at $100K and $80K levels.
My Personal Take:
I'm bullish overall — but since we’re this close to ATH, I’m opening a short trade with 3% stop loss targeting near $100K.
👉 Not financial advice — do your own research. The crypto market is highly volatile.
Watch this level closely — next big BTC move may be starting NOW. 👀

Why Is Hamster Kombat ($HMSTR) Dumping Hard?Why Is Hamster Kombat ($HMSTR) Dumping Hard? Here’s What’s Happening 👇
Hamster Kombat ($HMSTR) was one of the most anticipated airdrop tokens this year — but after going live, the token is now seeing a steep decline.
Here are the main reasons behind this big dump:
▶️ Massive Airdrop Sell Pressure
→ Over 131M users received free tokens
→ Many are selling immediately to lock in profits
→ Top wallets (insiders) are also unloading heavily
▶️ Weak Tokenomics
→ Circulating supply ~64B, max 100B
→ More tokens set to unlock = more selling expected
▶️ Community Frustration
→ Many users reported unfair airdrop mechanics
→ Only 88.75% unlocked at launch
→ Trust in the project took a big hit
▶️ Technical Issues
→ Telegram wallet & TON blockchain faced glitches during trading
→ Early trading experience was poor → More sell pressure
▶️ Tap-to-Earn Model Fatigue
→ The tap-to-earn hype is fading
→ Most players are cashing out, not holding or building
▶️ Bearish Chart Structure
→ Broke key support (~$0.00235)
→ No bullish signals yet — latest low ~$0.001214
Bottom line:
Right now, $HMSTR is following the typical pump & dump cycle we’ve seen with other tap-to-earn tokens. Until trust is rebuilt and real utility emerges, expect cautious trading ahead.
👉 Are you holding $HMSTR or watching from the sidelines?
#HamsterKombat #HMSTR #CryptoNews #CMC #Altcoins

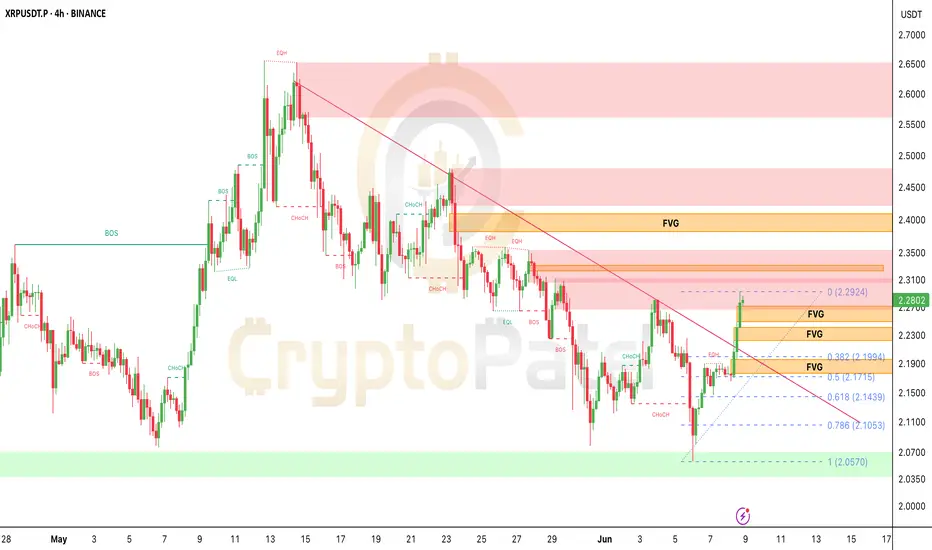
XRP/USDT 4H — Major Breakout Alert! 🔥 XRPUSDT 4H — Major Breakout Alert! 🔥
Here’s what I’m seeing right now on the XRP 4H chart:
✅ Bullish CHoCH + BOS → trendline broken → market flipped bullish.
✅ Testing $2.29 FVG → buyers pushing strong.
✅ Volume confirms true breakout.
🎯 Next upside targets → $2.36 → $2.42 (supply zone).
Best buy zone on pullback → $2.17-$2.14 (confluence of FVG + 0.618 Fib + demand).
Bias: Bullish → Only flips neutral if $2.14 breaks down.
Pro Tip: Wait for pullback if not in yet → better R:R at $2.17-$2.14 zone.
What’s your target for CRYPTOCAP:XRP this week? Comment below! 🚀
Bitcoin Bulls vs Bears — Battle Zones Mapped Out#Bitcoin Bulls vs Bears — Battle Zones Mapped Out
🔰 $105K–$106.7K = Bearish Order Block:
Below this zone = CRYPTOCAP:BTC stays bearish unless HTF closes above $106.7K
🔰 Next Moves:
▪️ Likely retest $105K–$106K before next leg ↓
▪️ Target: $97K–$95K zone
🔰 Key Levels:
✅ Holding 0.618 Fib (support)
✅ Unfilled FVG: $97K–$98.3K
✅ Bullish OBs: $95.7K–$97K | $93.5K–$94.7K
If $97,000 holds strong → Expect BIG bounce!

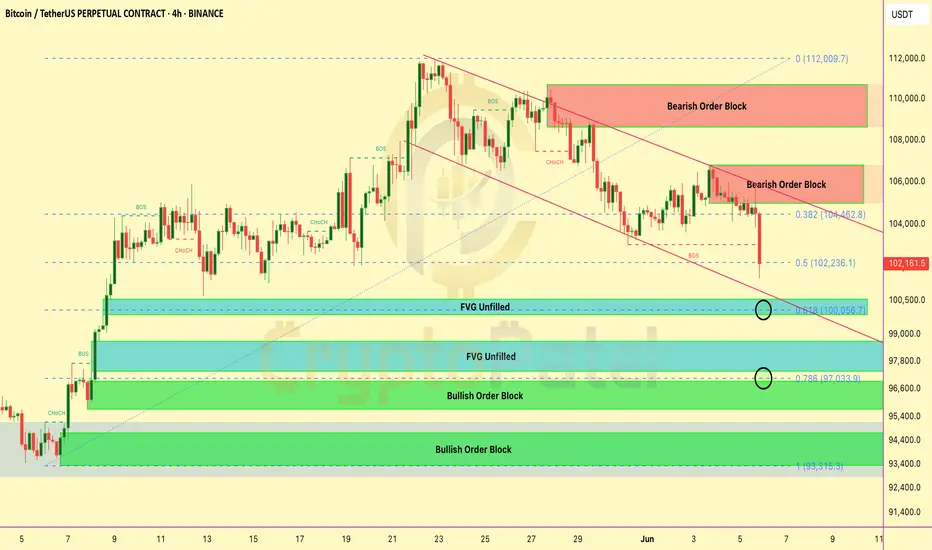
BTC Breakdown or Bounce? Key Levels You Need to Watch!BTC Breakdown or Bounce? Key Levels You Need to Watch!
#Bitcoin 4H Chart Analysis – SMC Overview:
BTC is currently in a short-term downtrend, respecting a descending channel and showing clear bearish structure.
🔴 Bearish Signs:
Price rejected from 2 major Bearish Order Blocks:
▶️ $106K–$104K
▶️ $111K–$109K
Breaks of Structure (BOS) and Change of Character (CHoCH) confirm trend shift to bearish Couldn’t hold the 0.382 Fibonacci level at $104.4K — now testing the 0.5 Fib at $102.2K
🟢 Key Support Zones (Potential Reversal Areas):
1️⃣ $100K Zone
✔️ 0.618 Fib level
✔️ Unfilled Fair Value Gap (FVG)
🔍 Possible bullish reaction from here
2️⃣ $97K Zone
✔️ 0.786 Fib
✔️ Bullish Order Block (OB)
✔️ Another FVG
💥 Strong confluence — good probability of reversal
3️⃣ $93K Zone
✔️ Deep Bullish OB
🛡️ Last strong support if $97K fails
🔼 If bulls reclaim control: We need a clear CHoCH above $104.5K to confirm bullish shift
⚠️ Tip: Mark these zones. Use alerts. Let the price come to you — don’t force trades.
📢 Share if useful & stay updated
BITCOIN WARNING – $104K IS KEY🚨 BITCOIN WARNING – $104K IS KEY
#Bitcoin is showing signs of weakness on the 4H chart! Let’s break it down:
🔻 Trend Shift Detected:
Recent CHoCH and BOS suggest the uptrend is over. Market structure has turned bearish.
Key Levels to Watch:
▪️ Support at $104K is being tested again. If it breaks, we may see a drop.
▪️ Next major targets:
➤ $100.5K (Unfilled Fair Value Gap)
➤ $98K – Strong demand zone
➤ $96.6K – Bullish Order Block + FVG confluence
Why It Matters:
▪️ Price rejected hard from the $107K zone (supply + FVG)
▪️ Liquidity was grabbed from Equal Highs
▪️ Now it’s hunting lower liquidity near $100K
⚠️ If $104K fails, get ready for a quick drop to $100.5K or even $96.6K
Plan: Short-term bearish unless BTC breaks back above $106K with volume.
Stay alert — volatility incoming!

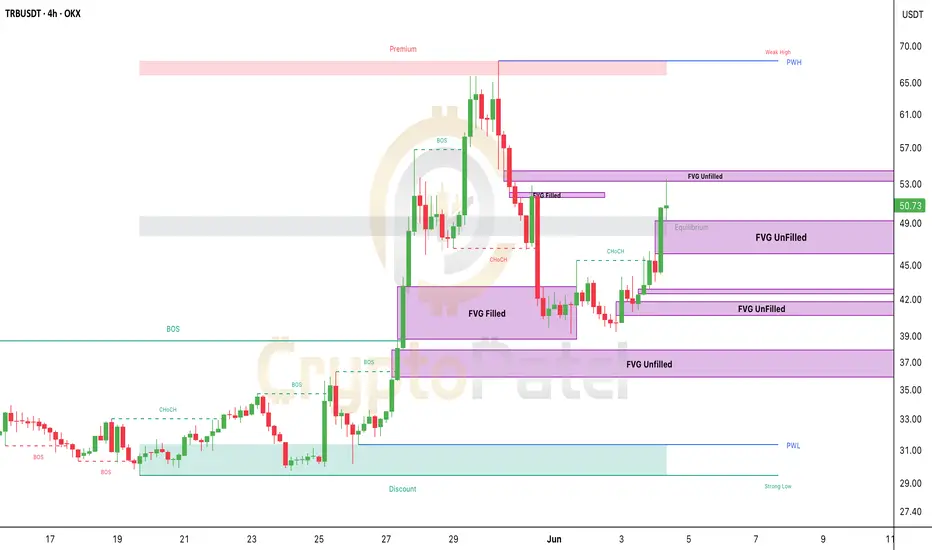
TRBUSDT SMC Chart Analysis – 4H Timeframe🚨 TRBUSDT SMC Chart Analysis – 4H Timeframe 🚨
What’s Happening?
TRB is moving in a well-defined bullish structure — with multiple Breaks of Structure (BOS) and a confirmed Change of Character (CHoCH) from the lows.
Smart Money appears to be in control — hunting liquidity and filling key imbalances.
🟪 4 Unfilled Fair Value Gaps (FVGs) on the Chart:
1️⃣ $52.5 – $53.0 → Being filled now — breakout or rejection zone
2️⃣ $45.0 – $49.0 → Major demand zone — perfect for re-entries
3️⃣ $39.5 – $42.0 → If deeper retrace comes, expect reaction here
4️⃣ $36.5 – $37.8 → Extreme demand zone — last line before structure shifts
Equilibrium Zone: ~$48.50
This is the midpoint of the move. If price retests and holds → bullish continuation likely
Upside Targets:
🔼 $56 → First resistance
🔼 $69–$70 → Weak High / Liquidity Target
🔼 Above $70 → Premium Price Zone for profit-taking
Downside Risk?
If price breaks below $45 structure, expect a pullback to $42 or even $37 FVGs.
Smart Money Play:
Smart entries are near FVGs.
Exit targets near liquidity highs.
Bias = Bullish unless structure breaks down.
If TRB holds $48–49, expect a breakout toward $70.
Drop your trade plan below! 👇
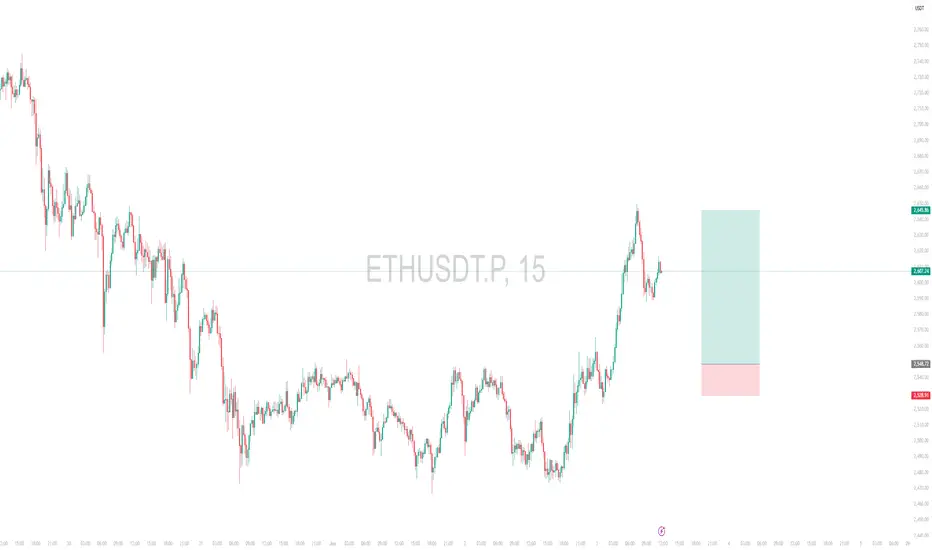
Intraday Long Setup | June 3rd 2025 | Valid Until Daily ClosePrice is retracing to a strong pivot zone (marked by the red box).
Structure remains bullish with potential for continuation after pullback.
The green box represents a high-probability long opportunity with tight risk control.
Watch for price reaction within the red zone. Entry only if confirmation (e.g., bullish engulfing, strong wick rejections) appears.
The setup expires at end of the daily candle close.
WIF Just Flipped Bullish — Is This the Start of the Next Big AltWIF Just Flipped Bullish — Is This the Start of the Next Big Alt Rally?
WIF just bounced hard from the $0.80 demand zone and flipped structure bullish with a clear CHoCH!
Smart Money is back — and they’ve left their footprint.
Here’s What’s Cooking:
🔹 CHoCH Confirmed ✅
🔹 Bullish OB at $0.93–$0.96 respected ✅
🔹 Price aiming for $1.13–$1.42 — major liquidity zones
🔹 This isn’t random. It’s Smart Money accumulation, and the next leg up could be explosive.
⚠️ Don’t chase. Wait for confirmation around $1.13 zone and plan accordingly.
Breakout = 🚀
Rejection = Watch for retest.
High-Probability Play
This chart is loaded with confluences. If you're sleeping on it… you might miss one of the cleanest moves of the week.
📢 ACTION TIME:
✅ Save the chart
✅ Share with your crew
✅ Stay updated — we’re tracking this live
Comment “WIF🔥” if you're watching this move!

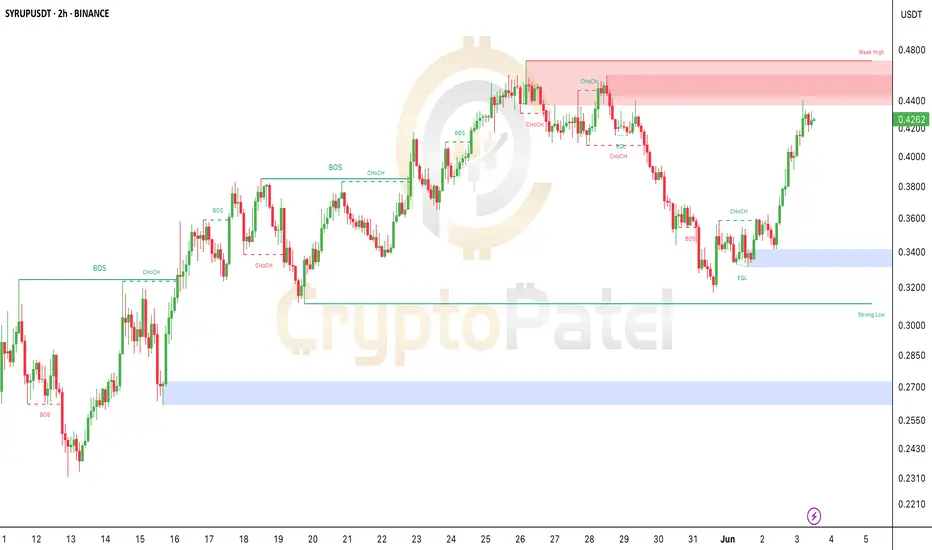
SYRUP/USDT About to Explode? Here’s What Smart Money is Doing!SYRUP/USDT About to Explode? Here’s What Smart Money is Doing!
After weeks of sideways action, SYRUP just flipped bullish from a strong demand zone near $0.34.
It broke structure, reclaimed key levels, and is now eyeing the $0.44–$0.46 weak high zone!
This move looks like a classic Smart Money re-accumulation setup — and it’s gaining momentum fast!
Key Signals:
✅ Strong CHoCH + BOS combo
✅ Equal lows protected (liquidity trap avoided)
✅ Massive green candles + volume spike
✅ Next resistance: $0.46 — if broken, clean sky above!
Watch Closely:
If price reclaims $0.4450 with volume, we might see a breakout rally!
Short-Term Target: $0.46+
Strong Support: $0.38 and $0.34 zones
Don’t sleep on this move! Track, set alerts, and trade smart.
Your edge is in the knowledge — not the hype.
NFA & DYOR