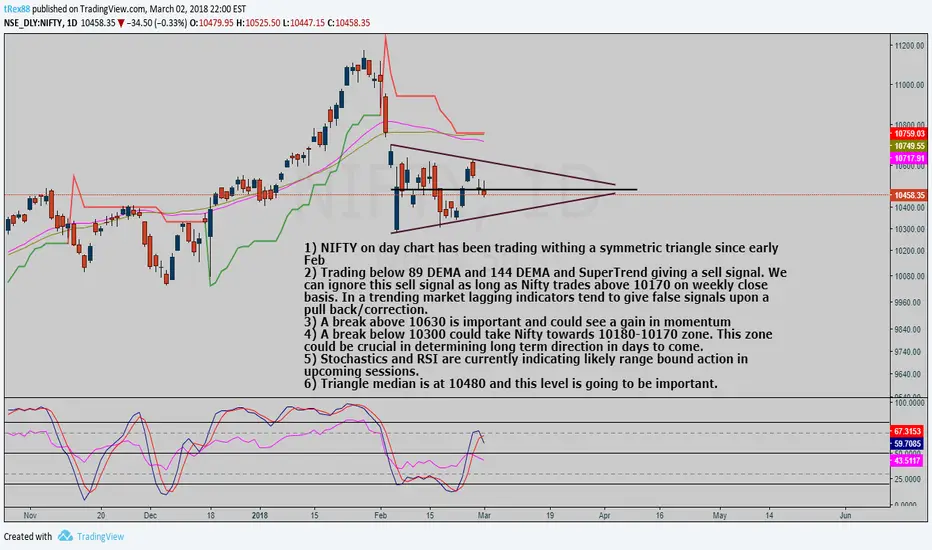
Nifty day chart analysis1) NIFTY on day chart has been trading withing a symmetric triangle since early Feb
2) Trading below 89 DEMA and 144 DEMA and SuperTrend giving a sell signal. We can ignore this sell signal as long as Nifty trades above 10170 on weekly close basis. In a trending market lagging indicators tend to give false signals upon a pull back/correction.
3) A break above 10630 is important and could see a gain in momentum
4) A break below 10300 could take Nifty towards 10180-10170 zone. This zone could be crucial in determining long term direction in days to come.
5) Stochastics and RSI are currently indicating likely range bound action in upcoming sessions.
6) Triangle median is at 10480 and this level is going to be important.