XAUUSD – Historic Volatility Doji at 1.618 | Exhaustion SignalXAUUSD – HTF Exhaustion at 1.618 | Major Volatility Signal Formed
GOLD HAS PRINTED ITS BIGGEST DOJI IN ENTIRE HISTORY OF DAY CANDLE NEARLY 490$ FROM LOW TO HIGH AND ENDED WITH INDECISION. LETS SEE WHAT HAPPENS NEXT . WAIT FOR LOW AND HIGH OF DOJI.......?
Gold has reacted precisely from the 1.618 Fibonacci extension zone (~5600), where price printed a high at 5597.04 and faced strong rejection.
The current Daily candle is forming an exceptionally large indecision candle (Doji-like structure) after a strong impulsive move.
With an intraday range of nearly 490$, this candle highlights clear exhaustion and aggressive profit-taking at premium prices.
Technical Perspective
Clear rejection from the 1.618 extension resistance
Strong volatility spike following a vertical price expansion
Daily candle structure suggests weakening bullish momentum
Key HTF Levels to Watch
Resistance / Supply: 5580 – 5615
Immediate Reaction Zone: 5350 – 5400
Major Support / Rebalancing Area: 5000 – 4900
HTF Value Area Low: Below 4900 (only if bearish momentum accelerates)
Expectation (Next Sessions / 1–2 Weeks)
As long as price remains below the 1.618 rejection zone, probability favors:
Consolidation or corrective price action
Gradual rotation toward 5000–4900 HTF demand
No immediate V-shaped recovery unless strong acceptance above 5600 is seen
Doji

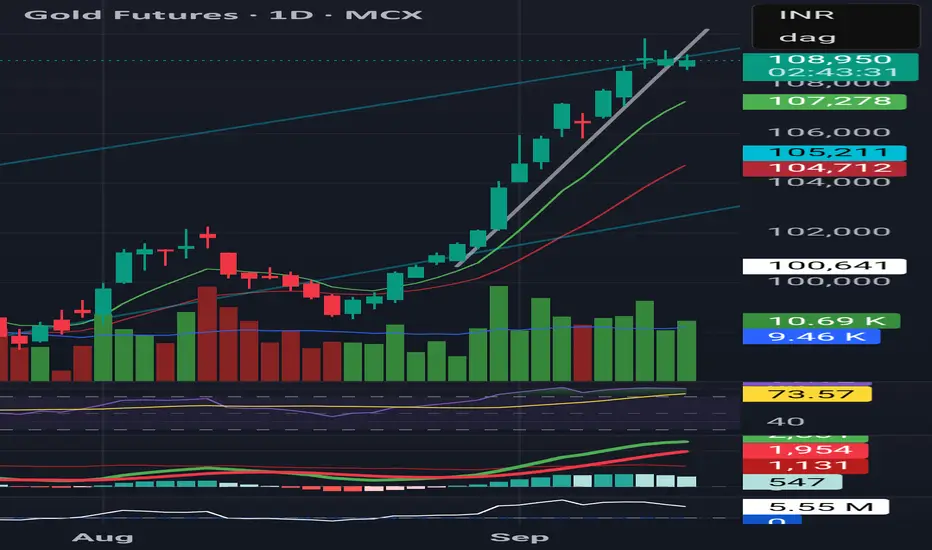
Technical View – Gold Futures (MCX)Trend: Sharp rally extended, but now showing pause with doji candles at the top.
Volume: Trendline breakout earlier came with strong participation; latest candles show reduced conviction.
Momentum: RSI near 74 → overbought, but stabilizing. MACD still positive, histogram flattening → signs of momentum cooling.
Support Levels: ₹107,250 (short-term EMA), ₹105,200 (swing support).
Bias: Rally intact, but risk of sideways/consolidation phase unless fresh volume confirms continuation.
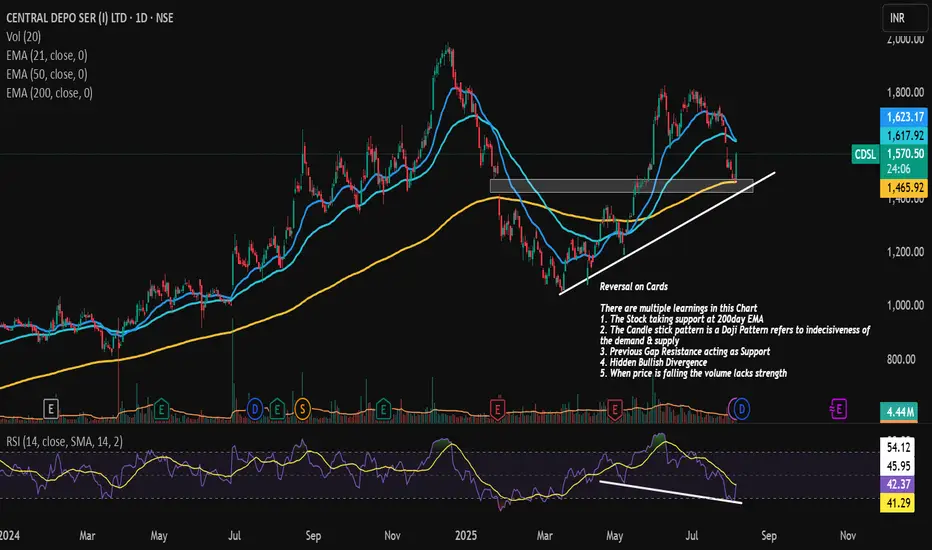
CDSL Reversal !!!CDSL is on the verge or Reversal or Temporary Pull back
There are multiple learnings in this Chart
1. The Stock taking support at 200day EMA
2. The Candle stick pattern is a Doji Pattern refers to indecisiveness of the demand & supply
3. Previous Gap Resistance acting as Support
4. Hidden Bullish Divergence
5. When price is falling the volume lacks strength
RELIANCE Levels // 4 HOURHello Everyone 👋
Employee Stock Option Plans (ESOPs): Ahead of its anticipated initial public offering (IPO), Reliance Retail granted ESOPs worth ₹351 crore to 15 senior executives during the last financial year. The company issued 4.417 million shares at ₹796.5 per share to top-level employees, demonstrating its commitment to retaining and rewarding key leadership.
Reliance Retail, owned by Mukesh Ambani, is India’s largest retailer, serving 304 million registered customers and welcoming over 1.06 billion footfalls across its stores in the financial year 2023-24. Its diverse portfolio spans grocery, consumer electronics, fashion, lifestyle, and pharmaceuticals. Notable brands under Reliance Retail include Smart Bazaar, 7-Eleven, Fresh Signature, Freshpik, Netmeds (pharma), Tira (beauty), Reliance Digital, MyJio Store (electronics), and retail chains like Trends, Reliance Jewels, and Hamleys.

ICICIBANK Levels For Intraday or swing TradingChart Overview:
Current Price: ₹1,226.351.
Recent Performance:
1 day: +1.08%
5 days: +4.19%
1 month: +3.05%
6 months: +17.57%
Year to date: +23.68%
1 year: +26.43%
5 years: +199.18%
Support and Resistance Levels:
Pivot Points:
Resistance 1 (R1): ₹1,245.82
Resistance 2 (R2): ₹1,259.55
Resistance 3 (R3): ₹1,273.28
Pivot Point: ₹1,234.98
Support 1 (S1): ₹1,221.25
Support 2 (S2): ₹1,207.52
Support 3 (S3): ₹1,193.79

SENSEX Levels For Intraday or swing TradingSupport & Resistance Levels:
Buy Above: 81,100 (SENSEX Spot Levels)
Targets: 81,225, 81,343, and 81,5551.
Sell Below: 81,000 (SENSEX Spot Levels)
Targets: 80,900, 80,729, and 80,5551.
Recent Analysis (August 22, 2024):
Sensex made an all-time high at 82,129.49 on August 1, 2024, at the open of the day.
It corrected one cycle down near the level of 77,968 and found support near the lowest vibration above the cycle level (actual low: 78,295.86).
The fall was swift and completed within 16 bars.

Granules Technical Outlook - 23 MayToday we have a indecisive candle (doji). A Doji above the upper edge of a triangular pattern indicates the weakness in the uptrend. The price could test the support level of 415. If tomorrow we get a red candle then a shooting star pattern will be formed. So, I am waiting for a trend to start.
Disclaimer: This is my pre market analysis and my trading journal. Not a suggestion to buy or sell.

Breakout in GRASIMAfter a long consolidation, stock has given breakout from its Rising channel pattern and has given confirmation for breakout by a Doji and Marubozu. From the past 3 days, buying volume has been increasing consistently. Stock is trading above all its EMA.

NIFTY DAILY - 2/4/2024Nifty open flat and made days high 22497 level buy didn’t sustain that level.
Index has formed another Doji candle on the daily chart at the top of the market which indicates thug of war between buyers and sellers as today’s closing was near the opening levels.
So, further levels for nifty will be 22336 will work as support level and 22520 will work as resistance level.
Today’s Advance Decline ratio of NIFTY50
Advance - 28
Decline - 22
FII Sell – 1622.69 crore
DII Buy + 1952.72 crore.
⚠️ Important: Always maintain your Risk & Reward Ratio.
✅Like and follow to never miss a new idea!✅
Disclaimer: I am not SEBI Registered Advisor. My posts are purely for training and educational purposes.
Eat🍜 Sleep😴 TradingView📈 Repeat 🔁
Happy New Financial Year 🚀
Happy learning with trading. Cheers!🥂

NIFTY DAILY - 5/3/2024Nifty open with negative note and rangebound throughout the day.
Nifty has formed another Doji candle on daily chart, which indicate indecisiveness among bulls and bears.
Index find immediate support at 22303 level and resistance will be 22520 level.
This suggests caution and the need for careful decision-making in the current market environment.
⚠️ Important: Always maintain your Risk & Reward Ratio.
✅Like and follow to never miss a new idea!✅
Disclaimer: I am not SEBI Registered Advisor. My posts are purely for training and educational purposes.
Eat🍜 Sleep😴 TradingView📈 Repeat 🔁
Happy learning with trading. Cheers!🥂

NIFTY DAILY - 4/3/2024Index open with positive note and made all time high that is 22440.
Index has formed Doji candle on the daily chart at the top of the market which indicates thug of war between buyers and sellers as the closing was near the opening levels.
We may see trend reversal in near future.
Next levels for nifty will be 22520 upsides and 22303 level downsides.
⚠️ Important: Always maintain your Risk & Reward Ratio.
✅Like and follow to never miss a new idea!✅
Disclaimer: I am not SEBI Registered Advisor. My posts are purely for training and educational purposes.
Eat🍜 Sleep😴 TradingView📈 Repeat 🔁
Happy learning with trading. Cheers!🥂

Astral ready to rock n rollInside candle bar trade + Triangle breakout + Weekly Bullish candle
Small trade:
Entry: 1968.80
Target: 2073.40
SL: 1948.50
(Time: 1-2 Week)
Big target: 1968.80
Target: 2290
SL: 1808.50
(1 month)
View for educational purposes

Railtel LongAfter given upside rally, stock price is taking rest.
Daily Time Frame
As shown in chart, price took support and making a upside reversal pattern.
for study purpose only.

JSW ENERGY - Getting Tight #Insidebar #dojiJSW Energy after a good consolidation is now getting ready for another upmove, formation of tight dojis and Inside bar, also today's last 10min closing suggests there would be a sudden spurt in this scrip. Ripe for swing trade. Ideal Stoploss would be 378.
*DISCLAIMER*
This analysis is only for educational purpose. I am not a SEBI Registered Analyst/Advisor. Please consult your financial advisor before taking any position and please use a Stop Loss for any Investments/Trading Positions. It is your hard earned money so give risk management your highest attention. Do take this disclaimer seriously.

#GROBTEA Cha Da Time Lagda Grob Tea looks good as Positional Trade. After a long consolidation, stock is trading in a Inside Bar candle range of 978-825 for almost 4 months now, also smart money are leaving their footprints (check the volume bars). Expecting good move to come soon now.
Stoploss - (low risk)828, (high risk)780
*DISCLAIMER*
This analysis is only for educational purpose. I am not a SEBI Registered Analyst/Advisor. Please consult your financial advisor before taking any position and please use a Stop Loss for any Investments/Trading Positions. It is your hard earned money so give risk management your highest attention. Do take this disclaimer seriously.

Poddar Pigments forming a 3 week tight doji patternPoddar Pigments after a good time correction is going into bullish zone again, the formation of 3 week tight doji pattern near the trend line breakout zone is a good sign of demand this scrip is getting. Looks like this pigments scrip will be giving a breakout soon. Stop loss should be placed @ 290 here.
*DISCLAIMER*
This analysis is only for educational purpose. I am not a SEBI Registered Analyst/Advisor. Please consult your financial advisor before taking any position and please use a Stop Loss for any Investments/Trading Positions. It is your hard earned money so give risk management your highest attention. Do take this disclaimer seriously.

SBI LIFE INSURANCE Wedge Pattern Could Lead Significant MoveHowdy Traders,
I feel that the market may give a little negative I because the doji candlestick pattern is seen at the higher highs followed immediately by a black candlestick, indicating that the market may provide a little negative move.
Note = If the market stays below the level of 1249 then Target- 1231.90

BATA IND ready for bounceBuy BATA INDIA 1430, for 1480/1500/1530. Bata india formed dragonfly doji on weekly charts and bounced from there. MACD showing fantastic bullish divergence which is apparently for stock to go for bounce back trade. Invalid below 1380 on closing basis


MAITHAN ALLOYS MAITHAN ALLOYS BREAKOUT RETRACEMENT DOJI FORMATION TRADE VALID FOR ONE DAY IT IT CROSSES DOJI HIGH THEN BUY WITH 1:2 TARGET,as it has given breakout and formed doji on retracement

EXIDE BUY ABOVE 186.55EXIDE INDUSTRIES breakout + support + doji formation buy above high of last candle186.55

HEG LTD SELLOFFHEG LTD SELL ON DOJI LOW BREAK,as it has high volume +doji form on top with 1:2 minimum

BALRAMPURCHINI BREAKOUT RETRACEMENTBALRAMPUR CHINI BUY ABOVE HIGH OF DOJI FORMED TODAY,As it is breakout + support+retracement doji on support buy with minimum 1:2 take profit
