Lead FUTURES MCX Jan 2026Lead FUTURES MCX Jan 2026
Chart is Labelled as per my understanding of Wyckoff Schematics
Economic Cycles

$AG setting up for a rip your face off rally #tothemoonFirst Majestic is a hated stock as of now, it also has the largest short position in the entire silver miners listed in NYSE. Bad sentiments and frustrated investors is a great combination to identify when a sector bottoms.
Looking at the price action as of now, especially from $4.5 to $7.8 it looks like a strong bullish reversal. Also this is a institution move, smart money is buying silently. Also with silver heading to new highs, which means that silver miners are turning healthy. Many silver miners are making decent margins already around 15-20% OPM, the higher silver prices go the more Free Cash Flow will be generated which will directly impact bottom line. And, the valuations are dirt cheap.
Reasons why like like First Majestic :
- Acquired Gatos Silver recently, by this deal the net AISC improves, i feel it should be around $20-18. Before acquisition NYSE:AG AISC was $25, Gatos Silver being a low cost producer should now cumulatively bring the AISC down.
- They also announced a share repurchase program which is a positive.
- They are the only silver miner with a Mint capacity, First Mint Store. Unlike other mints, which are either government-owned or privately held. Good addition to capture the entire value chain.
Well at current valuation and where the silver price is at its hard for me to see the downside. So i may be biased. I will only exit this scrip if i see Silver go below $23. That is my exit criteria.
Disclaimer : This analysis is purely for education. As i am invested in this scrip I may be biased. Don't take this as an investment advice. Please consult your financial advisor before any speculative investments.

When Fear Peaks, Emotion Speaks – Market Mood Index at an ExtremToday, the market entered a rare emotional extreme.
The Market Mood Index (MMI) dropped to 10, a level that reflects deep fear and emotional exhaustion. Readings like this don’t come from logic or long-term conviction — they emerge from panic, uncertainty, and forced selling.
Such moments are uncommon and often represent sentiment capitulation, where emotion dominates decision-making and clarity temporarily disappears.
This is not a prediction and not a buy or sell call.
It’s a reminder that markets are driven by human behavior first and analysis later.
Awareness matters most when emotions run highest.

#BTC.P Up for next super cycle?
BTC is in a corrective downtrend within a defined channel and is currently reacting from a higher-timeframe demand zone. The setup anticipates a potential trend reversal contingent on a confirmed breakout and acceptance above the descending trendline and mid-range resistance. Upside expansion is expected only after structure flip and consolidation; failure to hold demand invalidates the bullish bias. This is a conditional re-accumulation setup, not a blind bottom call.

If you ignore this than it's your choice INDEX:BTCUSD
I am also shocked
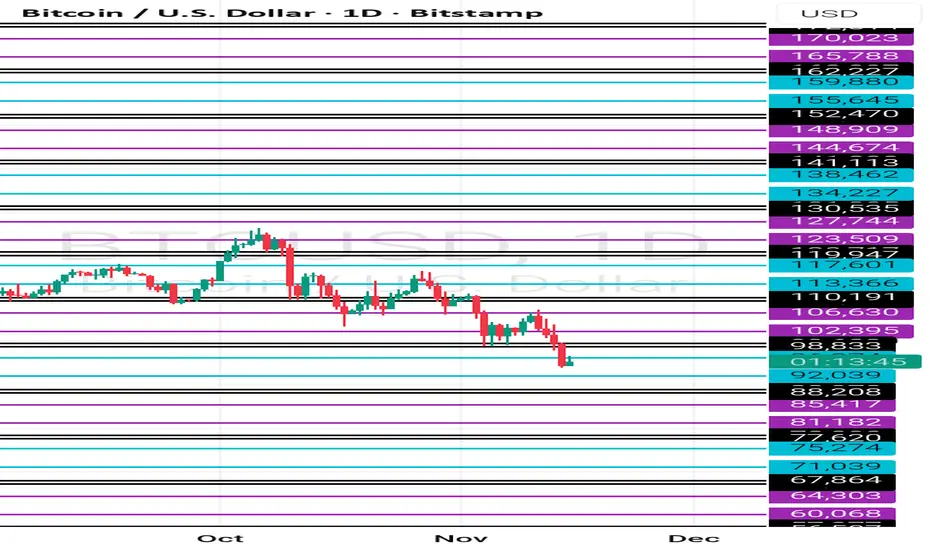
every November closed in green in Year on year based than november near to end then it means v shape bounce is ready to in 6 days
please do your own research before taking any trade.
i am not financial advisor
risk is real stay practical
please feel free to ask any questions

Btc weekly cycle study How to study this range find starting point range pink line to pinnk line starting point blue line to beetwin range
BTC 3rd cycle weekly range complete Btc 3rd cycle weekly base complete
Possible bounce back to 104444
Avoid short today wait for bullish side for Long thanks 👍
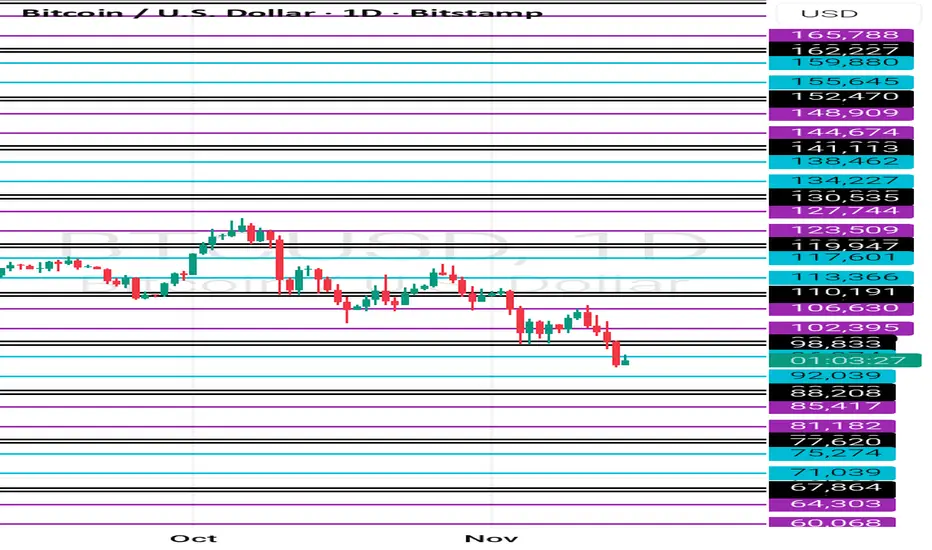
CRYPTO WEEKLY OUTLOOK 10/11/25 - 17/11/25Wassup Lads! So crypto is clearly in a downtrend as of now targeting pending daily sell side liquidity but it's also in a monthly key level that is a fair value gap, so what I am expecting price to do now is take out the pending lows on the daily timeframe on BTCUSDT and inverse the daily fair value gap, this would also cause an SMT Divergence with ETHUSDT signalling a shift in orderflow. So right now it's headed lower.
This is my plan,
1. Sell to the lows
2. Wait for an inversion of the daily bearish fair value gap on BTCUSDT, to confirm a reversal for buys.
Remember to -
1. Manage Risk
2. Do your own research
3. Stay Disciplined

My Journal - 08/11/2025 - BTCUSDT Scalp Idea Price has tapped into H4 FVG and has formed a bullish SMT with ETH, a 1 to 2 RR Trade. Do your own research.

FIL 4H Technical Analysis — Cycle & Key Levels Overview📊 Cycle Structure:
HWC (Higher Wave Cycle): Bullish 🔽
MWC (Middle Wave Cycle): Range 🔁
LWC (Lower Wave Cycle): Bearish 🔼
📌 Market Context & Structure:🔽
FIL is moving within a box-like consolidation after a recent upward move.
Volume shows slight weakening, suggesting potential for a controlled breakout.
Key resistance is around 0.0245–0.0250, previously tested 3 times.
A trendline on the 4H chart has had 4 touches; the 3rd touch aligns with this resistance, reinforcing its significance.
🎯 Trade Considerations:
Long Opportunity: Breakout above 0.0250 could provide a solid long entry if confirmed with volume.
Short / Pullback: If price fails at the trendline or resistance, short-term pullbacks are possible. Keep stops tight due to LWC bearish pressure.
The current box could act as an accumulation zone; watching for a confirmed breakout is key.
📌 If you want a specific coin analyzed, drop a comment and I’ll do it for you.
⚠️ Without proper risk management, you're just a ticking time bomb.
— PXA

ADA 1H Technical Snapshot — Short Bias via Cycles, Long Opportun📊 Cycle Structure:
HWC (Higher Wave Cycle): Bearish 🔽
MWC (Middle Wave Cycle): Range 🔁
LWC (Lower Wave Cycle): Bullish 🔼
📌 Overall View: The cycles suggest a short bias, but we take direction from BTC and BTC.D, which opens a potential short-term long opportunity.
📐 Market Context:
BTC is in a strong support zone and BTC.D is currently bearish.
ADA is at the third touch of its trendline and resistance at 0.6844 (which has seen 3 previous touches).
This resistance may react, providing a good entry for a short-term long.
🎯 Trade Plan (Short-term Long):
Long position is taken and will be held until price reacts to the resistance.
Given BTC.D’s status, this is more favorable for altcoins.
Stop-loss and risk management must be applied to control the position in case of a weak reaction or breakout.
📌 If you want a specific coin analyzed, drop a comment and I’ll do it for you.
⚠️ Without proper risk management, you're just a ticking time bomb.
— PXA | Cycle & Structure-Based Trading

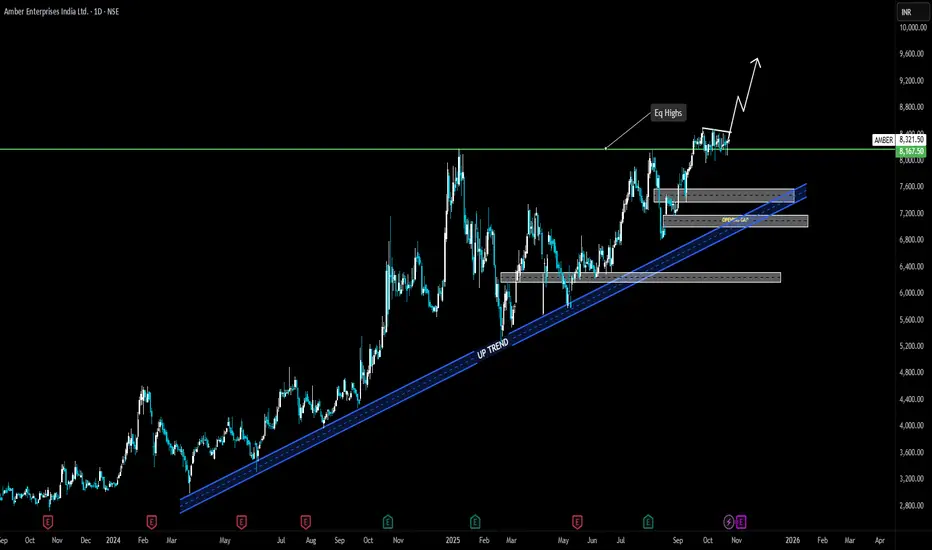
AMBER ENTERPRISESTrend:
The stock is maintaining a strong uptrend, respecting a well-defined ascending trendline that has been acting as dynamic support since early 2024. Higher highs and higher lows confirm bullish market structure.
Support Zones:
Primary demand zone near ₹7,400–₹7,600 aligns with the uptrend line.
Secondary demand zone around ₹6,800–₹7,000, near an open gap, offering strong positional support.
Resistance / Breakout Level:
The price is currently testing the ₹8,150–₹8,200 resistance zone, which aligns with previous equal highs (Eq Highs).
A confirmed breakout above this zone could trigger strong bullish momentum.
Price Action Setup:
The chart shows a tight consolidation just below resistance, indicating accumulation before breakout. If price closes decisively above ₹8,200 with volume, continuation toward ₹9,000–₹9,500 is likely.
Outlook:
As long as the price sustains above the uptrend line and ₹7,600 zone, the bias remains bullish. A clean breakout could mark the start of a new impulse wave
Accumulation and waiting for breakout #Chalet HotelNSE:CHALET
Earlier price has shown the distribution phase, Now it has accumulated at all time high, can start rally above the levels. Levels are shown on chart

TCS BIG DADDY OF IT Please consult your financial advisor before investing.This is only for learning purpose of chart.
We are NISM certified EQ and MCX trader but not SEBI register investment advisor.
HOLD FOR 18-24 MONTH 4800-4900 TGT....

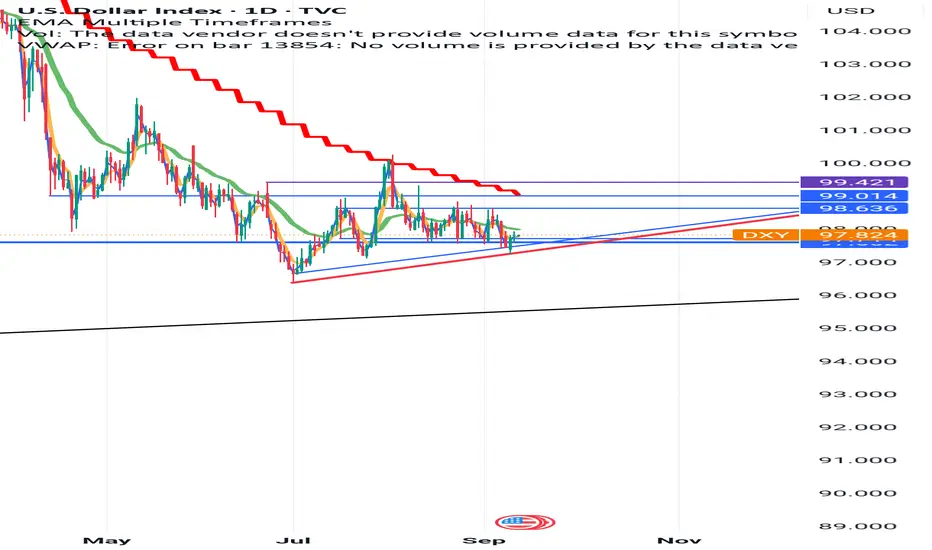
Bullish This chart is clear cut described dxy movement is ready for reversal
If this structure continue,we can see sharp fall in bullion
This chart is only for learning purpose
How to draw Curve line with Fib Time Zone ToolThe Fibonacci Time Zone tool in TradingView is a technical analysis drawing feature that plots a series of vertical lines along the time (horizontal) axis of a price chart. These lines are spaced according to the Fibonacci sequence (starting with 0, 1, 2, 3, 5, 8, 13, 21, 34, 55, 89, etc.), where each subsequent number is the sum of the two preceding ones. Unlike price-focused Fibonacci tools (e.g., retracements or extensions), this tool ignores price levels entirely and focuses solely on time intervals to forecast potential market turning points. It is typically drawn by selecting two points on the chart—often a significant swing high or low as the starting point (time 0)—and then extending lines to the right at Fibonacci-based intervals. The first few lines (e.g., 1, 2, 3) often cluster closely and are less reliable, so traders commonly start analyzing from the 5th or 8th zone (13 or 21 periods ahead) for more spaced-out projections.
Key Benefits of the Fibonacci Time Zone Tool in TradingView
This tool adds a temporal dimension to technical analysis, complementing price-based indicators by helping traders anticipate when significant events might occur rather than just where in price.
The Curved Line tool in TradingView allows users to draw smooth, freeform curves on a chart to connect price points, highlight trends, or mark custom patterns. Unlike straight lines (e.g., trendlines or channels), the Curved Line adapts to non-linear price movements, offering flexibility to trace organic patterns like arcs, parabolas, or irregular price paths. It’s accessible via the drawing tools menu and can be customized with colors, thickness, and styles (e.g., solid or dashed). Traders use it to visualize patterns that don’t fit rigid geometric shapes, such as rounded tops/bottoms or complex wave structures.
Key Benefits of the Curved Line Tool in TradingView
The Curved Line tool provides unique advantages for technical analysis by accommodating the non-linear nature of price action. Below are its primary benefits:
Visualizing Non-Linear Price Patterns:
Benefit: The tool excels at mapping curved price movements, such as rounded tops/bottoms, parabolic trends, or smooth reversals, which straight trendlines can’t capture accurately. For example, during a parabolic run in a stock or crypto chart, a curved line can trace the accelerating trend better than a straight line.

Gold (XAUUSD) 4H AnalysisPrice tapped into the supply zone and showed rejection.
If sellers hold this level, we can expect a sharp drop toward the previous demand area.
Watching for confirmation before execution.
I will update here exact entry and exit if Price gives me my setup

Glenmark bullishGap filled and there's a previous resistance at 1830 which can act as a support and push the price.
Buy at cmp or in the range of 1830 - 1855 for targets 2140 & 2675. (Sl 1625, if you want)

AUDJPY POTENTIAL LONGLooking to take a long position upon the retest of the orderblock that formed after the double purge of both buyside and sellside liquidity. Look for lower timeframe confirmation should you join me.

NSDLPrice is coming back to fill a small gap @ 1125.
From recent high to low, fib levels indicates a pullback at 0.5level - 1150,
Buy in the range of 1125-1150 for targets of 1400 & 1800

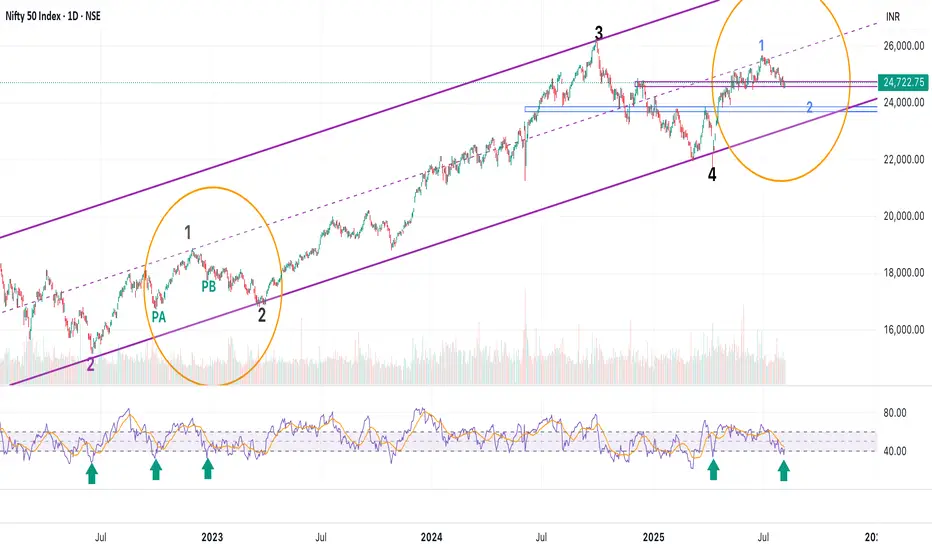
Nifty - Elliot Wave Counts - Update (Neutral)In our last post we discussed that in short term 25700 is the target and if we cross that, then Leading diagonal gets invalidated and hence we look for much higher levels.
Last post:
Thankfully, we didn't get out in shakeouts and rode the entire move till +25600
Now, unfortunately we did not cross 25700 and hence the chance of Wave 1 or something else ending at 25670 became stronger.
As of now, we are at a place where there is a lot of confusion. I see a 5th up pending in wider indices, but Nifty seems done.
So, is there a possibility that other indices go up, while Nifty just does a pullback as part of the correction and not make a new swing high?
A few charts for reference:
Nifty Smallcap:
Nifty 500:
That's about the counts : From other technicals perspective the move looks very similar to Sep 2022 - March 2023 period. But where in that period are we?
PA (point A)Oct 2022 - where one more high till Dec 2022 is left?
or
PB - Feb 2023 - where we just get a pullback and drift lower?
(I have marked green arrows on RSI charts to show the reference)
So, what do we do in such case?
Ditch nifty, play stocks. Lot of stocks looking good - starting 5th up (Just browse through and you'll find many making similar structure as SmallCap index)
(Hint - Defence, Realty, Autos, Metals, Pharma)
All the best!
I will share updates, if I get more clarity on Nifty - till then enjoy the stocks and trade light - remember we are playing seemingly the last leg. :)
Nifty upcoming moveWe have clean equal lows at 24462 and OB below that, weekly. Market should heavily expand towards that and take it first before giving any real upside move that would sustain. until then, any move upside is only correction phase.
your views are welcome.

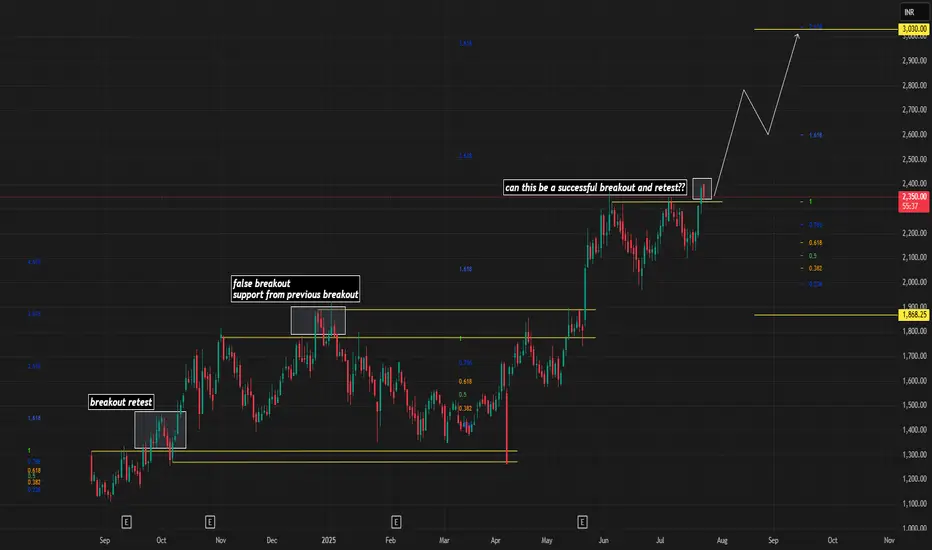
INTERARCH BULLISHRepeating cycles can be seen in every chart, every stock.
Every stock creates a pattern, interarch is following a pattern with fibonacci targets as shown.
Breakout and retest is done, one can enter at current market price for a target of 3000, stop loss can be 1870 (if you want sl)