CAPLIPOINT : A Textbook Elliott Wave Correction Unfolding
\ Timeframe:\ Daily
\ Structure:\ Corrective to Impulsive
\ Type:\ Educational Swing Setup
---
🔍 \ 1. Context and Background:\
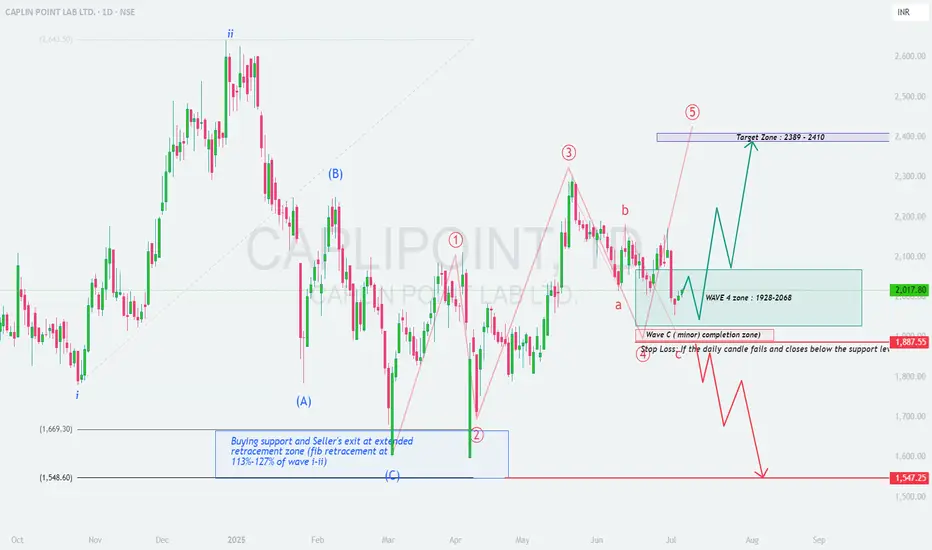
CAPLIPOINT has exhibited a classic 5-wave impulsive rally followed by a correction phase, aligning neatly with \ Elliott Wave Theory\ . Currently, the stock appears to be in \ Wave 4 correction\ – often a shallow, sideways or ABC-type pattern – preparing for a potential \ Wave 5 impulse\ .
---
📈 \ 2. Wave Structure Breakdown:\
* \ Wave 1 to Wave 3\ completed with good strength.
* \ Wave 3\ peaked near \ ₹2390\ , showing signs of extension.
* The ongoing \ Wave 4 correction\ seems to be forming a textbook \ ABC pattern\ :
* \ Wave A and Wave B\ completed.
* \ Wave C\ likely completed or very close to completion inside the support zone.
---
🟦 \ 3. Wave 4 Correction Zone – ₹1928 to ₹2068:\
This zone offers a \ high-probability reversal area\ supported by:
* \ 38.2%–50% Fibonacci retracement\ of Wave 3.
* Confluence with \ previous consolidation\ support.
* Price action showing \ long wicks and small candles\ , signaling accumulation or demand.
---
🟥 \ 4. Wave C and Critical Support – ₹1887:\
* ₹1887 is likely the \ end of Wave C\ and the complete ABC correction.
* Based on:
* \ 113%–127% Fibonacci extension\ of Wave A (classic C-wave completion area).
* Strong \ volume spike and price rejection\ near this zone.
---
🟪 \ 5. Wave 5 Target Projection – ₹2389 to ₹2410:\
Projected using:
* \ Fibonacci extension\ of Wave 1 from Wave 4 low.
* \ Measured move technique\ .
* Target aligns with previous resistance around \ Wave 3 top at ₹2390\ .
---
🛑 \ 6. Stop Loss & Invalidation Level:\
* \ Invalidation below ₹1887\ on a daily close.
* A close below this would signal a potential \ deeper correction\ toward ₹1547–1660 zone.
---
✅ \ 7. Strategic Swing Trade Plan:\
* \ Entry Zone:\ ₹1930 – ₹2065
* \ Stop Loss:\ ₹1887 (daily close basis)
* \ Target 1:\ ₹2250
* \ Target 2:\ ₹2389–2410 (projected Wave 5 zone)
---
### 🧠 \ 8. Why This Setup is Educational:\
* \ Textbook Elliott Wave Pattern:\ Classic 5-wave setup with ABC correction.
* \ Fibonacci Confluence:\ Retracement and extensions align perfectly.
* \ Price Action Validation:\ Support zone showing bullish characteristics.
* \ Defined Risk-Reward:\ Excellent R\:R with tight SL.
* \ Momentum Potential:\ Wave 5 often brings sharp, fast moves—ideal for swing setups.
---
📌 \ Conclusion:\
CAPLIPOINT is completing a clean \ Wave 4 correction\ and preparing for its \ final impulsive Wave 5\ . If \ ₹1887\ holds, the stock may target \ ₹2389–2410\ in the coming sessions. A technically rich and structurally strong swing opportunity for serious traders and wave enthusiasts.
Community ideas
NAZARA TECH LTD ANALYSISFOR LEARNING PURPOSE
NAZARA TECH LTD - The current price of NAZARA TECH LTD is 1385.10 rupees
I am going to buy this stock because of the reasons as follows-
1. Its coming out from a good consolidation base
2. It broke a strong resistance zone of 4 year and it's trying to go for new ATH
3. It is showing better relative strength as it stood strong in volatile times
4. The risk and reward is favourable
5. The stock belongs to a sector which is trying its best to be strong and probably it can do great in coming days.
6. The stock has done almost nothing in last 5 years (approx) and it has acted as a laggard (many stocks have made ATH much back but this stock has gone down after its IPO. Initially it went up a bit but then it was all down move)
I will buy it with minimum target of 35-40% and then will trail after that.
My SL is at 1212 rupees
I will be managing my risk.

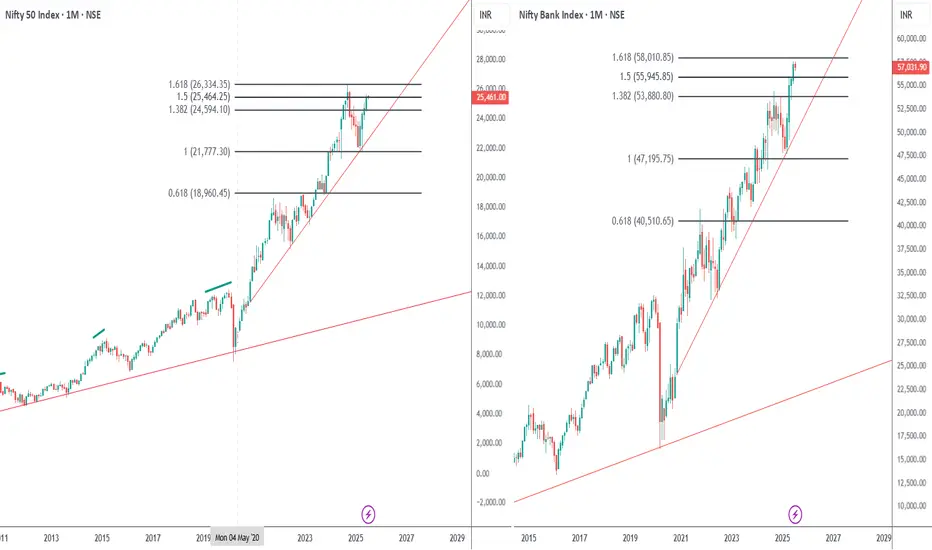
Both Indices at imp levelsNifty n BNF
Nifty CMP 26460
Fib Ext - the Index is just shy away from its all time high. The 24750 remains an imp support for the Index. The Index is at 1.5 fib resistance. Hence above 25460 we will see the highs again. On the contrary below this zone we will see 24750. In my view this zone is the most crucial support and break below this zone will bring in fresh selling.
BNF CMP 57032
The fib ext at 1.618 is at 58K. The Index has made a high of 57628. Hence to me the Index is right at resistance.
Conclusion -Major down trend will only happen once the trendline is broken. Both the Indices are at crucial zones. For Nifty 24750 is the crucial support and resistance back to the highs of 26300. BNF resistance is at 58K. In my view next week will be action packed week.
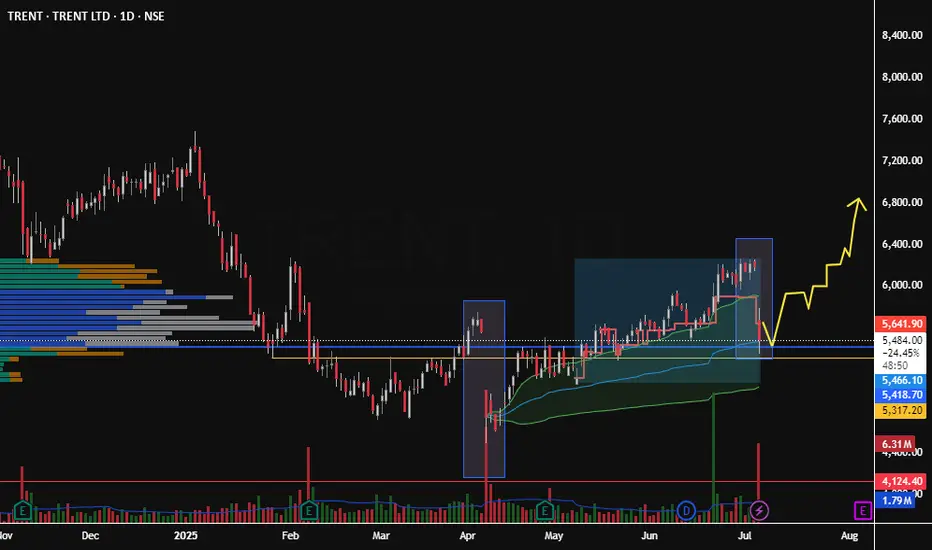
TRENT longTRENT after this big drop is a t a VALUE area as per volume profile.
Moreover, It retested the 200EMA and took a support there, Buyers came in
If you see history, what it has done after testing the 200EMA & we assume
it follows the same pattern, then this knee jerk is an opportunity with SL -1% below todays low
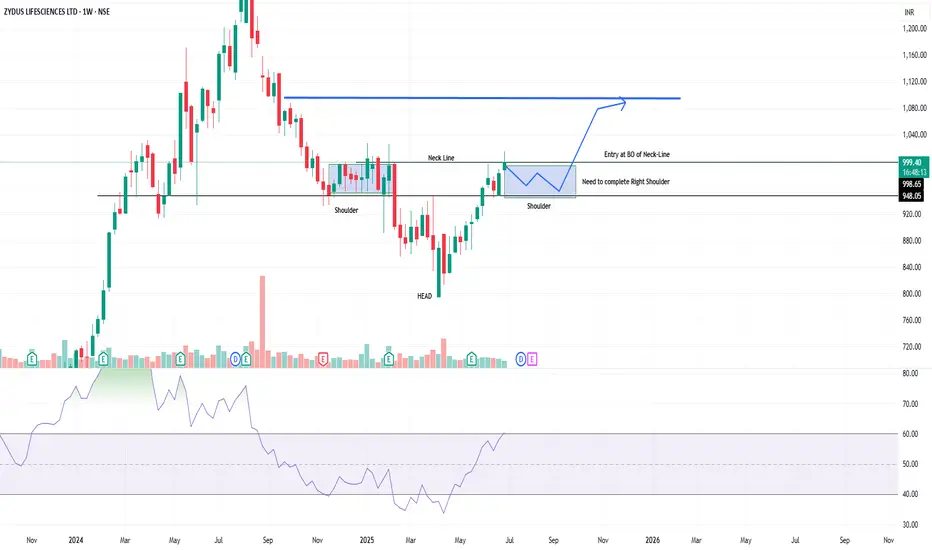
Zydus Lifesciences Ltd -- Weekly timeframe 1. Pattern: Inverse Head & Shoulders
Left Shoulder: Formed near the ₹950 zone.
Head: Dipped to around ₹860.
Right Shoulder: In formation, expected to consolidate between ₹950–₹980 before breakout.
Neckline: Around ₹998–₹1,000.
This is a bullish reversal pattern after a prior downtrend, suggesting a potential trend reversal.
2. Right Shoulder Completion (Current Stage)
Price is hovering near the neckline; pullback expected to complete the right shoulder.
This pullback can retest ₹950–₹975 zone before breakout.
This forms the best risk-reward entry zone with SL below ₹945–₹950.
3. Target Projection
Measured Move = Neckline (₹1,000) - Head (₹860) = ₹140.
Breakout Target = ₹1,000 + ₹140 = ₹1,140 (also shown on your chart with blue arrow).
This is the first target zone post-confirmed breakout.
4. Entry Strategy
Entry Trigger: On breakout above the neckline (₹1,000+ zone), with weekly candle close for confirmation.
You correctly marked this as the "Entry at BO of Neck-Line".
LIC Housing: A Correction That Refuses to End?After completing the first upward leg from the March low near 483.70, LIC Housing Finance rallied sharply to 623.90. This rise is being marked as wave 1 or A, depending on whether the structure develops into an impulse or a zigzag.
After that peak, a correction was expected. Initially, price dropped to 565.40 in a clear abc formation, which could have marked the end of wave 2 or B. However, the market didn’t follow through with a strong rally. Instead, price began moving sideways in a choppy, overlapping manner — a strong clue that the correction wasn’t over.
This overlapping price action evolved into a WXYXZ structure, a complex form of correction.
Here’s how the structure now looks:
The initial drop to 565.40 is being treated as wave a of a larger correction.
The sideways consolidation that followed is marked as wave b.
The current expectation is for a final wave c down — which would complete the full abc correction of a higher degree, labeled as wave 2 or B. The ideal target zone for wave c lies between 1x to 1.618x the length of wave a, projected from the end of wave b.
Support lies in the 568.80–532.65 zone. If price dips into this area and shows signs of reversal — particularly with bullish divergence on RSI — it could set the stage for the next leg higher in wave 3 or C.
The invalidation level for this count stands at 627.30. A sustained move above this level would negate the possibility of a wave c decline and instead suggest that a new impulsive leg has already begun.
Disclaimer: This analysis is for educational purposes only and does not constitute investment advice. Please do your own research (DYOR) before making any trading decisions.

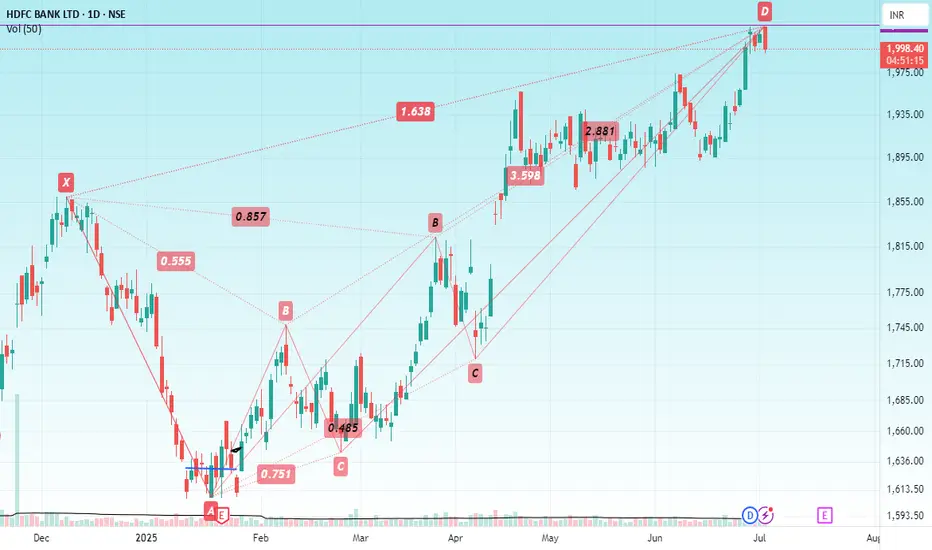
HDFC BANKHello & welcome to this analysis
It has made double bearish Harmonic patterns at the same PRZ level - Crab & Deep Crab in the daily time frame with so far today's candle being an Open = High in daily time frame.
A retracement till 1950 - 1875 could be possible as long as the stock does not cross 2050.
A heavyweight in both Nifty & Bank Nifty, it could halt the uptrend of both the indexes either till it does not complete its pullback or the patterns get negated.
All the best
EQUITASBNK – Symmetrical Triangle Breakout SetupNSE:EQUITASBNK
📈 EQUITASBNK – Symmetrical Triangle Breakout Setup | Swing Trade Opportunity 🛠️
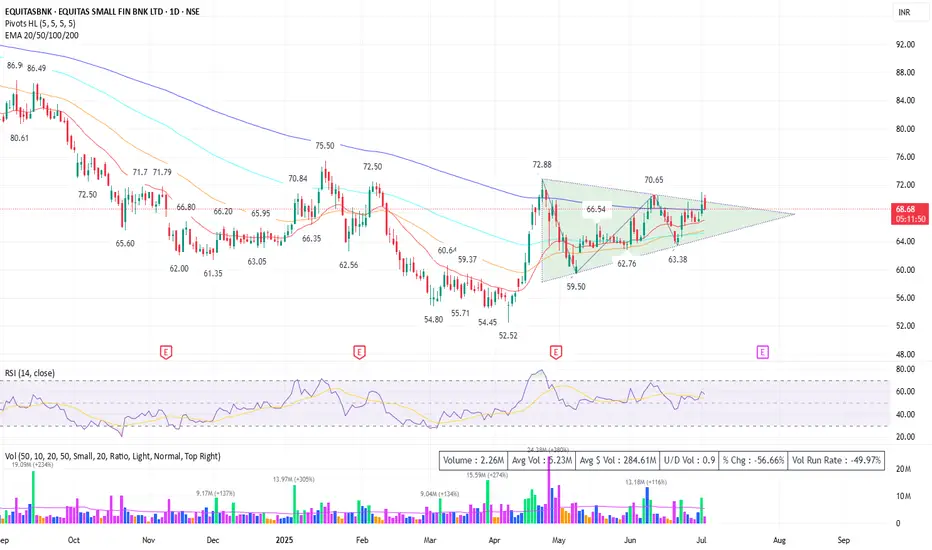
Equitas Small Finance Bank (EQUITASBNK) is forming a classic Symmetrical Triangle pattern on the Daily chart, indicating potential breakout momentum. Price is consolidating within a tightening range and recently attempted a breakout near ₹70 before pulling back slightly.
• Chart Pattern : Symmetrical Triangle – converging trendlines since April 2025.
• Support Zones : ₹66.50, ₹63.30 (swing low), and ₹62.76 (triangle base).
• Resistance Zones : ₹70.65 (recent swing high), ₹72.88 (previous top), ₹75.50 (pattern target).
• Moving Averages:
- EMA 20 = ₹66.56
- EMA 50 = ₹65.06
- EMA 200 = ₹68.50 (recently tested)
• RSI (14): 57.22 – Neutral bullish zone, not overbought.
• Volume: Breakout attempt saw increasing volume, followed by low-volume pullback – indicating strength.
> With the price retesting the upper triangle boundary and sitting above key moving averages, a breakout above ₹70.65 could initiate a strong bullish move. Watch for volume confirmation and RSI push above 60 for added strength.
🎯 Trade Plan :
• Entry (Aggressive): ₹68.5–₹69 on retest support.
• Entry (Confirmation): Above ₹70.65 with closing + volume > 2.5M.
• Stop Loss: Below ₹66.00 (EMA confluence + trendline support).
• Targets:
- T1: ₹72.80
- T2: ₹75.50
- T3 (Extended): ₹78.00 (measured move from triangle)
• Risk-Reward: Approx. 1:2.5 to 1:3
⚠️ Disclaimer:
This is a technical view for educational purposes only. Please do your own research or consult your financial advisor before acting on this idea.
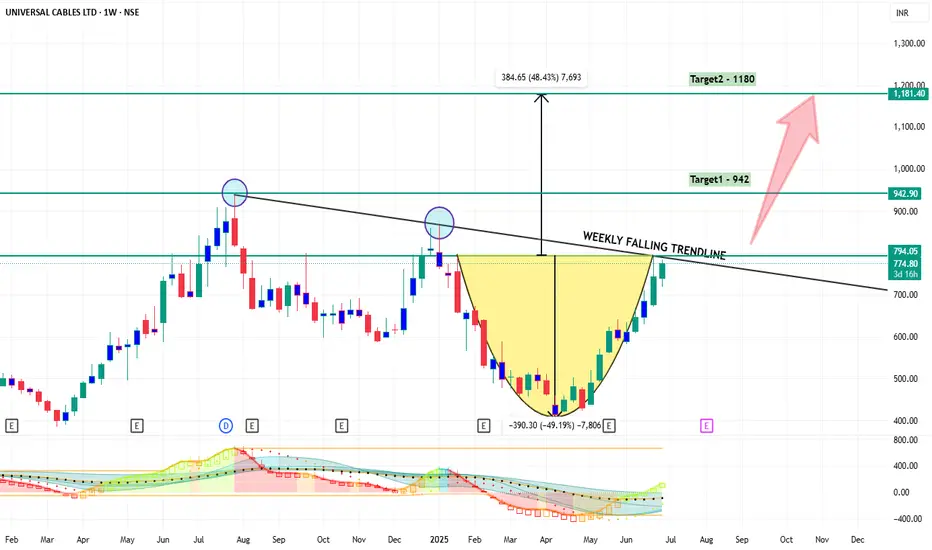
Rounding Bottom & Trendline BreakoutUniversal Cables Looks like a good candidate for a good upswing
Rounding bottom in weekly timeframe along with a weekly downwards trendline breakout above 800 levels should give a good breakout for
Target1 = 942
Targer2 - 1180
Cable industry has been in the recent news as some giants are looking to invest in the next couple of years
Looks like a multibagger but please do your fundamental analysis
Head and shoulder into cup and handle patternHudco turning head and shoulder pattern into cup and handle pattern price is near resistance and break anytime. This is a short term trade
Buy around - 230-240
Target - 340
Duration - 2-3 months

GRPLTD - Rising Back? 📊 **Technical Analysis: GRPLTD (Daily Timeframe)**
### 🔻 Recent Downtrend:
* The chart reflects a **clear corrective phase** with a series of lower highs and lower lows, marked by TS (Trailing Stop) labels and wave structure.
* A potential reversal is forming near a key **support zone**.
---
## 🟪 **Support Zone: 2521–2600 (Pink Box)**
* Price recently tested the **VS (Volume Spike)** zone around \ ₹2521.37\ , which acted as a **major support**.
* A bullish reversal candle has emerged from this zone, suggesting \ demand absorption\ and a possible swing low formation.
---
## 🟧 **Minor Resistance Zone: \~2680–2750**
* Price is currently testing a **supply region (orange box)**. This area could temporarily pause upside movement.
* Sustained move above this range is essential for bullish continuation.
---
## 🔵 **Upper Resistance / Target Zone: 3295–3377**
* A large untested **supply zone** lies ahead, making it a **probable swing target** if momentum sustains.
---
## 📝 **Trade Idea: Bullish Reversal in Progress**
### ✅ \ Long Entry Zone:\
Around current price \ ₹2779–2800\ , or on retest of breakout above ₹2750
### 🎯 \ Targets:\
* T1: ₹2883 (recent TS3 high)
* T2: ₹3295
* T3: ₹3377
### ❌ \ Stop Loss:\
Close below ₹2520 (below VS low and structure invalidation)
---
## 🧠 **Trade Logic:**
* Price structure shows a potential \ ABC correction completed\ .
* Strong reaction from a high-probability **Volume Spike Support** zone.
* **Higher low + break above swing structure** would confirm trend reversal.
* Conservative traders may wait for a **close above ₹2880** for confirmation.
---
## ⚠️ **Risk Management:**
* Keep strict SL as structure is still recovering from a downtrend.
* Size position based on volatility.
---
📌 **Summary:**
GRPLTD has reacted strongly from a key demand zone. If price sustains above ₹2750–2800, there is room for a bullish swing toward ₹3295+.
Ideal for \ positional/swing traders\ with good risk-reward potential.

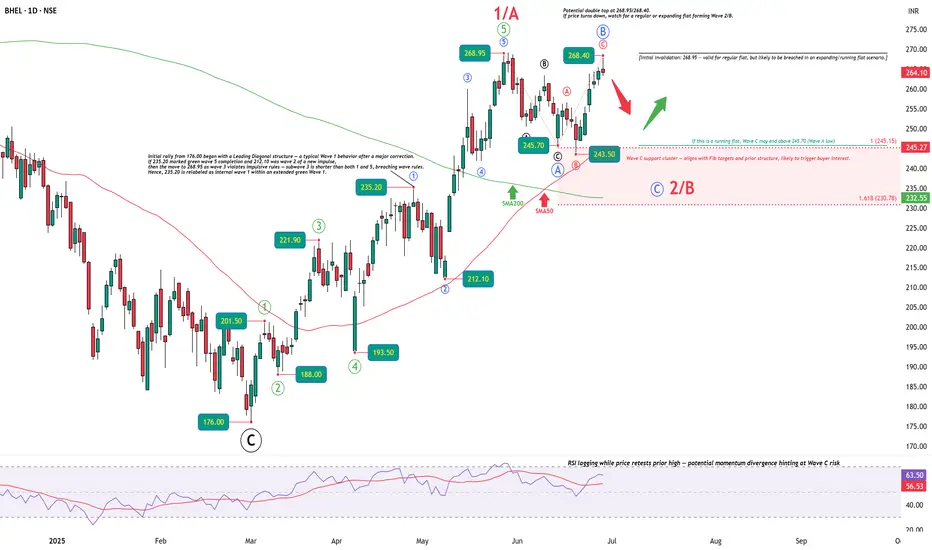
BHEL – Wave 2/B Pullback in Play?After a strong 5-wave rally from 176.00 to 268.95, BHEL may be entering a corrective phase — either a regular, expanding, or even a running flat.
Price has formed a potential double top at 268.95/268.40. The pullback from here could complete a Wave C within the 245–232 zone, supported by Fibonacci extensions and prior structure.
🔻 Short-term bias: bearish, targeting Wave C completion.
⚠️ However, if this turns out to be a running flat, Wave C may end above 245.70 (Wave A low) and still be valid — so price may reverse early.
📉 RSI is lagging as price retests highs — hinting at weakening momentum.
📌 Key Levels:
Invalidation for short-term short: 268.95 (tight; likely breached in expanding/running flat)
Wave C zone: 245.15 to 230.78
Structural invalidation (bullish view fails): below 230.78
🟢 Big picture: bullish.
This correction is likely setting up the next impulsive Wave 3 or C toward new highs.
Let price confirm it.
Disclaimer:This analysis is for educational purposes only and does not constitute investment advice. Please do your own research (DYOR) before making any trading decisions.
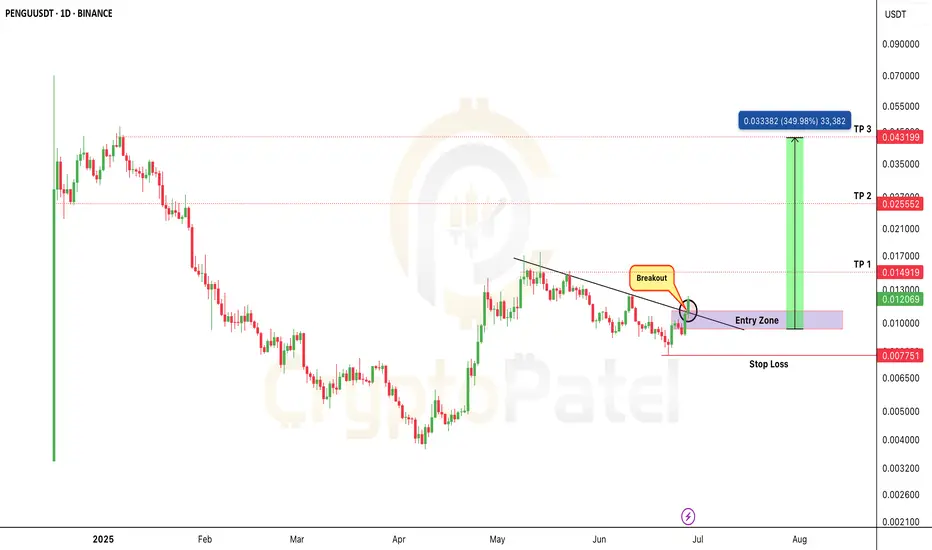
PENGU Breakout Live — Could This Be the Next 5x Runner?PENGU Breakout Live — Could This Be the Next 5x Runner?
PENGU/USDT just broke a major trendline after weeks of consolidation…
If this breakout holds — we’re staring at a potential 3x–5x move in the coming days.
But here’s the twist…
❌ Don't FOMO!
The smart entry is likely $0.010–$0.0090 — a clean retest zone where risk–reward is best.
Chart invalid if price breaks below: $0.0077
Targets if breakout holds: $0.0150 / $0.025 / $0.043 / $0.10
This is a breakout + retest setup with explosive potential — but only if you play it right.
Always use risk management.
This is NOT financial advice — DYOR before you enter any trade.
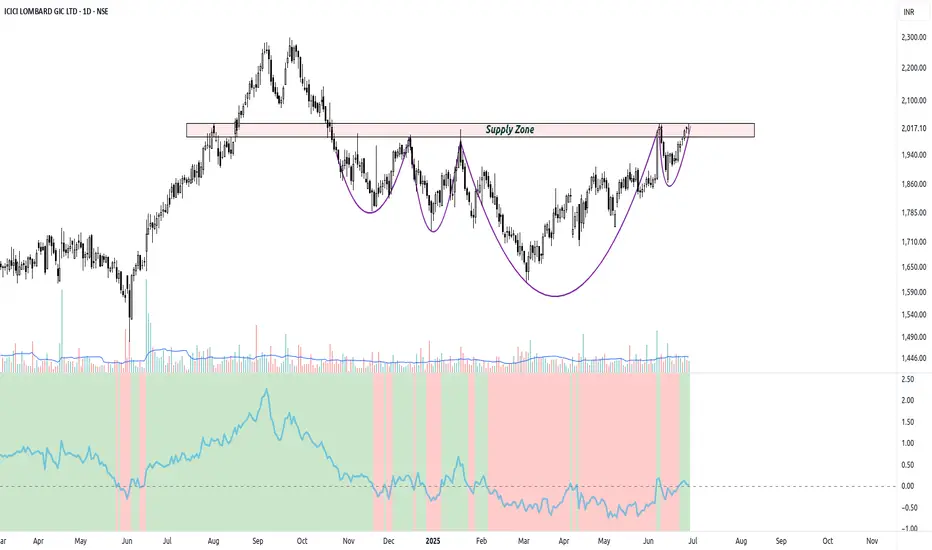
ICICIGITechnical Analysis Breakdown:
1. Rounded Bottom + Multi-stage Base Formation
The stock has carved out a long rounded bottom, forming three notable cup-like bases over the past year.
Each time the price pulled back, it found support near key demand zones (highlighted in blue), forming higher lows — a sign of accumulation.
The current price action shows a smooth rounding structure that suggests growing buyer interest and waning seller pressure.
2. Supply Zone Test in Progress
Price is now approaching a strong supply zone (~₹2,030–2,050), where it has previously faced rejection multiple times.
The presence of long wicks in this zone in the past signals institutional selling pressure.
Watch for a decisive breakout with strong volume to confirm that supply has been absorbed.
3. Relative Strength Turning Up
The RS line vs Nifty has moved into positive territory after several months of underperformance.
This shift is crucial — especially if confirmed on the weekly chart — it implies sector rotation or renewed leadership from ICICIGI.
4. Moving Averages in Bullish Alignment
The stock is now trading above all key moving averages (20, 50, 100, 200 EMA), all of which are curling upwards.
This signals a strong trend resumption, especially as the 200 EMA acts as long-term support.
The breakout above the 200 EMA (around ₹1,940) was a major structural shift.
5. Volume and VCP Context
Recent price action shows tighter price ranges with reduced volatility near resistance, a characteristic of Volatility Contraction Pattern (VCP).
Volume has remained subdued but consistently stable, which is constructive as long as it expands on breakout attempts.
Interpretation & Trade Strategy
✅ Bullish Scenario:
A strong breakout above ₹2,050 with above-average volume can lead to a fresh rally, possibly retesting the previous all-time high zone (₹2,250+).
Follow-up candle should ideally close strong with range expansion.
⚠️ Risk Management:
Any rejection around ₹2,030–2,050 accompanied by high volume selling could lead to another correction within the base.
Traders should be cautious of false breakouts and manage entries based on volume confirmation or wait for a pullback entry near ₹1,970–1,990 if risk/reward improves.
📝 Conclusion
ICICIGI is showing classic signs of long-term accumulation, emerging strength, and trend reversal.
With the supply zone being tested now, the stock is at a critical inflection point. If buyers can overcome this hurdle with conviction, ICICIGI may rejoin the list of strong performers in the insurance space.
📌 Watch for:
Volume confirmation on breakout
Retest and hold of the ₹2,000–2,020 zone
RS staying above zero
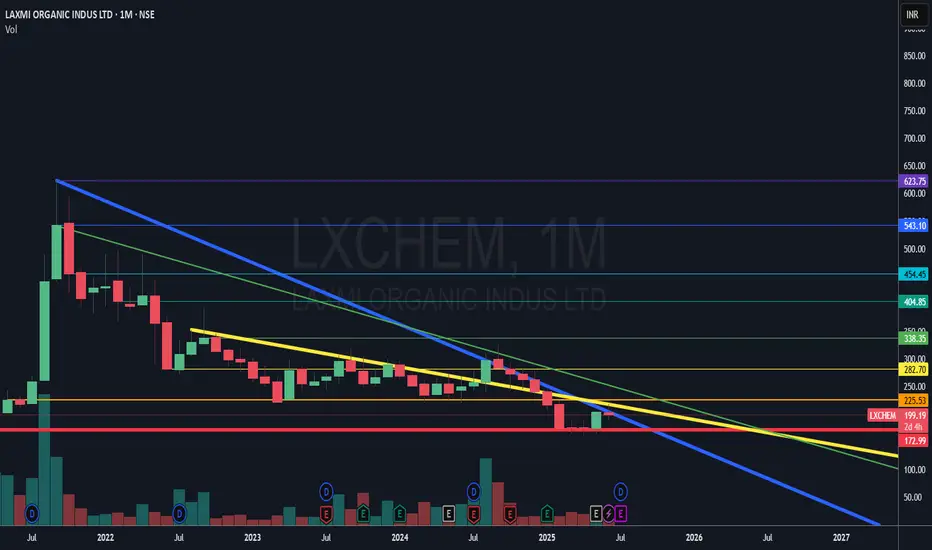
"growth partner of choice"Laxmi Organic Industries Ltd: CMP 199
Update: The previous breakout attempt didn’t hold, but the chart is showing renewed strength. Most chemical stocks are looking strong, indicating sector-wide momentum. Volume has started picking up again, which is a positive sign. Although the risk-to-reward ratio is currently limited, a decisive breakout and monthly close above ₹230 could confirm a trend reversal and open up significant upside potential. Watching closely for confirmation.
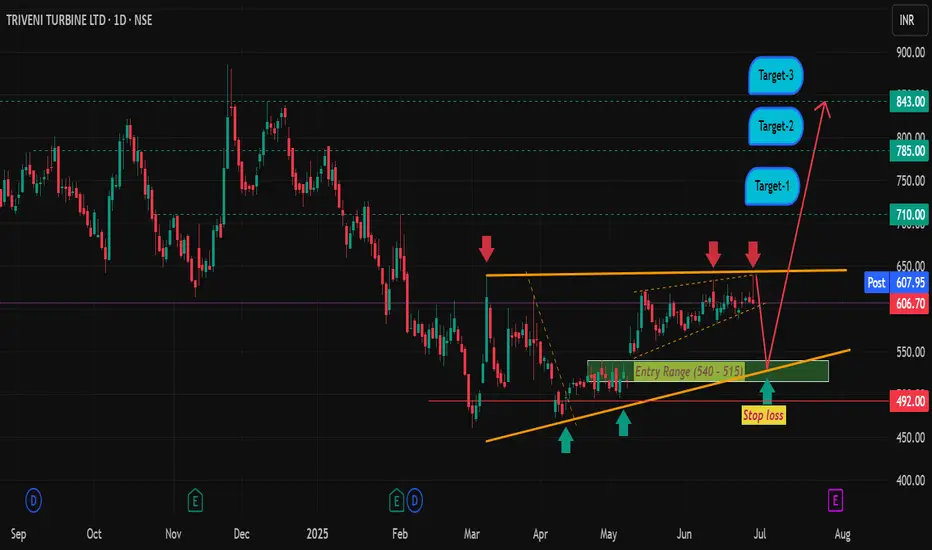
Triveni Turbine LtdTriveni Turbine specializes in the manufacturing and maintenance of steam turbines, particularly for industrial and power generation applications. They offer a range of steam turbines, including back-pressure and condensing types, designed for diverse pressure and flow requirements, up to 100 MW.
The company demonstrates strong profitability with a good profit growth of 25.1% CAGR over the last 5 years. They also have a healthy interest coverage ratio (64.45) and a good cash flow management.
Promoters hold a significant portion of the shares (55.84%), while Foreign Institutional Investors (FIIs) hold a substantial stake as well (28.01%)
Entry, stop loss and target details mentioned in the chart.
Note: Please do your self financial assessment before investment, I am not certified stock analyst.
Titan | Swing | Breakout Titan has just given a clean trendline breakout followed by a successful retest, which makes this setup quite interesting from a positional swing trade perspective.
✅ Trendline Breakout
• The stock broke a strong descending trendline that had been acting as resistance for several months.
✅ Retest and Bounce
• After the breakout, Titan came back to retest the breakout level near ₹3,380, which held well — a classic bullish sign. This bounce happened around the 38.2% Fibonacci retracement zone — another technical confluence that adds weight to the trade idea.
⸻
📈 Entry, Targets & Stop Loss
• Entry Zone: Around ₹3,665 – ₹3,695
• Stop Loss (SL): Below ₹3,202
Important note: If price breaks below ₹3,500 without RSI crossing 75, it might lead to negative RSI divergence — a warning of weakening momentum. In that case, better to exit to avoid capital getting stuck.
⸻
🎯 Targets Based on Fibonacci Extensions:
• Target 1: ₹4,123
• Target 2: ₹4,324
• Target 3: ₹4,580
These targets are calculated using Fibonacci extension levels, with the final one being the 1.618 golden ratio zone.
⸻
Disclaimer: Do your own analysis before putting money in investment. Idea is for education purpose to share and learn within trading view community. Not a suggestion to put your hard earn money.

Titan - Keep On WatchCMP 3652 on 26.06.25
The chart itself is self-explanatory. The price has formed a Cup & Handle-like pattern since February 2025. This time, it is reaching the breakout levels.
MACD shows a likely reversal, too.
If it breaks out, it may go bullish to reach the levels of 3850, 4050, and potentially higher, depending on the market conditions.
In case of any correction, support levels are around 3510.
One may plan entry on different levels while considering risk management and position size.
All these illustrations are only for learning and sharing purposes; it is not buy or sell advice. Please do your research before taking any trade.
All the best.

WCIL - H&S Pattern | Breakout Above Resistance | Daily Chart📊 WCIL – Breakout Above Resistance | RSI Bullish | Strong Volume | Fibonacci Levels | Daily Chart
📅 Chart Date: June 27, 2025
📈 CMP: ₹114.43 (+3.42%)
📍 Ticker: NSE:WCIL
🔍 Technical Analysis Summary
🔺 Breakout From Trendline & Resistance
WCIL has broken out above horizontal resistance at ₹113.50 and long-term descending trendline, indicating strong bullish momentum
Golden neckline breakout of a potential inverse head & shoulder / V-recovery formation
📊 Volume Spike
Massive increase in volume (7.09M) confirms buying interest and validates the breakout
📈 RSI Indicator (14, Close)
RSI at 70.85, trending upward and entering bullish territory
Multiple Bullish RSI crossover signals provide confluence for the uptrend
🌀 Fibonacci Retracement Levels
38.2% – ₹107.94
50.0% – ₹121.13 (next key level)
61.8% – ₹134.31
100% – ₹177.00 (full retracement potential)
📍 Key Price Levels
✅ Breakout Zone: ₹113.50
🔼 Immediate Resistance: ₹121.13
🎯 Target Levels: ₹121 → ₹134 → ₹153+
🛡️ Support Levels: ₹107.9 → ₹100 → ₹91
💡 Trade Idea
Entry: Above ₹114 on confirmation with volume
SL: Below ₹107.50 (close below previous resistance)
Targets: ₹121 → ₹134 → ₹153
Risk-Reward: High conviction due to structure and volume
⚠️ Disclaimer
This chart analysis is for educational purposes only. Always DYOR (Do Your Own Research) and consult a financial advisor before making investment decisions.

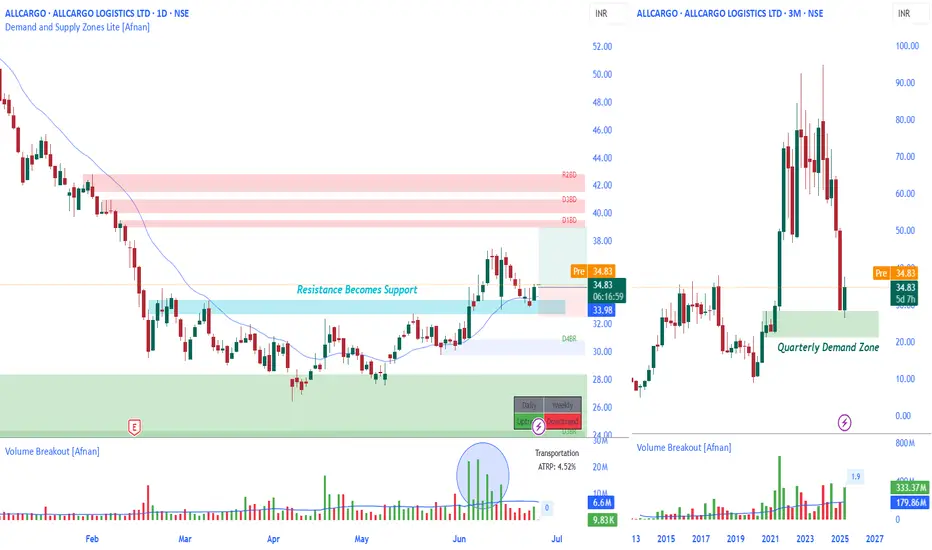
Quarterly Demand Zone + Daily Breakout = Strong ConfluenceLet’s talk about a setup that checks almost every box for a technically sound trade— NSE:ALLCARGO .
This isn’t just any breakout. It’s one of those rare moments when multiple timeframes are pointing in the same direction... and when that happens, smart traders pay attention.
🧱 Quarterly Demand Zone – The Foundation of the Setup
This isn’t just a technical level—it’s a potential stronghold for smart money activity. Price has just entered and reacted from a well-defined Quarterly Demand Zone, which historically tends to be the playground of institutions, not retail noise.
What I find especially compelling is how the reaction from this Quarterly Demand Zone isn't just visible—it’s meaningful. The current quarterly candle is green, forming on increasing volume, and there are only 3 days left until it closes. That’s not random—it’s calculated accumulation.
🧱 Daily Price Action Breakdown
On the Daily timeframe, the stock had been in a tight sideways range for a while. That consolidation wasn’t random—it was accumulation. We saw repeated tests of a clear resistance zone, gradually weakening that level... and then?
Boom. Breakout.
And not a weak or fake-out move either. This one came with conviction and volume. Now the price is pulling back slightly, retesting the breakout zone—which, by the way, is now acting as support thanks to the Polarity Principle . The most recent daily candle? Showing signs of price respecting this level.
💡 When price responds to a higher timeframe demand zone and then breaks out on the lower timeframe with strength, that’s a serious signal of institutional activity and trend continuation. you’re not just chasing momentum—you’re trading with alignment .
📊 Technical Highlights
Quarterly Demand Zone Reacted : Price reversed from a higher timeframe zone—classic smart money footprint.
Quarterly Candle Turned Bullish : Green candle forming with rising volume, hinting at a potential long-term reversal.
Daily Breakout From Consolidation : Resistance was tested multiple times, finally gave way.
Volume Confirmation : Breakout candle printed on above-average volume—always a good sign.
Polarity Flip : Resistance has turned into support, and price seems to be holding it for now.
📍 My Take on This Trade
For a swing trader who values structure and confirmation, this setup is about as clean as it gets. The Quarterly Demand Zone is doing the heavy lifting here , giving you that deep, institutional-level context. And the daily breakout? The story is unfolding right in front of us.
I’m bullish on this setup. Entry at CMP 34.83, Place stop-loss just below yesterday's ’s candle low (with a bit of a buffer). First target? The daily supply zone—which could offer a solid 1:2 risk-to-reward. If the rally continues, consider trailing your stop loss to lock in gains. But let’s be real: any setup can fail. Price could easily dip back into the range or break lower. That’s why risk management isn’t optional—it’s essential. This isn’t financial advice—just an analytical perspective for educational purposes.
🧠 Final Thoughts
If the Quarterly chart is your tide, the Daily is just the wave. And right now, both are flowing in the same direction. That’s not the time to hesitate—that’s the time to execute (with proper risk, of course).
✨ “Price reacts where smart money acts. Your job is to listen, not predict.” 🔍
🎯 Remember, it’s not about predicting—it’s about aligning your trades with high-probability setups.
📈 Stay sharp, trade clean, and respect the zones.
Thanks for the read. Got thoughts or questions? Drop them below—I’m always happy to chat charts.
Thanks for the support—keep studying the charts, and keep sharpening your edge. 📈💬
This analysis is for educational purposes only. I’m not a SEBI-registered advisor and this is not a trading or investment recommendation.
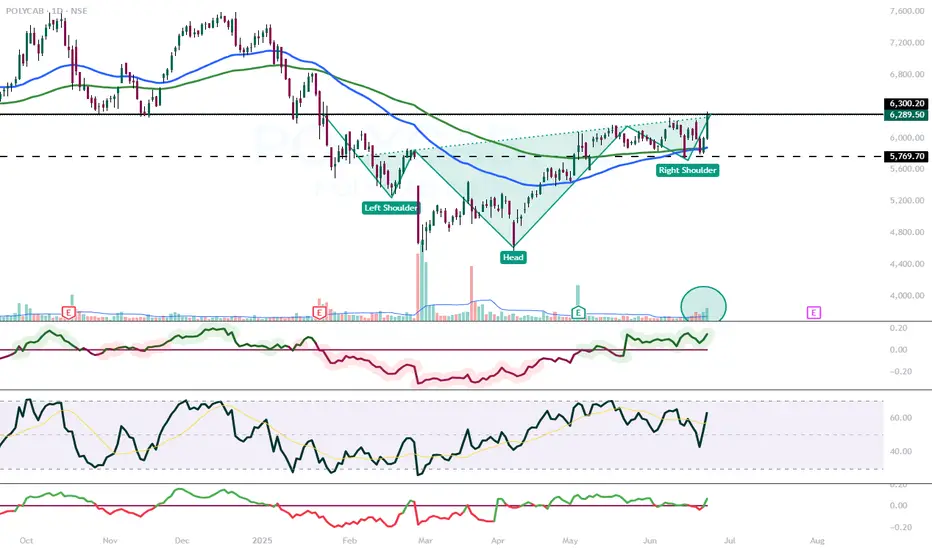
POLYCAB Looking interestingNSE:POLYCAB at a very interesting juncture.
Inverse Head and shoulder pattern
Near very important Resistance level.
RS positive
RSI above 50 EMA cross over.
Volume Increasing
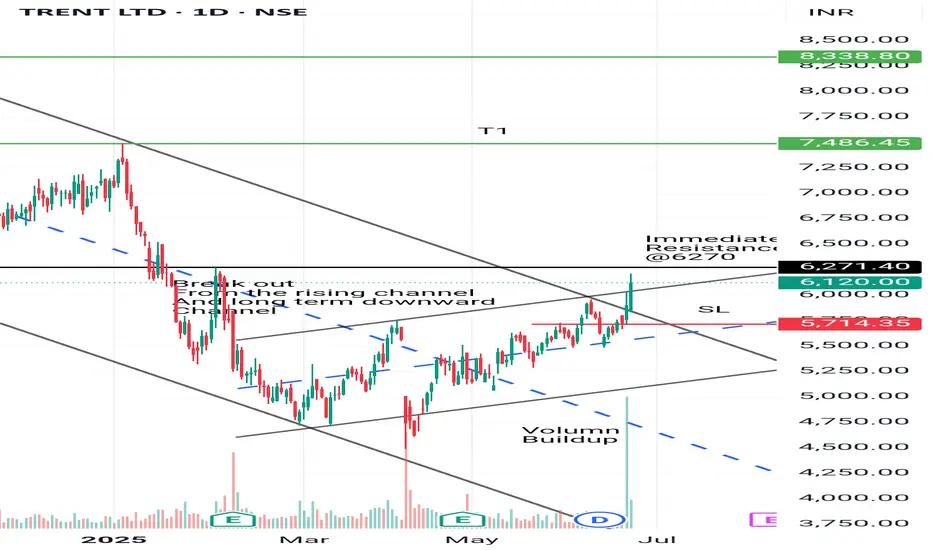
Trent: A multichannel breakout with 1:6 RR
trent was moving in downward channel system 1 from October 24 to May 25
It has form a upward channel system 2 in the last 1 month
Today it made a breakout with significant volumn buildup.
Go long with 50% position on CMP
Remaining 50% could add after week candle confirmation
Sl should be around 5690 with the two target highlighted in green
A trade with excellent RR
Educational purpose! Happy learning 😁😁
NRB Bearing - Cup & Handle PatternNRB Bearing after a downfall has made a cup & handle pattern and is looking to move upward. Other factors:
1. Last few quarters growth rate was not good because of fire in a major factory, which now has been rectified, and capacity has reached at same levels.
2. Capacity expansion of 200 crores
3. Promoter has un-pledged all shares, showing strong financial position
4. Cup & Handle with good volumes.
Keep following @Cleaneasycharts as we provide Right Stock at Right Time at Right Price.
Cheers!!
