Indraprastha Medical Ltd | Bullish Flag Breakout | Swing SetupCompany Overview (Fundamental)
Indraprastha Medical Corporation Ltd (IMCL) operates under the Apollo Hospitals Group and manages the Indraprastha Apollo Hospital, New Delhi — one of India’s largest multi-specialty hospitals. Company financially strong, consistent profitability, improving margins, and low debt.
Fundamentally stable company with consistent earnings and a defensive sector (Healthcare).
Strong base for technical breakout follow-through.
💰 Market Cap: ~₹5,400 Cr
📈 Revenue Growth (YoY): +16% (Strong Growth)
💸 Net Profit Margin: ~10–12% (steady)
💵 Debt-to-Equity: 0.05 (virtually debt-free)
📊 ROE (Return on Equity): ~20%
Technical Overview
The setup represents a bullish continuation phase, with EMAs stacked positively and volume confirming accumulation.
Price trades above all 3 key EMAs (9, 20, 50) — strong bullish alignment.
Formation of a textbook Bullish Flag Pattern after a sharp pole rally from ₹460 to ₹610.
Recent candle closed bullish with +3.4% gain and high volume (2.48M) — indicating renewed buying interest.
RSI ~60 → Momentum healthy and not overbought.
MACD positive crossover developing, confirming bullish trend strength.
Price Action Analysis
Clean, bullish, momentum-driven move with volume confirmation.
Buy on dip near breakout retest at ₹580-583
Book Partial profit at ₹625–630
target 2: ₹655–660 this will be Flag breakout projection.
A perfect risk to reward ratio following.
Disclaimer
This analysis is for educational and research purposes only — not investment advice.
Always do your own due diligence and manage risk before trading.
Community ideas

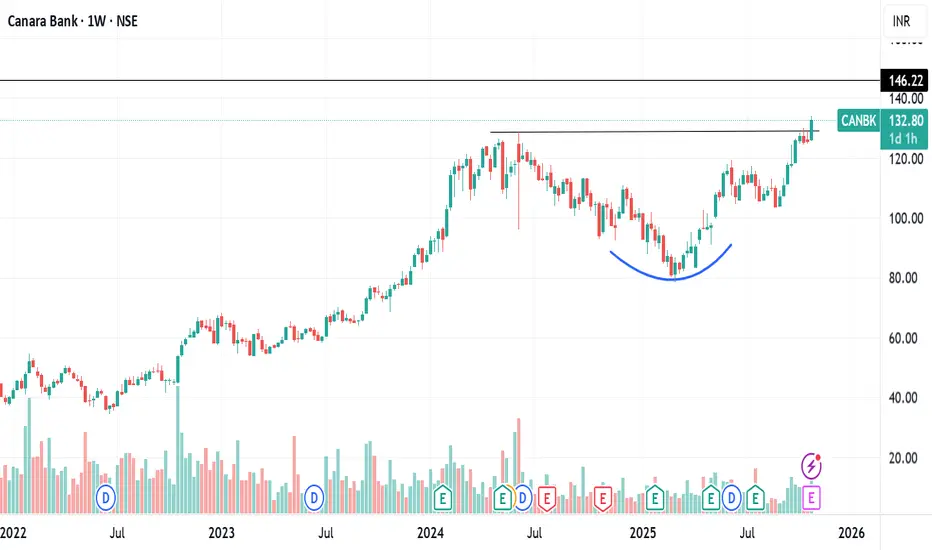
CANARA BANK ROUNDING BOTTOM BREAKOUTCanara bank breaking rounding bottom weekly
with huge volume this week
RSI above 60 bullish
heading towards 15 yr high
q2 net profit rises 19% +ve
target 146 then can lead to ATH 164 also
NO BUY/SELL RECOMENDATION
VEDLStrong Breakout Candidates!
#VEDL
1- Bottom Formation bo.
2- Uptrend is Still Intact
3- Trading above all key moving averages
Keep on Radar.
Potential Upside Stocks!
#Disclaimer: View shared it for educational purposes only.
Follow for more upcoming charts.

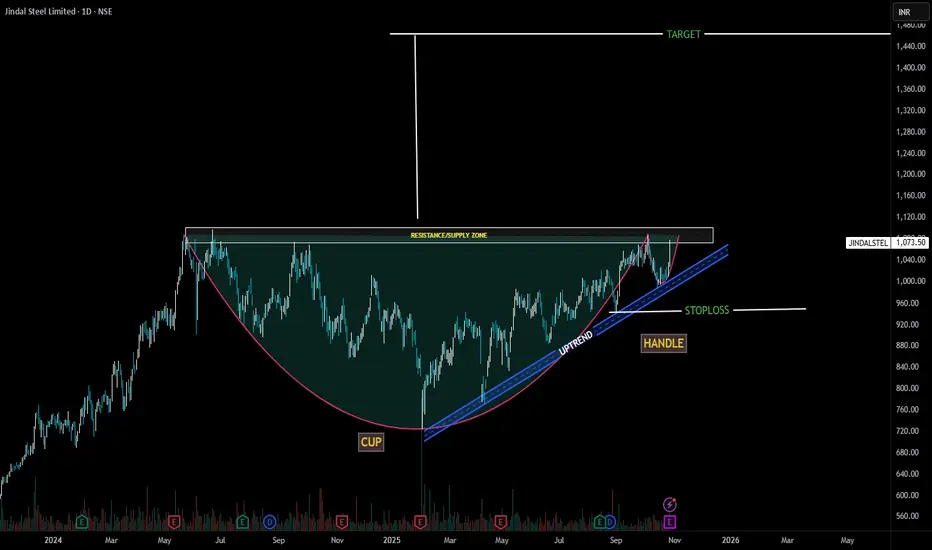
JINDAL STEEL LIMITEDCup Formation:
The left side shows a clear decline followed by a rounded bottom and a steady recovery forming a "U" shape — ✅ valid cup structure.
Volume tends to decrease during the cup and increase on the right side — which seems consistent here.
Handle Formation:
The handle is shorter in duration and has a mild retracement, not breaking the uptrend channel — ✅ valid handle structure.
The breakout from the handle appears to be approaching the resistance/supply zone — this is typically where confirmation is needed.
Resistance/Supply Zone:
The horizontal resistance around ₹1,100 is correctly marked. A breakout above this zone with strong volume would confirm the pattern — ✅ correct identification.
🎯 Target Projection
The target has been drawn correctly using the height of the cup added to the breakout level.
Based on the chart, the target near ₹1,400–₹1,450 seems technically justified (around a 30–35% upside).
⚠️ Stop-Loss & Risk Management
The stop-loss zone near ₹950 aligns well with the handle’s lower trendline and the uptrend channel support — ✅ logical and well-placed.
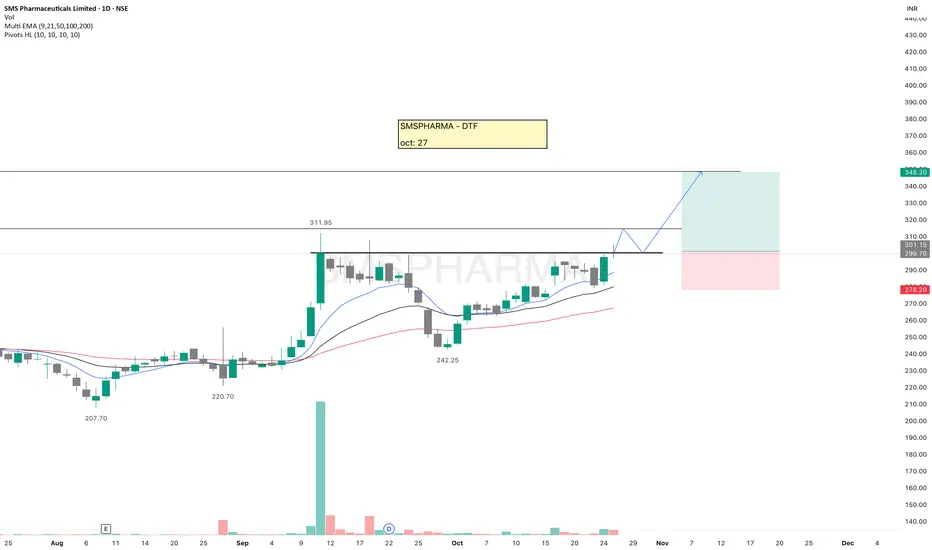
SMSPHARMASMSPHARMA is looking strong and forming a bullish structure. A breakout from the current level can lead to a good upside move.
Even while paper trading, always use a stop-loss, it builds the right trading habit.
Keep this stock on your watchlist.
✅ If you like my analysis, please follow me here as a token of appreciation :)
in.tradingview.com/u/SatpalS/
📌 For learning and educational purposes only, not a recommendation. Please consult your financial advisor before investing.
BANCOINDIA Testing Powerful Demand Zone + Breakout Retest 🧠 Understanding the Smart Money Footprints 🧠
Demand and supply zones are not just colorful boxes on a chart — they represent the footprints of smart money . When institutions buy, they don’t enter all their orders at once like retail traders do. Instead, they accumulate positions in parts — leaving behind a visible trail that we can identify on charts through price imbalances. These imbalances structures — form demand and supply zones .
When price returns to these zones, it’s essentially revisiting the footprints of big players — the levels where unfilled institutional orders might still exist.
In BANCOINDIA, we can clearly see this institutional footprint. The stock is now trading near a high-quality demand zone . The structure here is clean and powerful — a perfect Rally–Base–Rally (RBR) formation.
The leg-out candle that formed this demand zone had strong follow-through and even broke past the previous all-time high , confirming intense buying pressure. Now that price is revisiting this zone, it’s showing potential for a fresh upside move.
📉 Traditional Technical Lens 📉
Let’s now analyze BANCOINDIA through the classical technical perspective.
The stock had earlier broken a significant resistance level with massive bullish volume . That breakout confirmed strong demand participation. Now, price is retracing back toward that same level — which, according to the Law of Polarity , should act as new support.
Moreover, the 50 EMA is aligning beautifully beneath the price. The ongoing pullback is approaching both the EMA 50 and the previous resistance — a confluence that further strengthens the bullish bias.
If we observe the volume , we can see that the selling volume is drying up compared to the prior rally. This shows a lack of bearish momentum, increasing the probability of a bounce from current levels.
🎯 Confluence & Trading View 🎯
When we combine both lenses — Demand & Supply Zone Analysis and Traditional Technical Analysis — we find strong confluence:
The stock is sitting inside a powerful Rally–Base–Rally Demand Zone .
The previous resistance has now turned into support (Law of Polarity).
The 50 EMA is acting as an additional support layer.
Volume analysis shows selling pressure drying up.
Together, these signals suggest a high-probability reversal zone. If BANCOINDIA respects this area, we could see the next leg of rally begin soon.
However — as all seasoned traders know — no setup is 100% guaranteed. Risk management is your best friend. Always define your stop loss before thinking about your target. Even the strongest setups can fail, and protecting your capital must come first.
Identify your demand zone and entry level precisely.
Place your stop loss logically below the zone.
Aim for a 1:2 or 1:3 risk-to-reward ratio .
Let the market do the work — not emotions.
"In trading, patience and risk control build fortunes — not predictions."
Lastly, Thank you for your support, your likes & comments. Feel free to ask if you have questions. 🚀
📚 This analysis is purely for educational purposes and is not intended as a trading or investment recommendation. I am not a SEBI registered analyst.

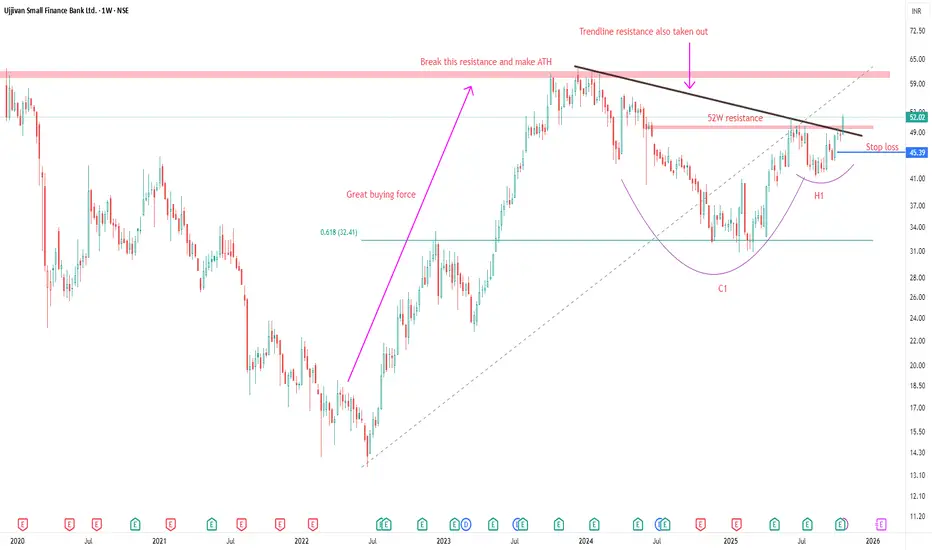
UJJIVAN SMALL FINANCE BANK ANALYSISTHIS IS MY CHART OF THE WEEK PICK
FOR LEARNING PURPOSE
UJJIVAN SMALL FINANCE BANK LTD- The current price of UJJIVAN is 52.02 rupees
I am going to buy this stock because of the reasons as follows-
1. It made a 52W high by breaking avery strong resistance and volume is good too.
2. It got a great buying force and moved up by 365% in Mid 2022- Dec 2023 (which shows smart money)
3. It is showing better relative strength as it stood strong in volatile times including last few weeks.
4. The risk and reward is favourable. The good part- The stock is not extended.
5. The stock can do great if it breaks its IPO listing high around 63 rupees.
6. The stock has got a good catalyst and that is- Mutual Funds have increased their stake in this stock. They have gone aggressive in that.
7. Another good part- The sector is looking bullish. Banking sector is getting better.
I am expecting more from this in coming weeks.
I will buy it with minimum target of 45-50% and then will trail after that.
My SL is at 45.3 rupees.
I will be managing my risk.
Nifty Price Action Analysis for Nov 202525-Oct-25:
Nifty broke 25500 resistance with good volume on 15th Oct.
CMP is 25795 as on 24th Oct.
For November series Nifty is likely to take pullback support at 25400-25600 levels then at 25100 levels.
Major uptrend support lies at 24600 levels for another attempt for lifetime high

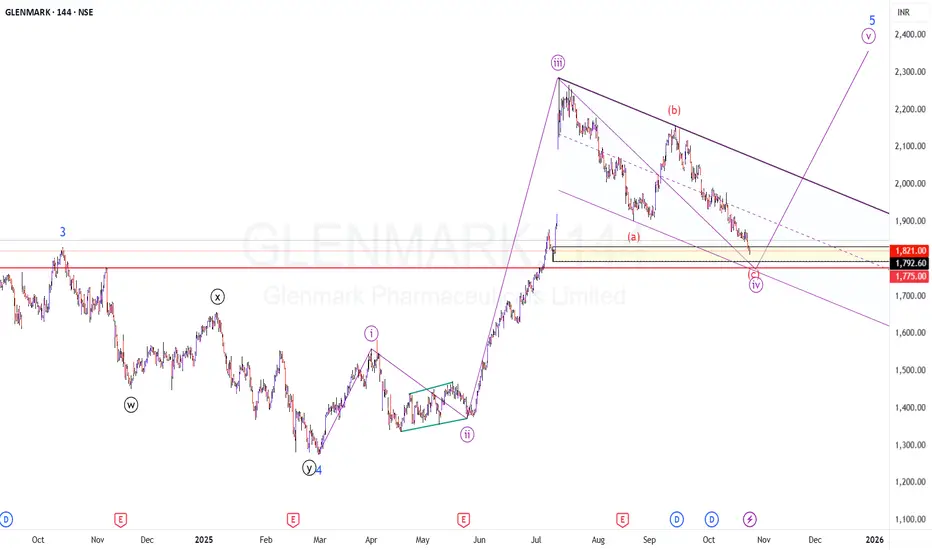
GLENMARK - Time for ATH?CMP: 1821
TFL 144 Minutes
Observation:
The script has been in bullish trend since March 2020 (Covid Lows) and is in the final leg of the impulse structure.
This view is considered from Feb-2025 lows (1275.5) for the 5th wave.
The counts are marked in the chart.
In a nutshell, price is about to complete the 4th wave of the final 5th and the correction is expected to end around 1760-1780 levels.
Reason being,
AB=BC (100% extension of AB leg) target is placed at 1773, which also coincides/confluences with 200 DEMA and the previous demand zone
Please be informed that the price has room to go down till 1585 as well (that's our invalidation level for the 4th wave). Hence, monitoring the price action at the zone of 1760-1780 for a good RR set up.
Counts on Daily TF
Weekly Chart:
Results are due in 7th Nov. If this theses to work out, then, the results should be pretty good though.. Just to act as a trigger
Disclaimer: I am not a SEBI registered Analyst and this is not a trading advise. Views are personal and for educational purpose only. Please consult your Financial Advisor for any investment decisions. Please consider my views only to get a different perspective (FOR or AGAINST your views). Please don't trade FNO based on my views. If you like my analysis and learnt something from it, please give a BOOST. Feel free to express your thoughts and questions in the comments section.
XAUUSDLast day was consolidating and has generated sell side liquidity. There could be possibility the price sweeps that liquidity and then reverse from the Marked Demand zone.
We have Imbalace left in 15M
We have Equal lows. Srong liquidity pool.
Below Eq low we have Demand zone.

Sona BLW Precision Forgings Ltd. - Weekly chart analysis Trend: Stock is in a long-term downtrend (since late 2024).
Recent Action: Strong bullish candle with high volume, challenging/breaking the downtrend line.
Key Levels:
Resistance: Initial resistance near ₹510-₹520.
Support: Immediate support near the trendline (if it holds) and major support around ₹400-₹410.
Outlook: A confirmed weekly close above the trendline and ₹520 is bullish (potential reversal). Failure to hold the break and a pullback would confirm the bearish continuation.
⚠️ Disclaimer : This is a technical summary only for educational purpose and is NOT financial advice. Trading involves high risk. Consult a qualified advisor before investing.

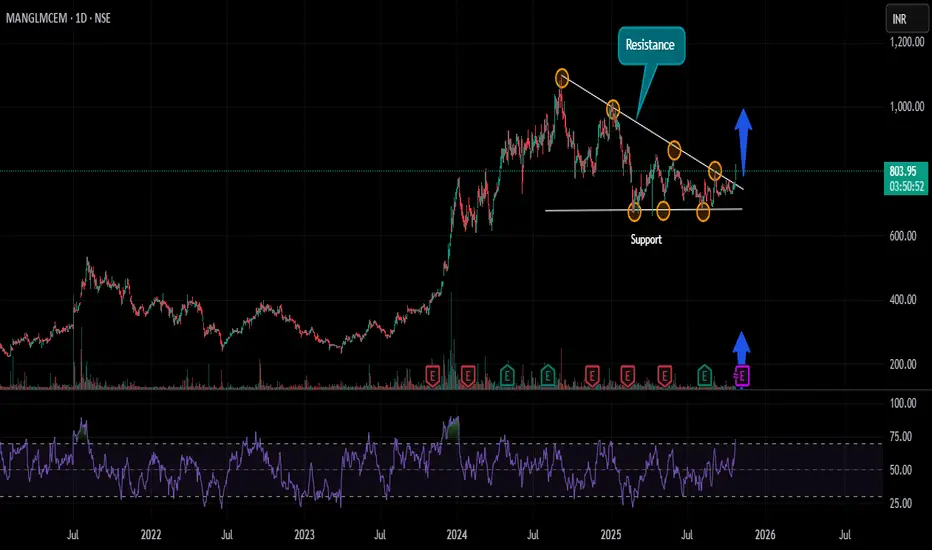
MANGALAM CEMENT : DECENDING TRAINGLE BREAKOUT The stock of Mangalam Cement is consolidating from Sept 2024 , taking support at 680 multiple times with decending traingle formation . On 23 Oct , the stock came out of this consolidation with good volume.
If the stock stays above 760 , move towards 880 and 1000 is possible in near term.
The RSI on daily chart is also above 60 indicating good momentum in the stock.
BUY TODAY SELL TOMORROW for 5% DON’T HAVE TIME TO MANAGE YOUR TRADES?
- Take BTST trades at 3:25 pm every day
- Try to exit by taking 4-7% profit of each trade
- SL can also be maintained as closing below the low of the breakout candle
Now, why do I prefer BTST over swing trades? The primary reason is that I have observed that 90% of the stocks give most of the movement in just 1-2 days and the rest of the time they either consolidate or fall
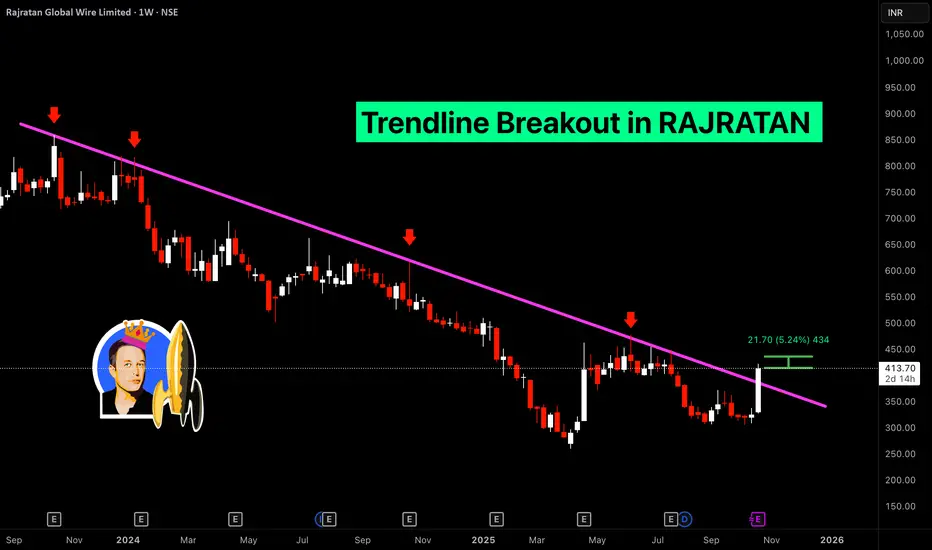
Trendline Breakout in RAJRATAN
BUY TODAY SELL TOMORROW for 5%
Bitcoin – Buying the Trendline, Not the HypeBitcoin (BTCUSD) continues to respect its rising trendline structure , showing consistent demand on every retest. This type of price action often reveals where smart money is quietly adding positions, not chasing, but accumulating near support.
Each of the highlighted points shows how price has respected this trendline multiple times, forming a clean series of higher lows. As long as this level holds, the broader direction remains bullish.
Currently, BTC is testing this key support once again. I’m positioning near the trendline because the risk is clearly defined , and the potential reward toward 111K+ remains wide open.
Short-term volatility can still appear, but structure beats emotions . As long as buyers defend this zone, we may see another impulsive leg forming soon.
Disclaimer: This analysis is for educational purposes only. It’s not investment advice. Always do your own research before trading.

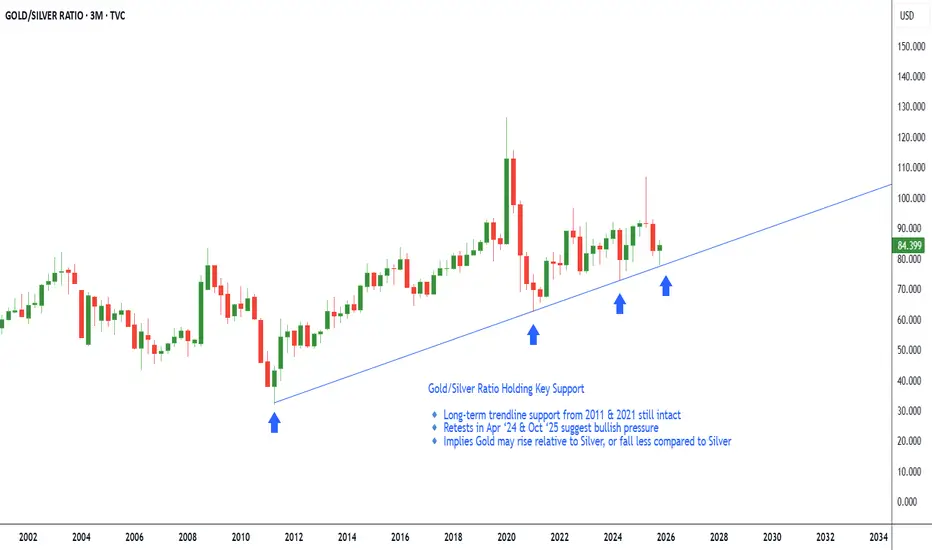
GSR Key Support Retested – Gold May Outperform SilverGold/Silver Ratio – Watching Key Support on Quarterly Chart
Gold/Silver Ratio represents how many ounces of silver are needed to purchase one ounce of gold. It is a classic measure of relative value between the two precious metals.
Generally, a rising ratio means gold is outperforming silver i.e. either rising faster or falling slower.
On the Quarterly chart, when we draw a trendline connecting the lows of April 2011 and January 2021, we see this trendline acting as strong support. The ratio took support in April 2024 and has again retested and held this trendline in October 2025.
This repeated bounce suggests the ratio is respecting this long-term support, which could imply a bullish bias in Gold vs Silver.
Implications:
Gold may outperform silver in coming months. This could be through gold rising faster, or falling less than silver in case of broader market weakness.
Refer Analysis of Silver chart
Elliott Wave Analysis – XAUUSD (October 22, 2025)
🔹 1. Momentum
D1:
The D1 momentum is preparing to turn bullish, signaling the start of a new upward trend.
→ We can expect at least 3–5 consecutive bullish days ahead.
H4:
We need to wait for the H4 candle to close to confirm the reversal signal.
If confirmed, there’s a strong possibility that today will form an intraday uptrend.
H1:
H1 momentum has already turned upward, but it’s now in the overbought zone.
Therefore, the current rise won’t be strong, and a minor pullback is needed to bring momentum back to the oversold area — creating a foundation for a more stable bullish move.
________________________________________
🔹 2. Wave Structure
D1 Timeframe:
Yesterday saw a sharp decline, but D1 momentum is now preparing to reverse upward.
Counting the correction candles, we already have five candles, suggesting that the market may soon enter a new bullish phase lasting 3–5 days or more.
During this recovery phase, we need to monitor two key scenarios:
• If wave movements overlap and lack strength, and when D1 momentum returns to the overbought zone but price fails to break the previous high, then the Wave 4 (yellow) scenario is still in play.
• If price rises sharply and decisively, the recent correction might only be part of Wave 3 (yellow), meaning the bullish trend is continuing.
H4 Timeframe:
Yesterday’s structure was identified as a Flat correction, and it remains valid.
Price has retraced into the Wave 4 zone of the smaller degree structure, reaching the 2.0 Fibonacci extension of Wave A.
If Wave 5 (purple) is now developing, the ideal target would be around 4476.
However, if price rises with overlapping waves, this could instead represent a corrective move within Wave 4 (yellow), targeting the previous high zone between 4381 and 4476.
H1 Timeframe:
Within Wave W, there is a small Flat correction, where Wave C extended to twice the length of Wave A.
Now, Wave Y (blue) has also declined to 2× Wave W, suggesting weakening buying power.
Even so, in the short term, we still expect an intraday bullish move today.
→ The trading bias remains buy-side until H4 momentum reaches the overbought area and reverses.
________________________________________
🔹 3. Trading Plan
Buy Zone: 4101 – 4098
Stop Loss (SL): 4088
Take Profit 1 (TP1): 4190
________________________________________
🔹 4. Notes
Liquidity and resistance zones are already marked on the chart.
→ Wait for price to break and retest those areas to confirm a valid Buy setup.

AdityaBirlaCapital - Investment IdeasAditya Birla Capital Ltd - Technical Analysis
Simple Technical Analysis Summary
Aditya Birla Capital is breaking out from a multi-year resistance zone with a classic and perfect rounding bottom pattern playing out on the monthly timeframe.
Fibonacci targets have been activated!
Key Technical Observations
1. Multi-Year Rounding Bottom Pattern
The stock has completed a textbook rounding bottom formation spanning multiple years. This is one of the most reliable bullish reversal patterns in technical analysis, indicating a fundamental shift from bearish to bullish sentiment.
2. Breakout from Multi-Year Resistance
After years of consolidation and base building, the stock has successfully broken out from a significant resistance zone around ₹255. This breakout signals the potential beginning of a new uptrend cycle.
3. Monthly Timeframe Confirmation
The pattern is forming and confirming on the monthly timeframe, which carries significantly more weight than shorter timeframes. Monthly breakouts tend to lead to sustained moves.
4. Fibonacci Extension Framework
Multiple Fibonacci extension levels have been identified and activated, providing a clear roadmap for potential price targets based on the measured move from the rounding bottom pattern.
#Fibonacci Extension Target Levels
Based on the rounding bottom pattern measurement and Fibonacci extensions:
- Target 1: 314.20 (1.272 Fibonacci Extension)
- Target 2: 345.10 (1.414 Fibonacci Extension)
- Target 3: 389.90 (1.618 Fibonacci Extension)
- Extended Target: 472.00 (2.0 Fibonacci Extension)
Key Support Levels
- Immediate Support: 255.00 (Breakout level / Previous resistance turned support)
- Secondary Support: 171.86 (0.618 Fibonacci retracement)
- Critical Support: 146.17 (0.5 Fibonacci retracement)
- Base Support: 42.35 (Rounding bottom base)
- Pattern suggests long-term bullish structure - Risk-reward favorable for position building on dips
Risk Management:
- Maintain stoploss below 255 on monthly closing basis
- For aggressive traders: 240 (allowing some wiggle room)
- For conservative traders: 235 (below breakout zone)
Invalidation Level:
- Monthly close below 240 would weaken the bullish structure
- Break below 220 would invalidate the immediate bullish setup
DISCLOSURE & RISK WARNING:
This analysis is provided for educational and informational purposes only and should not be construed as financial advice, investment recommendation, or an offer to buy or sell securities. Past performance is not indicative of future results.

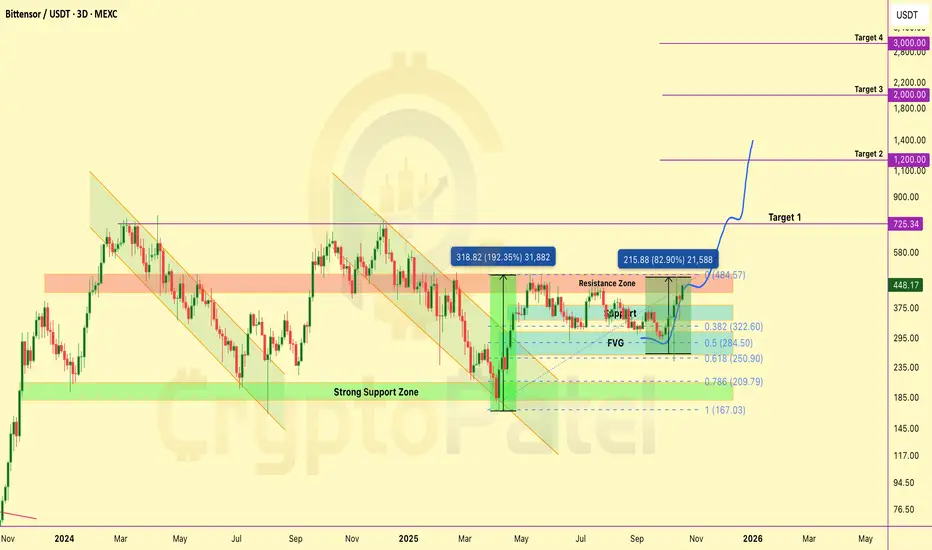
$TAO: +80% IN 14 DAYS - INSTITUTIONAL ACCUMULATION PLAYGETTEX:TAO : +80% IN 14 DAYS - INSTITUTIONAL ACCUMULATION PLAY
Performance Update:
Entry execution: +80% unrealized gains
Institutional bid confirmed (Grayscale allocation)
Position Framework:
Entry Zones:
Primary: $180-$200 ✅
Secondary: $250-$300 ✅
Profit Targets: → $750 → $1,200 → $2,000 (6.6x → $3,000 (10x)
Technical Structure:
▶️ Chart formation: Bullish continuation pattern
▶️ Dip behavior: 30-40% retracements absorbed by institutional buying
▶️ Capital flow: Grayscale strategic allocation confirms smart money positioning
Long-term Thesis:
▶️ Every correction = accumulation opportunity
▶️ Strong hands buying weakness = supply compression
▶️ Institutional backing + technical strength = asymmetric upside
Volatility is the entry mechanism, not the exit signal.
NFA & DYOR
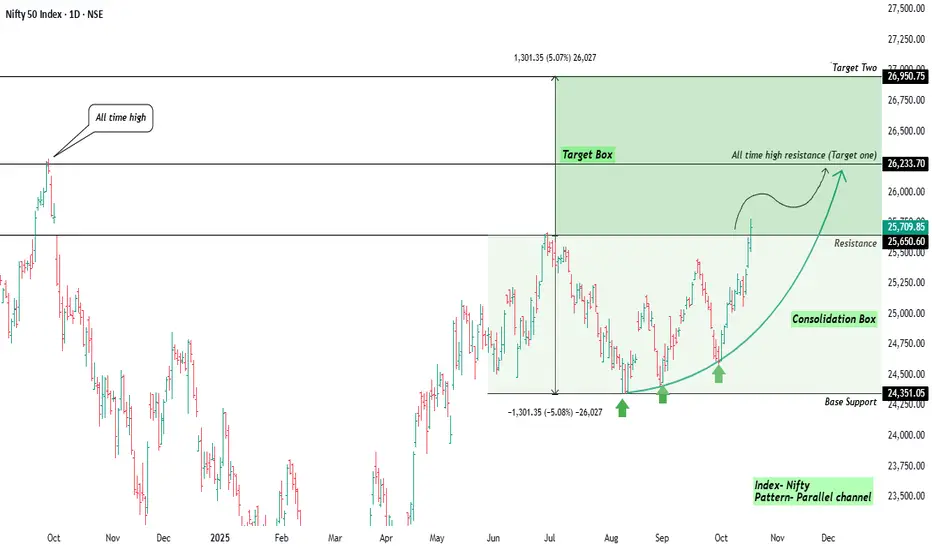
Nifty From Consolidation to Momentum🪔Wishing everyone in the TradingView community a prosperous and bright Diwali 🎇
May this festival bring you clarity like a clean chart, and profits that trend higher with discipline and peace of mind.
Description / Post Body (Technical Analysis View)-:
After a few months of sideways movement, Nifty has finally shaped up into a strong parallel channel pattern.
The index built a solid base near 24,350, where price found repeated buying interest forming the foundation of the current up-leg.
The latest breakout above the 25,650 resistance zone now opens a clean path toward the All Time High resistance (around 26,233) which is marked as Target One.
If momentum sustains, the measured move symmetry projects a possible extension toward 26,950 shown as Target Two / Target Box.
The price structure is supported by higher lows, showing renewed strength and confidence from buyers. The curved projection hints that the market might pause slightly near the previous top before any decisive breakout.
This view focuses on chart behaviour and structure, not short-term trading signals — it’s more about understanding how market psychology unfolds through patterns.
Key Observations-:
Pattern: Parallel Channel Breakout
Base Support: ~24,350
Immediate Resistance (Broken): ~25,650
All-Time High / Target 1: ~26,233
Target 2 Zone: 26,950 ±50
Bias: Positive while above 25,000
Regards Amit, Happy Diwali!
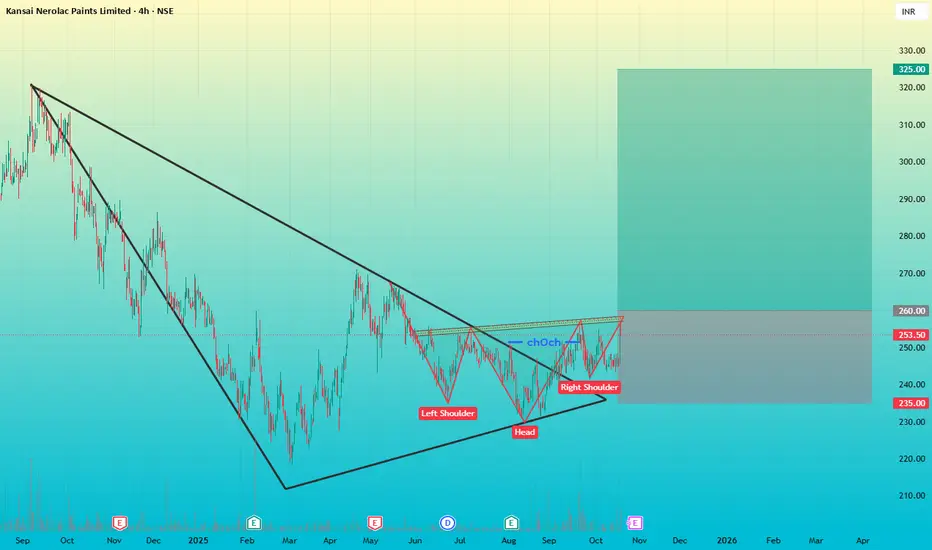
Kansai Nerolac – Triangle + Inverse H&S | Bullish Move loadingKansai Nerolac Paints – Symmetrical Triangle + Inverse Head & Shoulders Breakout Setup
Timeframe: 4H
Trend: Bullish Reversal in Progress
Price has been consolidating for months within a symmetrical triangle structure.
Inside the triangle, an Inverse Head & Shoulders pattern has formed — a classic bullish reversal signal.
A clear Change of Character (ChoCh) indicates a shift from bearish to bullish market structure.
A breakout above the upper trendline could confirm the start of a new uptrend phase.
Trade Plan:
Entry: Above breakout zone (₹260)
Stop Loss: Below ₹235
Target: ₹325 350
Risk to Reward: Around 1:3
A confirmed breakout from this triangle + reversal structure may trigger a strong rally. Watch for sustained volume above resistance for confirmation.
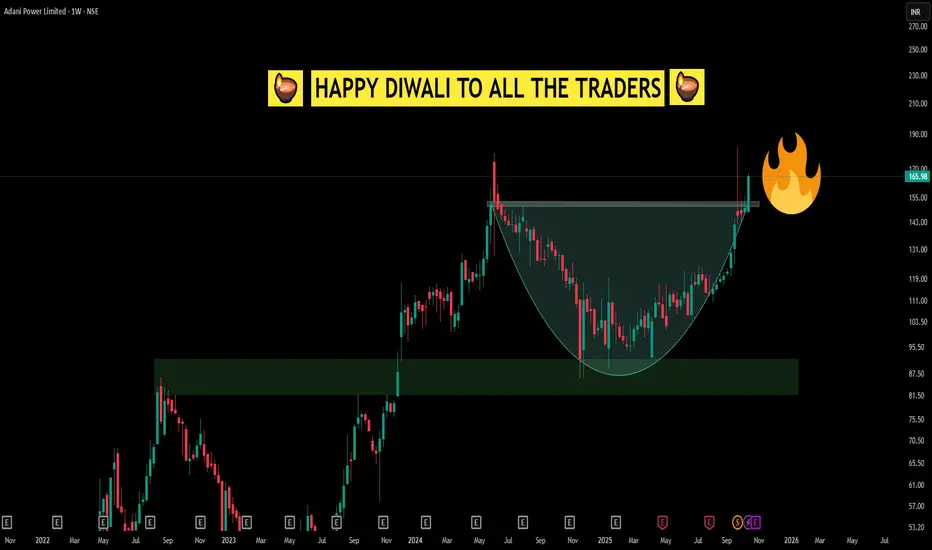
Simple CUP Pattern looking like a Diwali Diya Happy Diwali to All Traders!
This Diwali, the chart tells a special story—a classic cup breakout, but look closely and you'll notice it also resembles a beautifully lit diya. Just like Diwali celebrates the light conquering darkness, this breakout is a reminder of the power of patience, conviction, and disciplined observation in trading.
The cup pattern, much like the diya, signifies a period of accumulation, resilience, and hope before an illuminating breakout. As traders, we learn that enduring through the consolidation (the “darkness”) allows us to witness the rewarding move (the “light”) when the right moment comes.
May this Diwali fill your life and trading journey with wisdom, clarity, and prosperity. Wishing everyone strong breakouts, bright candles, and the perseverance to hold your lamp high, both in the markets and in life.
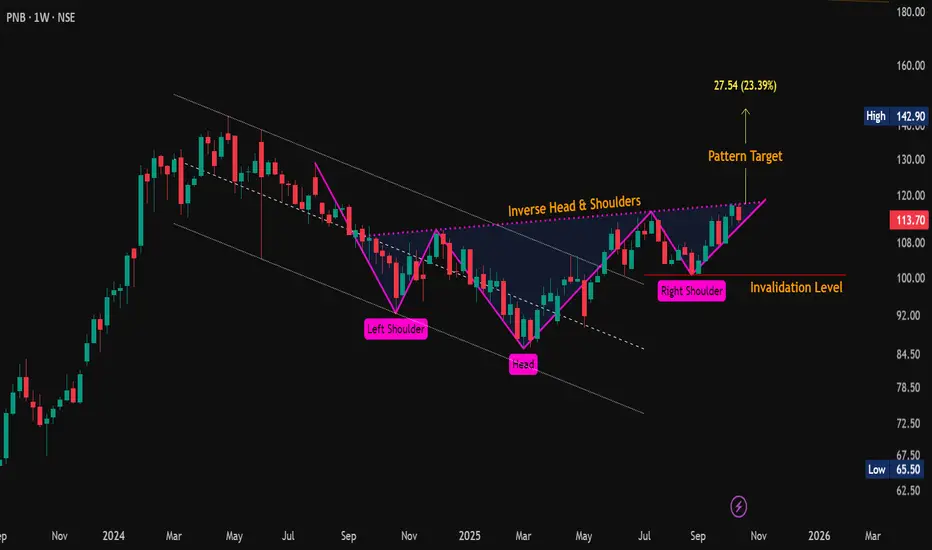
#PNB | Inverse Head & Shoulders Bullish SetupCMP: 113.70
🔼 Key Resistance Levels: 118 / 120 / 143
🔽 Key Support Levels: 113.30 - 110.50 / 107.30
❌ Invalidation Level: 100.60 (Weekly Close Below)
✴️ Breakout Point: Weekly close above the neckline (Pink dotted line) 👀
🎯 Pattern Target: 145 (+27% from CMP)
#PNB | #InverseHeadAndShoulders | #ChartPatterns | #PriceAction | #SwingTrading
📌 Disclaimer: This analysis is shared for educational purposes only. It is not a buy/sell recommendation. Please do your own research before making any trading decisions.
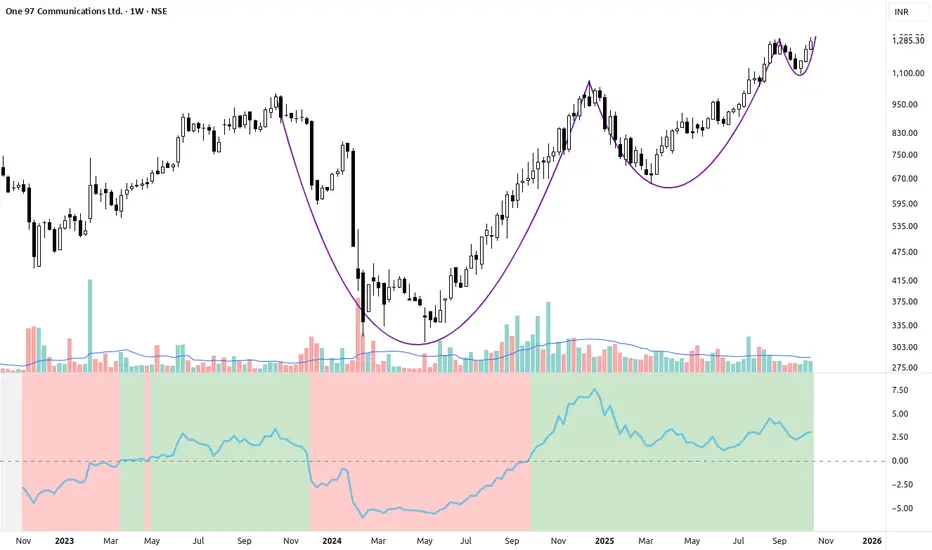
PAYTM (ONE97) - Power Consolidation at 52-Week HighsThe Setup: Major Base Breakout in Progress
ONE97 has transformed from a long-term downtrend into a powerful uptrend. The chart shows a massive multi-year base (a large rounded bottom) that is now being successfully broken out of. This transition signals a potential paradigm shift in the stock's long-term structure.
The final leg of this base is crucial:
The stock has powered past multiple resistance levels and is now consolidating right at its 52-week high and the major pivot near ₹1,285.
The recent tightness just below the "Weak High" at ₹1,385 is the final stage of supply absorption, reminiscent of the low-volatility area of a VCP.
Key Technical Confirmation
Trading Above All MAs: As you noted, the price is trading above all key moving averages, which are stacked in a bullish order. This confirms the dominance of the long-term uptrend.
Strong Relative Strength: The Relative Strength line (bottom indicator) shows exceptional strength, confirming that $ONE97 is significantly outperforming the Nifty. This is a leading stock.
Volume Signature: Volume has been consistently strong on the upward thrusts and has quieted down during this final consolidation phase, indicating that sellers have stepped aside, clearing the path for the next move.
The Trade Plan
Entry Signal: A decisive weekly close above the 52-week high/major pivot zone (above ₹1,300) is the entry signal. The high-conviction move is a break above ₹1,385 on huge volume.
Stop Loss (Risk Management): A clear, objective stop loss should be placed below the low of the current tight consolidation pocket, for example, around ₹1,100. This also corresponds to the recent support cluster.
Target Expectation: Given the magnitude of the multi-year base, the breakout is likely to lead to a significant, sustained trend. The expectation is for a powerful run into new All-Time Highs.
Potential Risks & Cautionary Notes
Failure at Major Pivot: The stock must hold the ₹1,200 level on any minor pullback. A failure to move past ₹1,385 with conviction, followed by a break below ₹1,100, would suggest a failed pattern.
Whipsaw Risk: Trading near all-time highs and major pivots can lead to "whipsaws." Do not chase an intraday spike; wait for a confirmed daily or weekly close to validate the breakout.
Regulatory/News Risk: As a fintech stock, the price can be highly sensitive to regulatory announcements, policy changes, or unexpected news about its business model or partnerships.
#Disclaimer: This is for educational and observation purposes only and is not financial advice. Trade at your own risk.