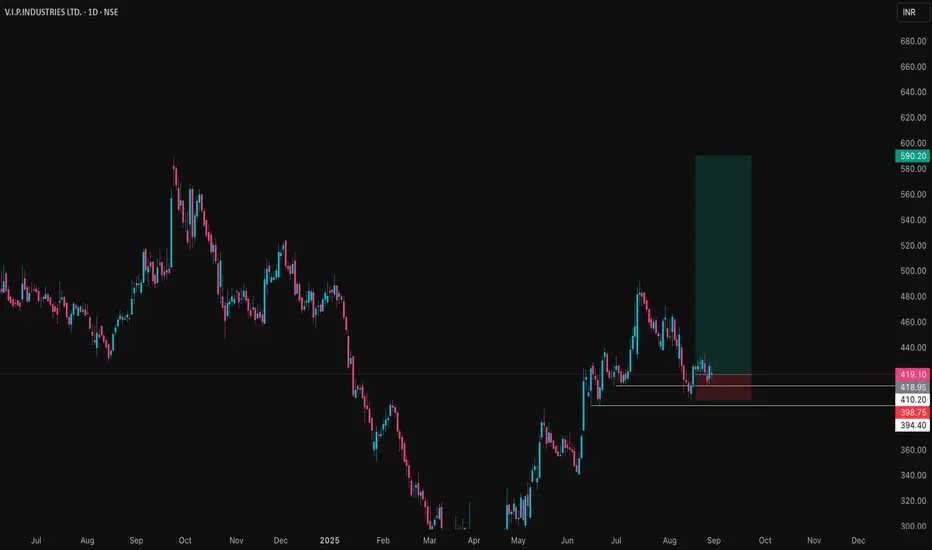
VIPIND Price ActionVIP Industries is trading around ₹420 at the end of August 2025, showing relative stability despite recent operational headwinds. The company reported a decline in both revenue and profitability for the June quarter, with net sales falling to approximately ₹561 crore and a posted net loss of about ₹13 crore. This downturn was influenced by weaker demand, one-off costs, and significant de-growth in certain sales channels, though management indicated structural efforts and cost controls limited the impact on margins.
The stock’s price-to-book ratio remains elevated at over 9, and the company is not currently paying dividends, focusing resources on supporting its brand and operations. Despite these challenges, VIP Industries continues to maintain a strong brand presence and an extensive market reach in the luggage segment. Its market capitalization stands near ₹6,000 crore, and the stock is trading at about 9.2 times book value, reflecting modest investor optimism about a potential business recovery.
Technically, the share price is consolidating well above the yearly low but remains below the 52-week high, with trading volumes indicating ongoing investor interest. Near-term performance will depend on management’s success in reviving e-commerce channels, sustaining cost discipline, and capitalizing on a potential pickup in travel-related demand. The company’s medium-term outlook remains cautious but could improve if growth resumes and operating performance stabilizes.
Community ideas
Garuda Construction – Cup & Handle Breakout | Swing Trade PlanGaruda Construction has given a textbook Cup & Handle breakout backed by strong volume and solid fundamentals.
Technical Analysis
A Cup & Handle pattern has formed with a neckline breakout above ₹200.
Stock closed strongly at ₹216.33 (+9.66%) with massive volume (7.5M vs 3.1M avg) - confirms institutional buying.
Price is trading above 20 EMA (₹200) and 50 EMA (₹188) → strong uptrend.
Weekly timeframe also shows a fresh breakout, adding higher timeframe confluence.
Structure remains bullish as long as it holds above ₹200 demand zone.
Fundamental key area
Construction & Engineering segment seeing strong order inflows, aiding medium-term growth. Strong QoQ Growth: Latest quarter (Jun-25) revenue jumped 55% to ₹125 Cr.
ROE ~29%, OPM ~29% → excellent efficiency.
Balance Sheet: Debt levels appear very low, improving stability.
Valuation: Mid-cap with growth momentum, attractive vs large-cap peers.
Swing Trade Plan
Entry Zone: ₹212–216
Stop Loss: ₹198 (below neckline + demand zone)
Targets:
T1: ₹225 (early booking)
T2: ₹240 (swing continuation)
T3: ₹260 (Cup & Handle measured move)
Risk–Reward: Up to 1:2.4
Note: This is an educational swing trade analysis based on price action + fundamentals. Not financial advice — do your own due diligence before trading.

Support and Resistance Concept- Bank NiftyThis article concentrates on Support and resistance concept from investment perspective with Bank Nifty monthly chart example.
Let us first understand a few things:
⚪ In simple terms, a resistance is a level from where price rejects significantly because sellers dominated buyers. Contrastingly, support is a level from where price bounces significantly because buyers dominated sellers.
⚪ Secondly, when price breaks out of resistance, it usually pulls back, and the same resistance zone starts acting as support. The opposite is true for support, once broken it starts acting as resistance as the price pulls back into it. This happens due to several reasons of demand and supply and trader psychology which I am not going to discuss here, may be later in some other article.
Keeping in mind these two simple basic concepts, let’s discuss Bank Nifty chart.
➞ Price creates a significant resistance in Jan 15. It took two years for the market to break out of this resistance again. Now we assume that when the price will pull back to this level in future, it will act as support- the role reversal. So, price creates another significant resistance in Dec 19 and fall sharply to Jan 15 highs in Mar 20. The price was held at this level offering a juicy investment opportunity.
➞ Now we have Dec 19 highs as significant resistance and we assume that when the price breaks out of this level and pulls back, that level will act as support. Price creates another significant level in Oct 21 and retraces back to Dec 19 highs and took support to resume higher.
➞ Same behavior can be seen in Mar 23, Oct 23, Jan 24 and Jan 25 retests of previous resistance zones.
⚪ We can infer from this behavior that the trend resumes higher and market creates a new high each time the price tests previous resistance.
⚪ Also, the trend continues as long as the previous support level (swing low) is not broken.
➞ In this backdrop, as the market is pulling back and approaching a previous resistance level (53000 or so), we can assume that it may again act as support and the market resumes higher after a successful retest.
⚪ However, we should never ever go for blind buys and wait for the buyers to actually show up on lower timeframes like weekly or daily charts. Its best to patiently wait and then react rather than pulling the trigger in hope.
⚪ Fyi, I have drawn the horizontal support and resistance lines from the highest closes of the swing highs (and not from the wick tops). My experience with support and resistance says that this is a more reliable way to play with support and resistance.
I hope you learnt something from this analysis.
Do boost and comment to encourage for more writeups in coming days.

Liquidity Grab Completed – Bulls Back in Control?Liquidity Grab Completed – Bulls Back in Control?
Key Technical Insights:
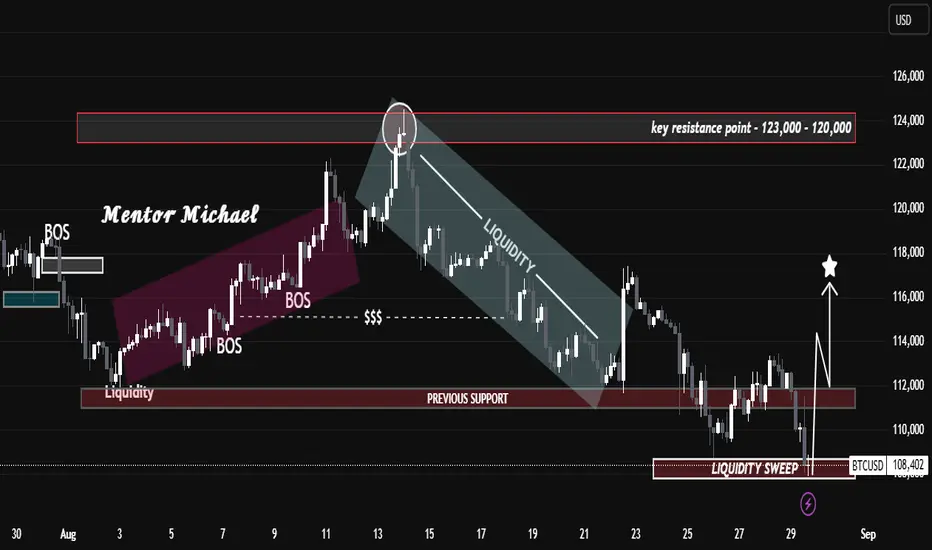
Resistance Rejection: Price sharply rejected the 120K – 123K resistance zone, confirming this area as a key supply level.
Bearish Liquidity Flow: After rejection, BTC flowed within a descending liquidity channel, continuously taking out internal supports before finding a base.
Previous Support → Liquidity Sweep: Around 108K, price executed a strong liquidity sweep, triggering stop hunts below prior support, then showing a bullish reaction.
Market Structure Shift Incoming: The sweep suggests a potential accumulation phase, where institutions collect orders before pushing price higher.
Upside Targets: If price holds above the reclaimed support at 112K, bullish momentum could aim for 116K – 118K in the near term ⭐.
⚠️ Risk Consideration: A failure to sustain above 108K would invalidate the bullish outlook, opening room for deeper downside.
📌 Summary:
BTCUSD is transitioning from a liquidity-driven decline into a possible reversal phase. The liquidity sweep at 108K could mark the start of a bullish leg if structure confirms with higher highs. Traders should monitor 112K as the short-term pivot point.
ENDURANCE TECH LOOKS GREATThe stock has been forming an cup and handle pattern lately.
It has a good consolidation of more than one year , the fundamentals are flourishing as well making it a perfect pick for a quick gains
The 2987 level acts as a crucial resistance for the stock , upon breaching that the stock can give more than 40% returns

hindalco bearish biashindalco on daily frame is on a major resistance level and has also reacted postively to the resistance by rejecting upward movemnt.
hindalco also made a double top pattern on 4hours timeframe
hindalco news is postive but not reacted much , i would suggest wait and watch this any further downaward price movemnt, you can go for short

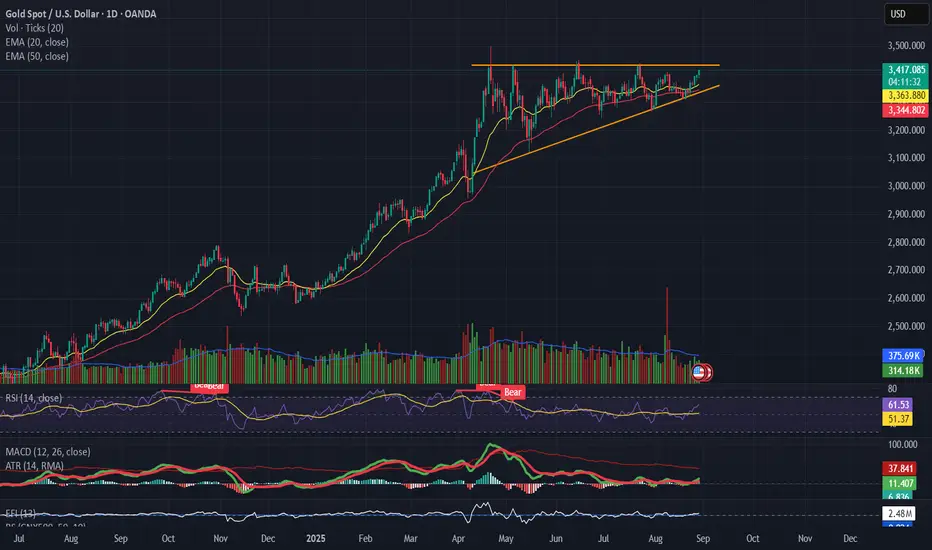
GOLD(XAUUSD) Forming a pennant / ascending triangle 📌 Gold (XAUUSD)
Forming a pennant / ascending triangle with strong resistance near $3,390 – 3,400.
Volume is declining, suggesting indecision.
RSI holding above 50 but not powering higher → momentum is slowing.
MACD flatlining, no fresh bullish impulse yet.
👉 Breakout above $3,400 needed for continuation. Breakdown below $3,340 risks correction.
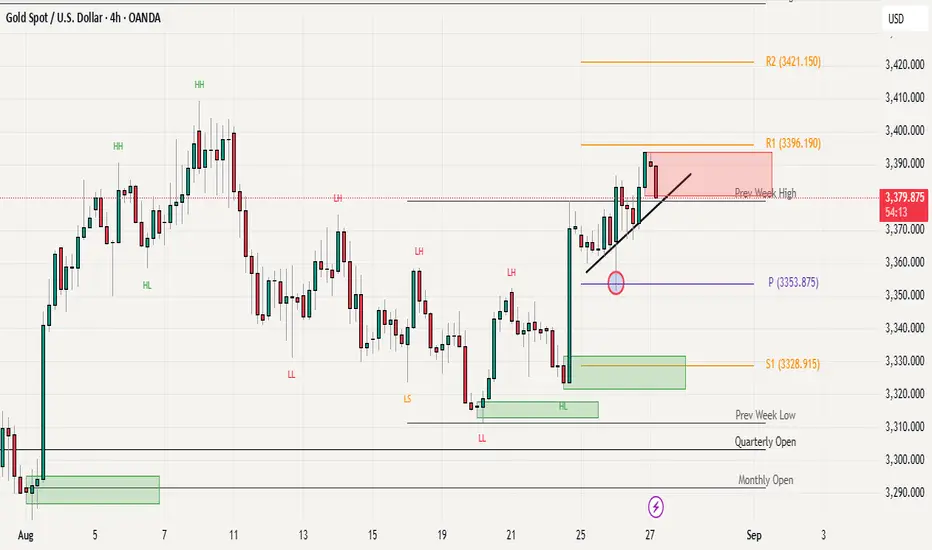
Weekly High Turns Support: Can Gold Push Higher?We have seen a good momentum / continuation since Friday’s sharp rally and is now holding firm above the previous week’s high at 3378, turning it into immediate support. The weekly pivot at 3353 adds another solid support layer below, while the rising trendline support is keeping the bullish structure intact. As long as these levels hold, buyers seem in control, and the price action suggests that bulls are not ready to give up recent gains.
On the upside, the next hurdle is around the 3400–3410 zone, which could act as near-term resistance. For sellers, any breakdown below the pivot (3353) would be a high-probability setup for downside pressure, while a break below the trendline would be a lower-probability but still valid bearish signal. Until then, the path of least resistance remains tilted to the upside with steady bullish momentum.
Elliott Wave Analysis – XAUUSD 27/08/2025
Momentum
• D1 timeframe: Momentum is showing reversal signals, as mentioned in yesterday’s plan. Currently, D1 is in the overbought zone, suggesting that bullish momentum has weakened and the market needs at least one corrective move to regain strength.
• H4 timeframe: Momentum is turning bearish. We need to wait for the current candle to close for confirmation, but there is a high probability that today’s main trend will be bearish.
• H1 timeframe: Momentum is in the oversold zone and preparing to turn up. If price rises into the overbought zone, then reverses bearish without breaking above 3394, there is a strong chance of a long-term decline – creating a sell opportunity.
________________________________________
Wave Structure
• D1 timeframe: With current reversal signals, there are two possible scenarios:
1. Triangle abcde – as shown in previous plans.
2. Combination correction (WXY) – where wave W is a zigzag, wave X is a double zigzag, and wave Y is a triangle (as on the chart). In this case, price may decline back toward 3311.
👉 Both scenarios are valid, with no clear dominance, so continued observation is required.
• H4 timeframe: A diagonal ending triangle is forming, combined with H4 momentum turning bearish. Although we need confirmation from the current H4 close, it is clear that bullish momentum is weakening → we should look for sell opportunities in line with H4 momentum.
• H1 timeframe: According to yesterday’s plan, we expected wave 3. However, several factors suggest otherwise:
o Price corrected deeply toward 3350.
o The rebound lacked strong momentum.
o An ending diagonal triangle appeared (not typical in wave 3, as it reflects very weak buying pressure).
o RSI shows bearish divergence, further confirming weakening bullish momentum.
Altogether, these point to a likely strong and sharp decline once the pattern completes.
📌 Ideal target zone: 3387 – 3390. If the current drop is wave A or wave 1, then the rebound of wave B or wave 2 should unfold within this zone.
________________________________________
Trading Plan
• Sell Zone: 3387 – 3390
• Stop Loss: 3397
• Take Profit:
o TP1: 3371
o TP2: 3350
o TP3: 3330

NG : A FALLING WEDGE BREAKOUT WITH 1:7.5 RR• NG was in downtrend and in a falling wedge for last 2 months
• Today It successfully retest the upper trend line of the wedge and confirming the BO
• A trade with 1:7.5 RR
• SL and the T1 and T2 mentioned in chart.
• Educational purpose only. Happy trading.

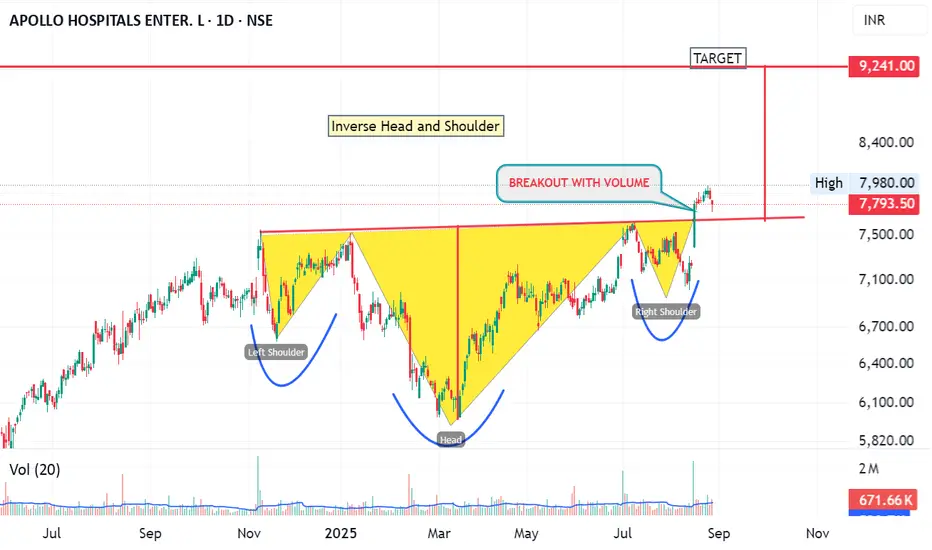
Inverse Head And Shoulder in Apollo HospitalsInverse Head and Shoulder pattern has been formed in Apollo Hospitals with a good volume breakout.Target is around 9241 appr.. With stoploss near 7000 levels. lets see how it unfolds. Good luck and All the best. Ty. JMK
Bullish Engulfing Pattern: Spotting Reversals with Discipline🔎 Intro / Overview
Managing risk is just as important as finding an entry. The Bullish Engulfing is one of the most effective candlestick patterns to identify potential reversals. When traded with discipline, it signals a shift from seller pressure to buyer control, helping traders time their entries with confidence.
📔 Concept
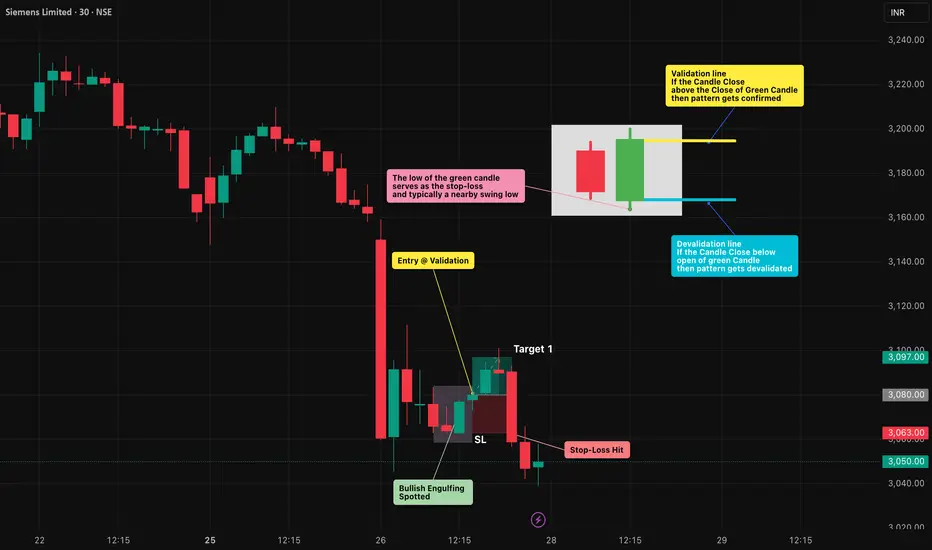
A Bullish Engulfing occurs when:
The first candle is a small red candle that continues the downtrend.
The next candle is a large green candle whose body completely engulfs the red candle’s body .
👉 This shows a clear psychological shift — sellers push lower (red candle), but buyers step in strongly (green candle) and reclaim control.
📌 How to Use
✅ Validation → The candle must close above the close of the green candle.
❌ Invalidation → If price closes below the open of the green candle before confirmation.
Trading Plan:
Entry → After confirmation of the green candle’s close.
Stop-Loss (SL) → Below the low of the green candle.
Take-Profit (TP) :
Conservative → 1R (Entry → SL distance)
Moderate → 2R
Aggressive → Book partial at 1R and trail the rest using tools like ATR, Fibonacci levels, or structure-based stops to ride any extended upside move.
📊 Chart Explanation
On the chart, the first small red candle shows sellers continuing the downtrend. The next large green candle completely engulfs the red candle’s body and closes higher — signaling that buyers have taken control.
The pattern was validated at the close of the green candle , where the long entry was taken. The low of the green candle is used as the stop-loss level, while the targets are mirrored in reverse using the same distance.
In this example, Stop-loss was quickly achieved . From there, traders can apply trailing stop methods to lock in profits and manage further upside targets.
👀 Observation
Most effective at support zones or after a prolonged downtrend .
A high-volume green candle adds conviction to the signal.
In sideways/choppy markets , it can produce false signals — always filter with structure and indicators.
❗ Why It Matters?
The red candle shows seller pressure .
The green candle shows buyer strength .
This clear shift in control creates a rule-based setup with defined entry, SL, and TP.
🎯 Conclusion
The Bullish Engulfing is a strong sign of reversal — but only when combined with structure, confirmation, and disciplined risk management.
🔥 Patterns don’t predict. Rules protect.
⚠️ Disclaimer
For educational purposes only · Not SEBI registered · Not a buy/sell recommendation · No investment advice — purely a learning resource
BITCON - At SupportSharing my analysis of the Bitcoin perpetual futures daily chart. We are currently seeing Bitcoin testing a strong support zone around $108,000 to $110,500. This area has shown buying interest, with price dipping slightly below but quickly rebounding, indicating demand strength.
The recent sharp decline started after hitting a major resistance zone near $123,500 to $125,000, where sellers took control and pushed prices down.
Volume has increased during this downtrend, signaling active participation and confirming the selling pressure. However, the support level is holding for now, with a small bullish candle forming, which could imply a potential short-term bounce.
Traders should watch this support closely—if it holds with increased volume, it may lead to a recovery. A break below, especially on high volume, could signal further downside.
Stay cautious and trade smart!

INFOSYS: A stock to consider adding to your portfolioHello,
Infosys Limited (NSE: INFY, NYSE: INFY) has long been one of the crown jewels of India’s IT sector. Founded in 1981, the company has grown into a global leader in consulting, technology, and outsourcing services. Today, Infosys is not only a key player in India’s digital transformation but also a significant competitor on the global stage against names like Accenture, IBM, and Capgemini. Infosys offers a broad suite of services—ranging from application development, engineering, and cloud solutions to its flagship banking platform, Finacle. Its operations are diversified across industries:
• Financial Services & Insurance
• Manufacturing & Hi-Tech
• Energy, Utilities & Communication
• Retail, Consumer & Logistics
• Life Sciences & Healthcare
The competition is intense. Infosys battles with domestic rivals like TCS, Wipro, HCL Tech, LTIMindtree, and globally with Accenture, Cognizant, IBM, and Capgemini. Still, Infosys has carved out a strong position thanks to its cost efficiency, high-quality talent pool, and scalable digital solutions.
One thing investors love about Infosys is consistency. Over the last 10 years, revenue has climbed from ₹501.33B in 2013 to ₹1.63T in 2024. That’s more than 3x growth in just a decade. Even in the last financial year, despite global tech spending slowdown, revenues still grew +6% YoY.
Net Income tells a similar story. In 2013, the company earned ₹106.56B, but by 2024 that figure swelled to ₹267.13B. Net margins have stayed healthy, averaging ~16% over the last three years. Return metrics are impressive too:
• ROA: 18.57%
• ROE: 30.63%
Infosys runs a very clean balance sheet. Assets stood at ₹1.38T in 2024 against a very manageable ₹83.59B in debt. That low leverage gives the company flexibility to weather downturns and invest in growth.
Cash is king, and Infosys has plenty of it. Free cash flow has grown from ₹94.56B in 2013 to ₹354.97B in 2024. This allows the company to fund innovation, buy back shares, and keep rewarding investors through dividends.
Infosys is set to release its next earnings report on October 16th, 2025, with analysts expecting an EPS of ₹17.47. This could be a key event to watch for short-term volatility.
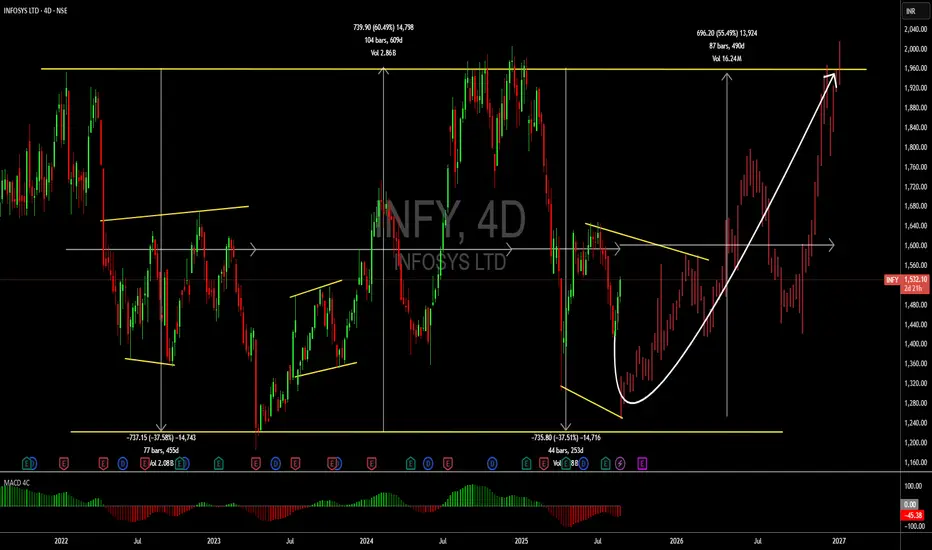
From a technical perspective the stock has been on a sideways move since 2022 and is currently trading at the bottom of the flat channel. We see this as a perfect time for investors to join into the upward move as the current valuations present a perfect entry opportunity. We see INR 1960 as a short term achieve.
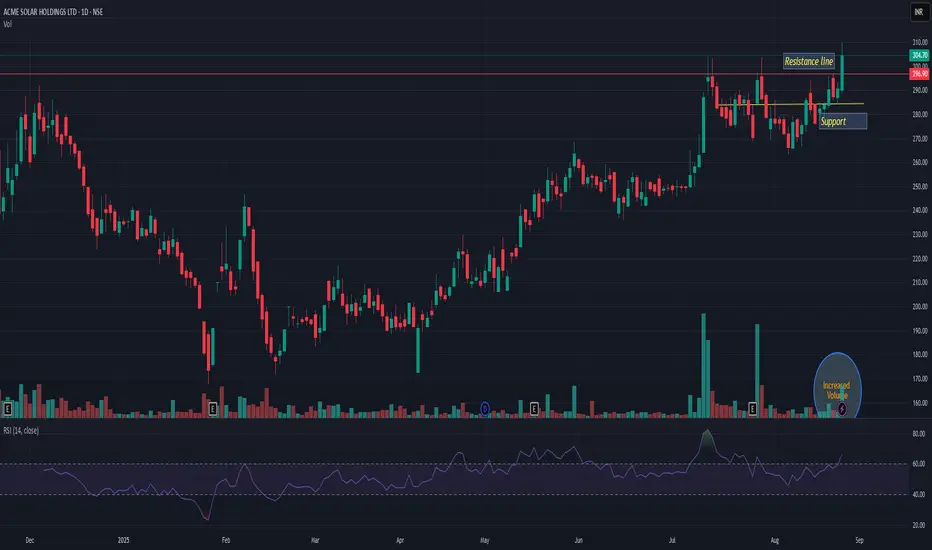
ACMESOLARACMESOLAR giving resistance breakout with decent volume. Support is near 280. Seems like this may take a new ride; trading at ATH. Very high probability that it can add up 12-15% from current level. Its very good risk-reward trade. Keep in yr watchlist
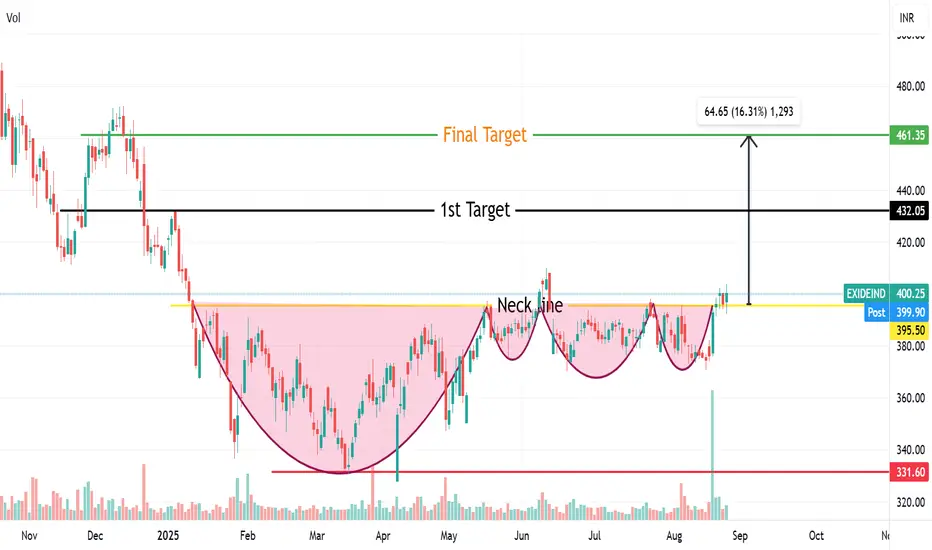
Complex Cup & Handle pattern breakout in Exide Exide given breakout of Complex Cup & handle Pattern from neckline of 400 level .Final target of it will be 460 level & Near term target will be 430 level with a stoploss of 360 Rs.
its not a buy or sell call ..just for education
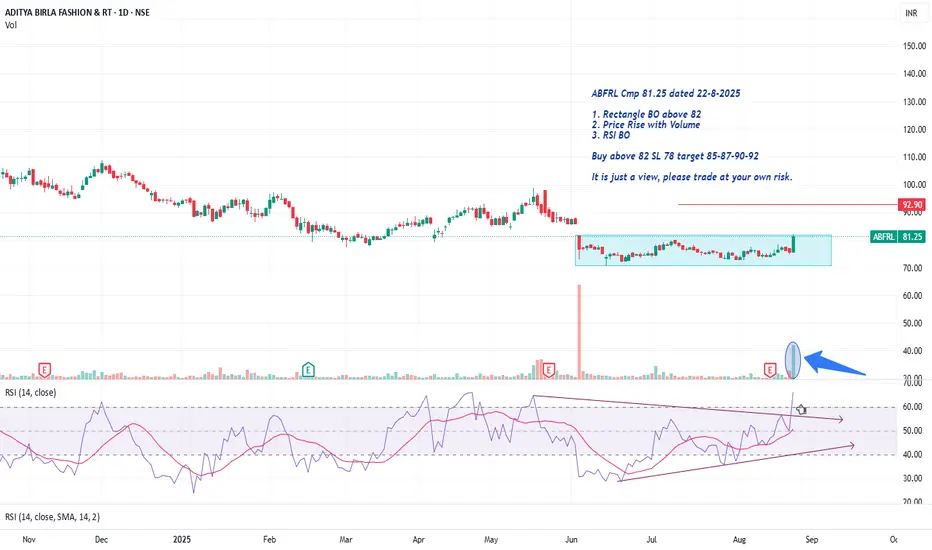
ABFRL Cmp 81.25 Price Rise with VolumeABFRL Cmp 81.25 dated 22-8-2025
1. Rectangle BO above 82
2. Price Rise with Volume
3. RSI BO
Buy above 82 SL 78 target 85-87-90-92
It is just a view, please trade at your own risk.
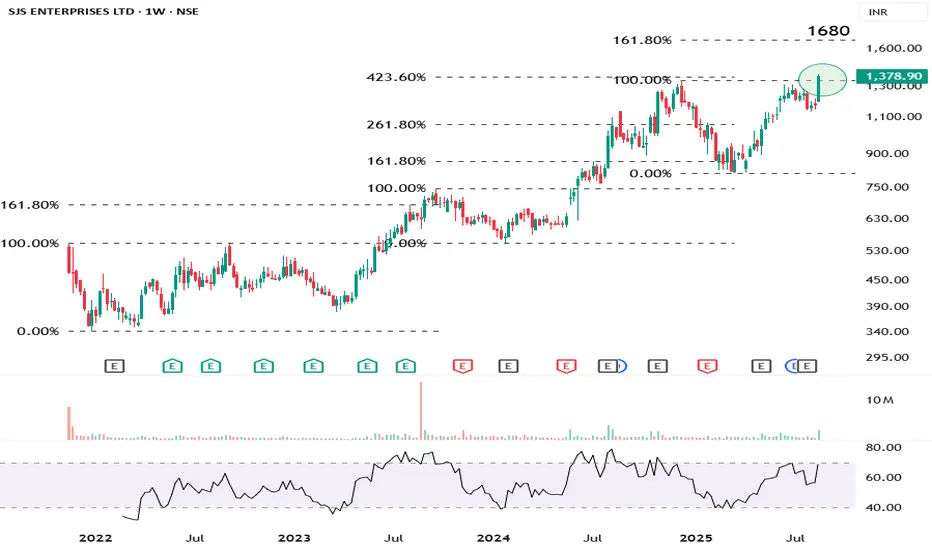
SJS
Prices have cleared its previous all time high of 1347.
In the past, the stock goes on to at-least test the 161.8% FR after a breakout above its previous all time high.
Hence, a minimum test of 1680 is expected in the near term.
Sustaining above 1300 would keep bullishness intact.
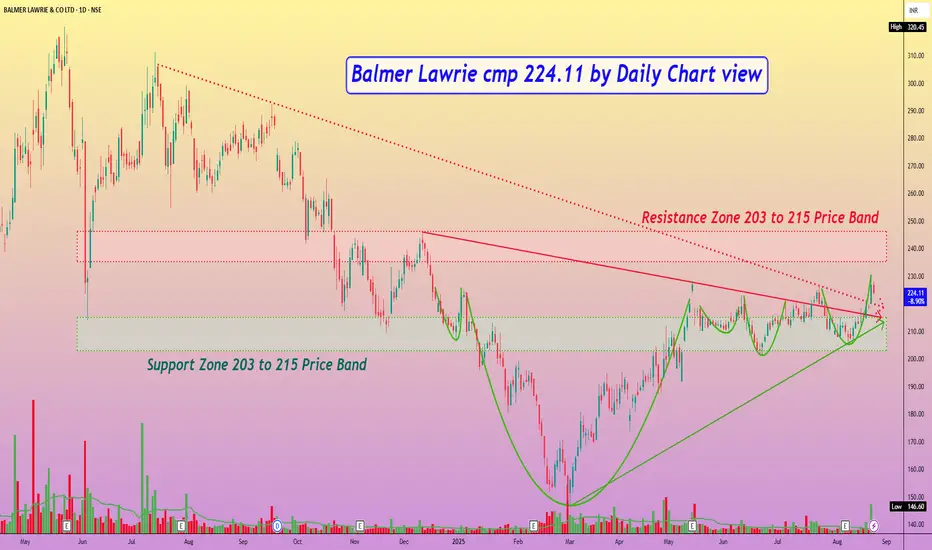
Balmer Lawrie cmp 224.11 by Daily Chart viewBalmer Lawrie cmp 224.11 by Daily Chart view
- Support Zone 203 to 215 Price Band
- Resistance Zone 203 to 215 Price Band
- Multiple Bullish Rounding Bottoms around Support Zone
- Both Falling Resistance Trendlines Breakout seems sustained
- Heavy Volumes surge on Friday post close sync with avg traded qty
- Upwards Price momentum has well respected the Rising Support Trendline
- [ b]*Inside Bar made on Friday closure, indicates observing caution either a Breakout or Breakdown*
Breakout soon in Supreme Industries Supreme Industries – Cup & Handle Breakout Setup 🚀
Pattern: Cup & Handle formation nearing breakout
RSI: Above 65 and rising → momentum building
Trend: Price holding strong above EMA50
Volume: Steadily increasing
Enter after confirmation
Disc: For study, not a recommendation. DYOR

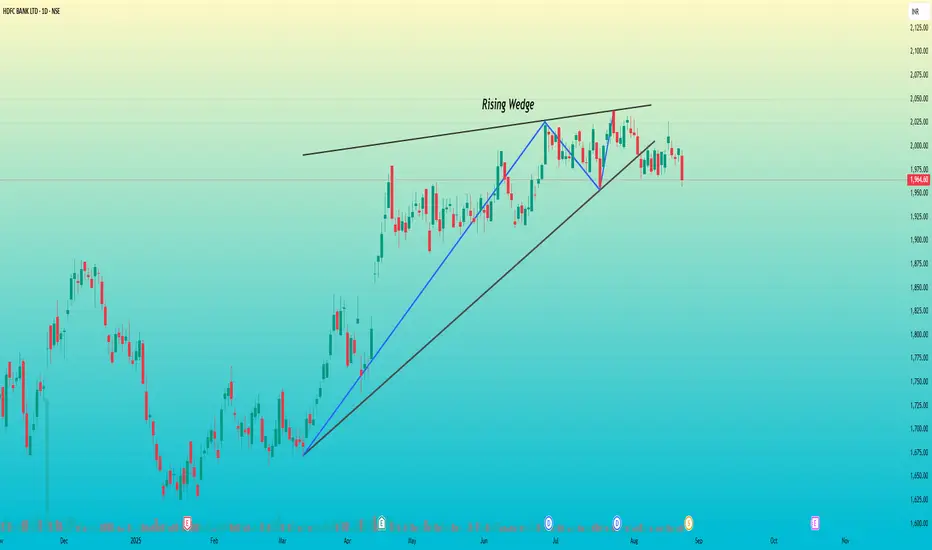
HDFC Bank – Rising Wedge Breakdown Signals Bearish Outlook📊 HDFC Bank Ltd – Daily Chart Analysis
🔹 Pattern Formation
A Rising Wedge pattern has developed on the daily timeframe.
The stock was in a strong uptrend since March, consistently forming higher highs and higher lows.
However, in recent weeks, the price struggled to sustain above the ₹2,025 – ₹2,050 zone, showing signs of exhaustion.
The wedge support has now been broken, with price closing near ₹1,964, confirming weakness.
Noticeable selling volume is accompanying the breakdown, strengthening the bearish case.
Lack of strong buying activity suggests buyers are losing control.
🔹 Key Levels to Watch
Immediate Resistance: ₹2,000 – ₹2,025 (any move above this will invalidate the bearish view).
Immediate Support: ₹1,950-55 (already tested, may break further).
Next Downside Levels: ₹1,925 → ₹1,900 → ₹1,875.
🔹 Trade Plan
📉 Short Bias: Below ₹1,975 with SL above ₹2,025.
🎯 Targets: ₹1,925 / ₹1,900 / ₹1,875.
📈 Invalidation: If price closes above ₹2,025 with strength, wedge breakdown fails and bullish trend may continue.
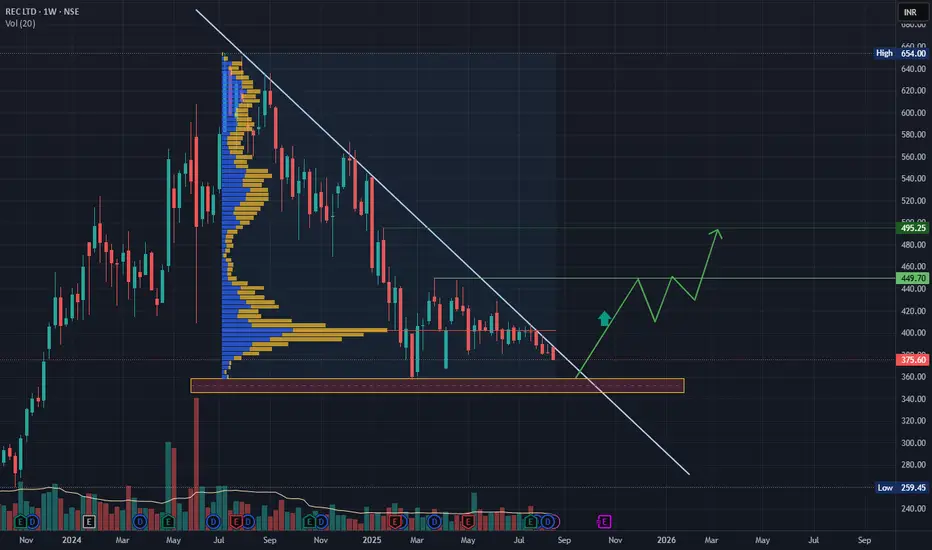
RECLTD Technical analysisRECLTD has declined approximately 40% and entered a consolidation phase since February 2025.
Based on my analysis, the stock may dip to around ₹357 before potentially reversing. However, if it closes above ₹400 with strong volume and sustains that level, it could signal a buying opportunity.
Target levels:
First target: ₹490
Second target: ₹560
Expected timeframe: By February/March 2026.
let see....
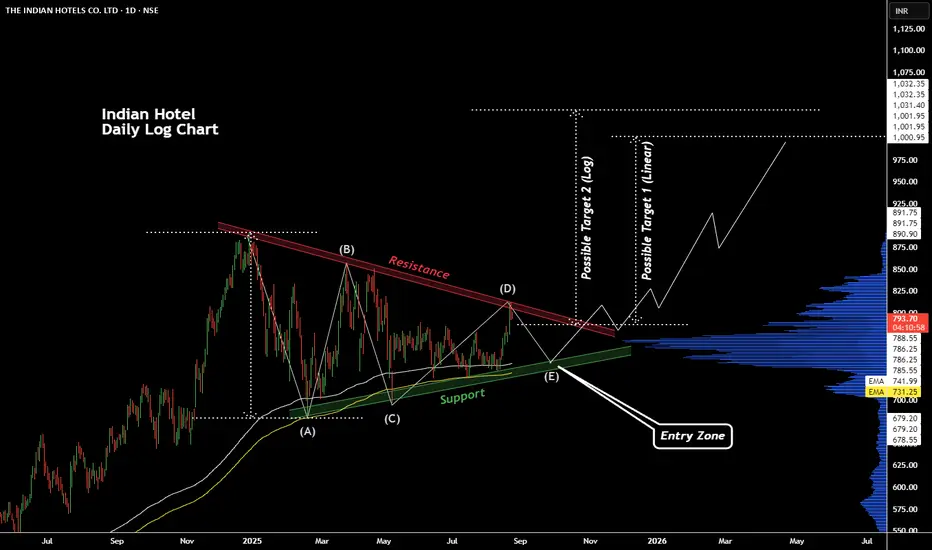
Trend continuation Pattern Observed in Indian Hotel StockTata Group's Indian Hotel Company's stock is moving sideways and forming Symmetrical Triangle (a trend continuation pattern). Presently near a resistance but the range of 740 to 730 can be a good support as we can see pattern boundaries, EMA supports and high volume activity in the same zone.