Best Possible Elliott Wave Counts: ETHUSDHello friends,
Welcome RK_Chaarts.
Today we're attempting to analyze Ethereum's chart from an Elliott Wave perspective. Looking at the monthly timeframe chart, we can see that from the beginning, around 2015-2016, when data is available, to the top in 2021 we have a Super Cycle degree Wave (I) marked in blue, which has completed.
Next, June 2022 we have a bottom around $874, marking the end of Super Cycle Wave (II) in blue.
We are now unfolding Wave (III), which should have five sub-divisions. Within this, the red Cycle degree Wave I and Wave II have completed, and we have possibly started the third of third wave.
Monthly:
Moving to a lower timeframe (Weekly) where we observed the completion of blue Wave (II) and the start of Wave (III), we notice that within this, the red Cycle degree Wave I and Wave II have completed, and we've possibly started Wave III of cycle degree marked in Red.
Furthermore, friends, within this third wave, we've marked the black Primary degree Waves ((1)) and ((2)), which we've labeled as Rounded ((1)) and Rounded ((2)). We're assuming these are complete, and Wave ((3)) has started, which is our current working hypothesis.
Weekly:
Now, if we move to a lower timeframe, such as the daily chart, we can see that the Cycle degree Wave II, which ended at 1385.70, has been followed by a Primary degree black Wave ((1)) in Black & Wave ((2)) has pulled back, completing Waves ((1)) and ((2)), and now Primary degree Wave ((3)) has started.
Possible wave counts on Daily
Within Wave ((3)), we expect five Intermediate degree waves. We've marked the first Intermediate degree Wave (1) in blue, which is currently unfolding. If we move to an even lower timeframe, such as the 4-hour chart, we can see that within the Intermediate degree blue Wave (1), there are five Minor degree sub-divisions marked in red. Waves 1 and 2 are complete, and Wave 3 is nearing completion.
Possible wave counts on 4 Hours:
Once Wave 3 is complete, we expect Waves 4 and 5 to follow, completing the Intermediate degree blue Wave (1). After that, we may see a dip in the form of Wave (2), followed by a continuation of the bullish trend as blue Wave (3).
Possible wave counts on 60 Min:
Friends, based on our multi-timeframe analysis, the overall wave structure appears bullish. We've provided snapshots of each timeframe, and you can see the nearest invalidation level marked with a red line.
In this study, we're using Elliott Wave theory and structure, which involves multiple possibilities. The scenario we're presenting seems plausible because it's aligned across multiple timeframes and adheres to Elliott Wave principles. However, please remember that this analysis can be wrong, and you should consult with a financial advisor before making any investment decisions.
This post is shared purely for educational purposes, to illustrate possible Elliott Waves.
I am not Sebi registered analyst.
My studies are for educational purpose only.
Please Consult your financial advisor before trading or investing.
I am not responsible for any kinds of your profits and your losses.
Most investors treat trading as a hobby because they have a full-time job doing something else.
However, If you treat trading like a business, it will pay you like a business.
If you treat like a hobby, hobbies don't pay, they cost you...!
Hope this post is helpful to community
Thanks
RK💕
Disclaimer and Risk Warning.
The analysis and discussion provided on in.tradingview.com/u/RK_Chaarts/ is intended for educational purposes only and should not be relied upon for trading decisions. RK_Chaarts is not an investment adviser and the information provided here should not be taken as professional investment advice. Before buying or selling any investments, securities, or precious metals, it is recommended that you conduct your own due diligence. RK_Chaarts does not share in your profits and will not take responsibility for any losses you may incur. So Please Consult your financial advisor before trading or investing.
Elliott Wave

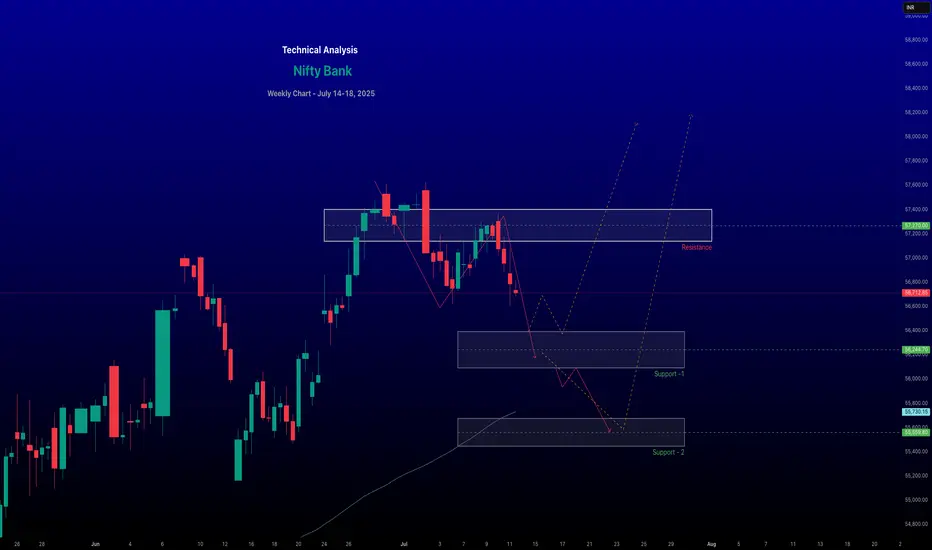
renderwithme | Bank Nifty Prediction for July 14–18, 2025
~~ Bank Nifty Current StatusClosing Price (July 11, 2025): ~~
The Bank Nifty index closed at 56,754.7, down 0.35% (201.3 points), reflecting selling pressure in key constituents like HDFC Bank (-1.16%), Canara Bank (-0.64%), and Bank of Baroda (-0.79%).
#Recent Trend:
The index has shown a bearish tilt, breaching the 20-day Exponential Moving Average (EMA) support, with a cautious market sentiment.
# Historical Context:
Despite the recent dip, Bank Nifty has a positive seasonality trend, with 11 out of 17 years showing positive returns in July.
~~ Technical Analysis ~~
# Support Levels:
Immediate support: 56,400–56,000 (key psychological and technical level).
Additional supports: 55,736 and 55,438.
Critical support: 55,000, a level noted as a potential rebound point if held.
# Resistance Levels:
Immediate resistance: 57,000–57,500 (significant open interest in call options at these strikes).
Higher resistance: 57,300–57,500, with a breakout above 57,200 potentially signaling a move toward 57,600–58,000.
Bank Nifty Prediction for July 14–18, 2025Bullish Scenario:A breakout above 57,200–57,300 could push the index toward 57,600–58,000, especially if banking heavyweights like ICICI Bank or SBI show strength.
Sustained trading above 57,000, supported by positive earnings or global cues, could reinforce the bullish trend.
Bearish Scenario:A break below 56,500 could trigger selling toward 56,000 or lower (55,540–55,000).
Negative earnings or renewed global uncertainties (e.g., trade tensions) could exacerbate declines.
Likely Range: The index is expected to trade between 56,500–57,500, with consolidation likely unless a clear breakout or breakdown occurs.
~~ Disclaimer --
This analysis is based on recent technical data and market sentiment from web sources. It is for informational purposes only and not financial advice. Trading involves high risks, and past performance does not guarantee future results. Always conduct your own research or consult a SEBI-registered advisor before trading.
#Boost and comment will be highly appreciated
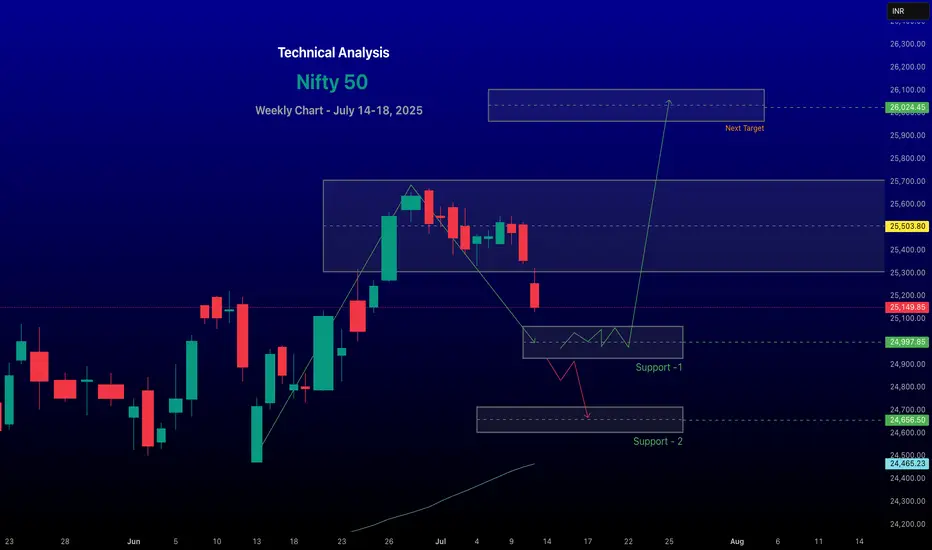
renderwithme | Nifty 50's movement for the week of July 14–18, Predicting the Nifty 50's movement for the week of July 14–18, 2025,
Involves analyzing recent market trends, technical indicators, and macroeconomic factors based on available data. Here’s a concise analysis:Market ContextRecent Performance: The Nifty 50 closed at 25,149.85 on July 11, 2025, down 0.78% from the previous day, reflecting a bearish session driven by losses in IT, auto, and oil & gas stocks. The index has been volatile, with a weekly decline of 0.59% but a monthly gain of 0.63%.
# Global Cues:
Mixed global market trends are influencing sentiment. U.S. markets are at record highs, but Wall Street futures are down, and Asian markets are mixed (e.g., Nikkei 225 up, Hang Seng down). The looming U.S. tariff deadline and potential U.S.–India trade agreement talks are key events to watch.
#FII/DII Activity:
Foreign Institutional Investors (FIIs) have been selling, which may weigh on short-term sentiment, while Domestic Institutional Investors (DIIs) could provide support.
~~ Technical Analysis ~~
Trend: The Nifty 50 is in a broader uptrend but showing signs of a short-term correction. It closed below the key level of 25,400, indicating potential weakness. Technical indicators suggest a sideways to bearish bias for the near term.
#Support and Resistance:
Support: Key support lies at 24,900–25,133. A break below 24,900 could lead to further declines toward 24,700 or 24,500.
Resistance: Immediate resistance is at 25,500–25,650. A sustained move above 25,650 could signal bullish momentum toward 25,770–26,000.
# Indicators:
Moving Averages: The index is above its 20-day, 50-day, and 200-day EMAs, supporting a bullish long-term trend, but recent selling pressure at higher levels indicates consolidation.
# Sectoral Outlook
Bullish Sectors: Banking, pharma, realty, oil & gas, and media showed resilience last week, with stocks like HDFC Bank, Bajaj Finance, and Coal India gaining.
Bearish Sectors: IT, metals, telecom, and auto underperformed. IT stocks like TCS, HCL Tech, and Infosys dragged the index due to weak Q1 results (e.g., TCS reported a 6% profit increase but faced margin pressure).
Key Events to WatchU.S.–India Trade Talks: Clarity on a potential interim trade agreement could boost sentiment, especially for export-oriented sectors.
FOMC Minutes: The release of FOMC minutes may influence global rate expectations, impacting FII flows.
Forecast for July 14–18, 2025Expected Range: The Nifty 50 is likely to trade between 25,000–25,750. A break below 24,900 could test 24,500, while a move above 25,650 may target 26,000.
~~ Disclaimer --
This analysis is based on recent technical data and market sentiment from web sources. It is for informational purposes only and not financial advice. Trading involves high risks, and past performance does not guarantee future results. Always conduct your own research or consult a SEBI-registered advisor before trading.
#Boost and comment will be highly appreciated
Renderwithme | Bitcoin at resistance Bitcoin Price Analysis for Next Week (July 14–20, 2025)Predicting Bitcoin's price for the
upcoming week involves analyzing current market trends, technical indicators, and macroeconomic factors. Based on recent data, here’s a concise analysis for Bitcoin (BTC) for the week of July 14–20, 2025. Note that cryptocurrency markets are highly volatile, and predictions are speculative. Always conduct your own research before making investment decisions.Current Market OverviewCurrent Price: As of July 7, 2025, Bitcoin is trading around $108,000–$109,420.41, with slight variations across sources.
Recent Performance: Bitcoin has shown a modest upward trend, with a 0.56% increase over the past week and a 4.38% gain over the last month. It reached an all-time high of $112,000 on May 22, 2025, but recently pulled back from $110,000 due to whale transfers and macroeconomic uncertainty.
Market Sentiment: Sentiment is cautiously optimistic, with the Fear & Greed Index in the Neutral zone, indicating investors are accumulating during dips. Technical indicators suggest a bullish outlook, though short-term volatility is expected.
Technical AnalysisPrice Levels and Trends:Bitcoin is trading above key support levels at $106,700 and $103,709 (20-day and 50-day EMAs), with resistance at $109,800–$112,000. A weekly close above $109,000 could confirm a breakout, potentially targeting $113,500 or higher.
A descending triangle pattern is noted, with a potential breakout by early August. If bullish momentum persists, $110,000 is a key resistance to watch. Failure to hold above $99,000 could lead to a retest of $94,000–$96,000.
Disclaimer --
This analysis is based on recent technical data and market sentiment from web sources. It is for informational purposes only and not financial advice. Trading involves high risks, and past performance does not guarantee future results. Always conduct your own research or consult a SEBI-registered advisor before trading.
#Boost and comment will be highly appreciated

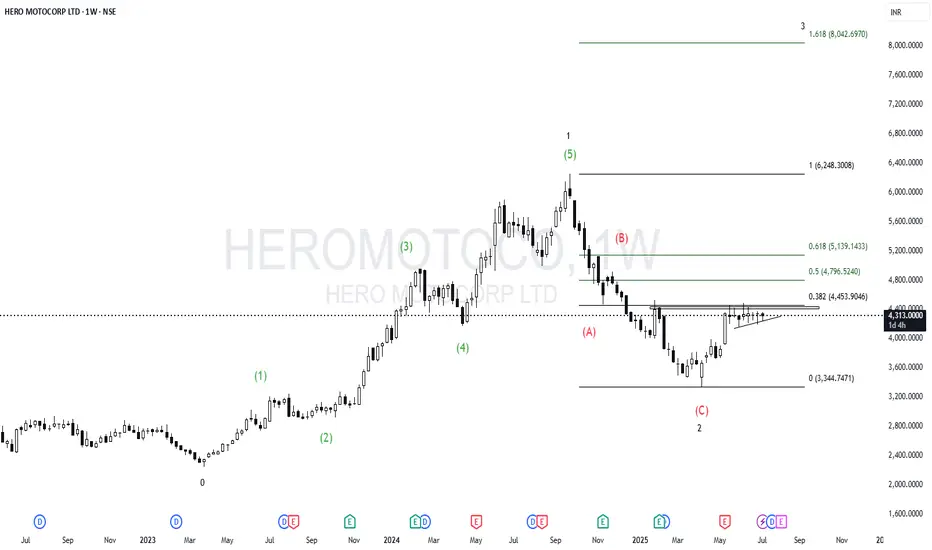
HEROMOTOCORP - Poised for an impulse moveHero Motocorp has been consolidating for a while , looking good to give a good impulse to the 3rd wave , Would be good to trade after the breakout range of 4500 levels.
Corrective RiseCoal India seems to have completed Wave D of a triangle/diametric and now entering Wave E
The minimum target is around 450-455 on a daily level.
Profit booking could be done on other mentioned intermediate levels according to your trading style

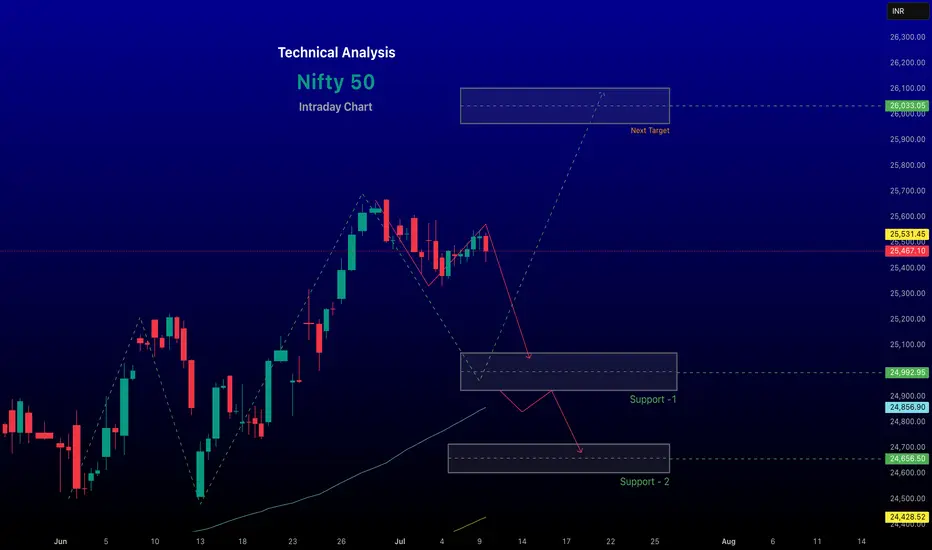
renderWithMe | Nifty 50 - Intraday analysis Technical Outlook for July 11, 2025:
Support Levels: Immediate support is at 25,490, with a stronger base at 25,440-25,400. A break below 25,400 could lead to further downside, potentially testing 25,100 or 24,900.
Resistance Levels: Resistance is around 25,600, with a breakout above this level potentially pushing the index toward 25,800 or higher. A sustained move above 25,670 in the NIFTY 50 July Futures could target 25,780.
Forecast: One source predicts the NIFTY 50 at 25,285 on July 11, with a trading range of 23,262 (minimum) to 27,308 (maximum). However, the index is likely to remain range-bound unless a clear breakout occurs above 25,600 or below 25,400.
Disclaimer --
This analysis is based on recent technical data and market sentiment from web sources. It is for informational purposes only and not financial advice. Trading involves high risks, and past performance does not guarantee future results. Always conduct your own research or consult a SEBI-registered advisor before trading.
#Boost and comment will be highly appreciated
BUY GRSE, target 3712, stop loss 2731, 24% upside
GRSE, after completing wave (iii) on 5 June has been undergoing correction in the form a flat which is a 3-3-5 structure (abc (A), abc (B), 12345(C)), whole wave named as ABC.
The last wave C, which is a 5-wave structure is complete as given in the charts and stock has started moving up. Generally, this is ok; however, it is found that in recent wave formations, there has been wave extensions in Wave C and hence there is a possibility that the present 5-wave formation is wave (1) of larger degree, i.e. potential wave (1) extension. If this is the case stock may continue correction, after retracing certain levels.
Buy at current levels with a stop loss of 2731 and maintain trailing stop loss.
Happy Trading !!

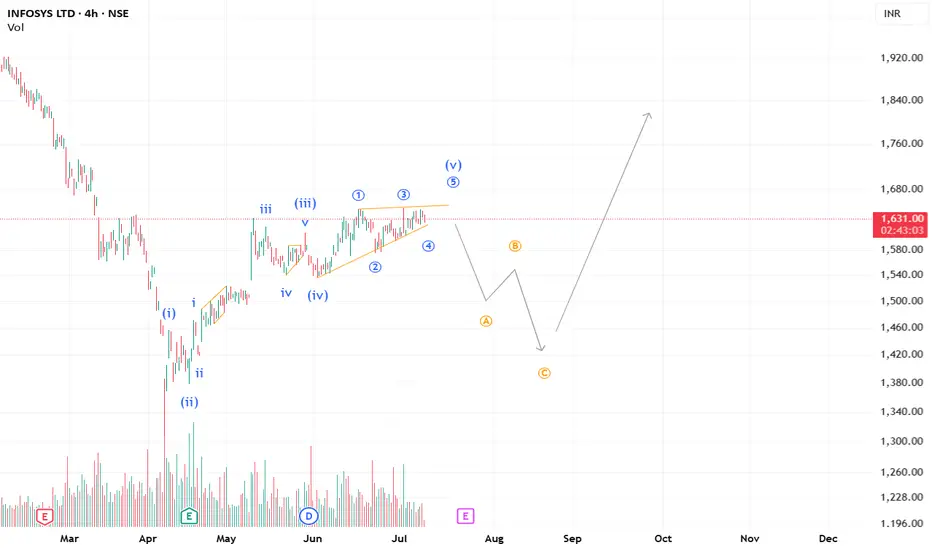
Can it be a mini Ending Diagonal in INFY in Wave 1?INFY seems to be completing an Ending Diagonal in Wave 5. We may see a downside ABC correction and then Wave 3, probably.
**This analysis is based on the Elliott Wave Principle.
This analysis is for educational purposes only and not investment advice.
Please consult your SEBI-registered advisor before making any investment decisions. Markets are subject to risk.**
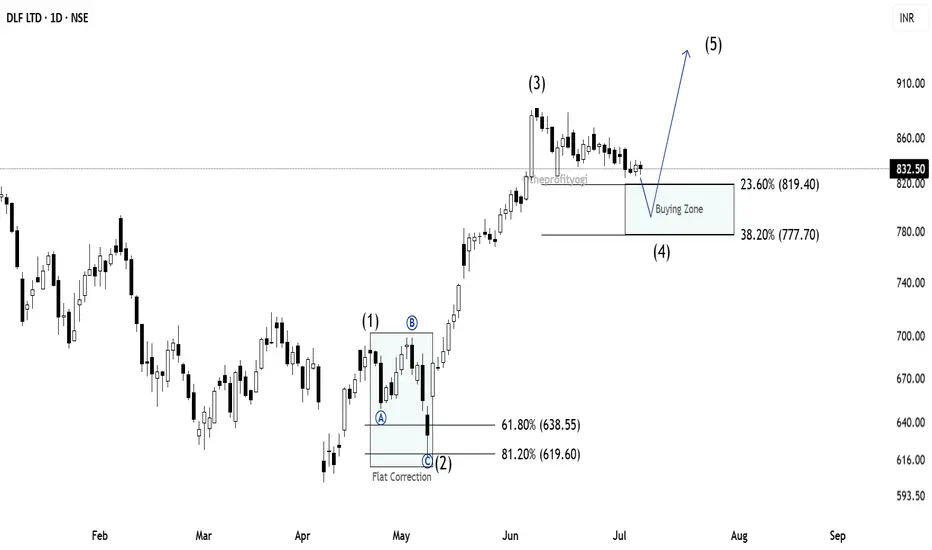
DLF: Elliott Wave AnalysisWe will soon get an excellent buying opportunity in DLF.
As we can see, I have marked DLF using Elliott Wave theory and Fibonacci.
You can see that, after forming wave (1), the market falls to form wave (2). In wave (2), we can see Flat Correction marked with ABC counting.
Price then moved fast, indicating a clear impulse to form wave (3).
Currently, we are in wave (4) in DLF.
As per the rule, we can expect wave (4) to terminate between 23.6% and 38.2%
This is the most probable zone where we can expect a new impulse, i.e., wave (5), to start.
One has to wait for the market to fall in this Buying zone to get a good buying opportunity.
This analysis is based on Elliott Wave theory and Fibonacci.
This analysis is for educational purposes only.
This is not a buying recommendation.
NIFTY’s Y-Wave: Sideways Coil Before a Drop?From the high of 25,669.35, NIFTY has been correcting in a WXY pattern. After completing Wave W and topping out at 25,587.50 as Wave X, the index began its Y leg with a sharp drop to 25,384.35 — likely Wave A of Y.
Price action since then is showing early signs of a contracting triangle on the 1-minute chart, possibly Wave B of Y. If valid, a breakdown from this structure would mark the beginning of Wave C, with a support zone between 25,317 and 25,222 acting as a likely target area.
With the US markets shut on 4th July and a weekend ahead, price may continue coiling within this triangle a bit longer before resolving .
This triangle setup remains valid as long as price stays below 25,448.60. A move above that level would invalidate the count and point to further complexity.
Disclaimer: This analysis is for educational purposes only and does not constitute investment advice. Please do your own research (DYOR) before making any trading decisions.

LIC Housing: A Correction That Refuses to End?After completing the first upward leg from the March low near 483.70, LIC Housing Finance rallied sharply to 623.90. This rise is being marked as wave 1 or A, depending on whether the structure develops into an impulse or a zigzag.
After that peak, a correction was expected. Initially, price dropped to 565.40 in a clear abc formation, which could have marked the end of wave 2 or B. However, the market didn’t follow through with a strong rally. Instead, price began moving sideways in a choppy, overlapping manner — a strong clue that the correction wasn’t over.
This overlapping price action evolved into a WXYXZ structure, a complex form of correction.
Here’s how the structure now looks:
The initial drop to 565.40 is being treated as wave a of a larger correction.
The sideways consolidation that followed is marked as wave b.
The current expectation is for a final wave c down — which would complete the full abc correction of a higher degree, labeled as wave 2 or B. The ideal target zone for wave c lies between 1x to 1.618x the length of wave a, projected from the end of wave b.
Support lies in the 568.80–532.65 zone. If price dips into this area and shows signs of reversal — particularly with bullish divergence on RSI — it could set the stage for the next leg higher in wave 3 or C.
The invalidation level for this count stands at 627.30. A sustained move above this level would negate the possibility of a wave c decline and instead suggest that a new impulsive leg has already begun.
Disclaimer: This analysis is for educational purposes only and does not constitute investment advice. Please do your own research (DYOR) before making any trading decisions.

Bajaj Auto: Wave 4 Triangle Nearing CompletionAfter completing a complex W-X-Y-X-Z correction earlier this year, Bajaj Auto appears to have started a fresh impulsive rally. The move from 7,089 to 9,004 looks like a 5-wave structure in progress, with the chart now suggesting Wave 4 is unfolding as a contracting triangle.
Wave E of the triangle seems close to completion near the lower boundary.
SMA100 is aligned with this support zone, potentially offering additional footing for price.
The Fibonacci retracement zone (Wave 1–3) lies between 8,046 and 8,273.
RSI is stabilizing, indicating that downside momentum is weakening.
A breakout from the triangle could signal the start of Wave 5.
Key level to watch:
Invalidation at 7,612 — a break below this would invalidate the current bullish setup.
Note: This chart is part of my ongoing series where I aim to annotate and study as many NIFTY-listed stocks as possible using Elliott Wave principles and simple technical tools.
Disclaimer: This analysis is for educational purposes only and does not constitute investment advice. Please do your own research (DYOR) before making any trading decisions.

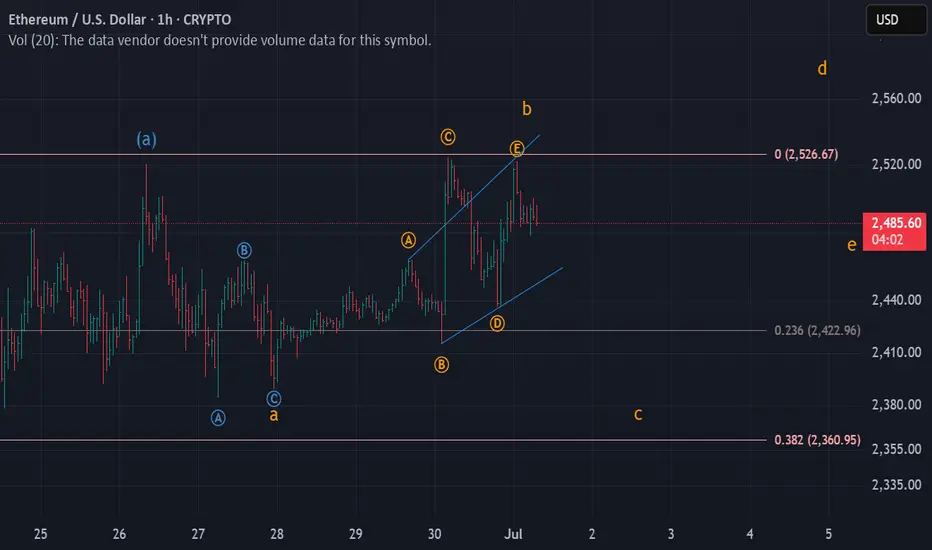
Corrective Rise UpEthereum seems to have completed Wave C
and now we're entering Wave D which will be a corrective rise.
I believe we're in the starting of a diametric formation which will be of 'diamond' category

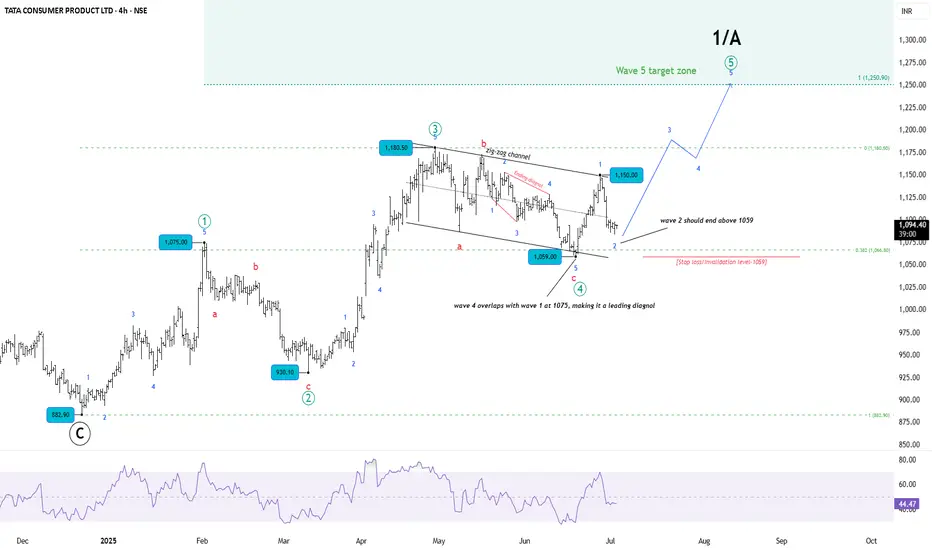
TATA CONSUMER — The Calm Before Wave 5TATA Consumer has completed a textbook corrective structure from its recent high of 1180.50. The entire correction unfolded as an ABC zigzag, neatly contained within a falling channel. Within wave C of this zigzag, price action formed an ending diagonal, with wave 4 overlapping wave 1—confirming the diagonal structure and marking the completion of higher-degree wave 4 at 1059.
This 1059 level also becomes the key invalidation point for the current bullish outlook.
Following this, price broke out impulsively to 1150, forming what appears to be wave 1 of the next leg higher—wave 5. The current pullback is likely wave 2 of 5, and as per Elliott Wave rules, it must remain above 1059 to keep this count valid.
Wave 5 targets are projected using a 100% extension of wave 1 from the end of wave 4, which gives a potential upside zone around 1250.90. This forms the ideal target range if the wave count unfolds as expected. The targets could as well extend to 1.618x of wave 1.
From a higher-degree perspective, since wave 4 overlaps with wave 1 (at 1075), the entire advance is best seen as a leading diagonal. This pattern often appears as the first wave of a new impulse, reinforcing the view that one more leg higher is likely to complete wave 5 and mark the end of wave 1 or A of a larger degree.
RSI had peaked near 70 during subwave 1 of 5 and has now cooled to the 40s, which aligns well with a wave 2 retracement. Earlier, RSI had dipped closer to oversold levels at the Wave 4 low, adding further support to the case for a completed correction.
Conclusion:
We are in prime low-risk, high-reward territory.
Setup is textbook Elliott bullish continuation — tight invalidation and defined structure.
Disclaimer:
This analysis is for educational purposes only and not investment advice. Always do your own research before making trading decisions.
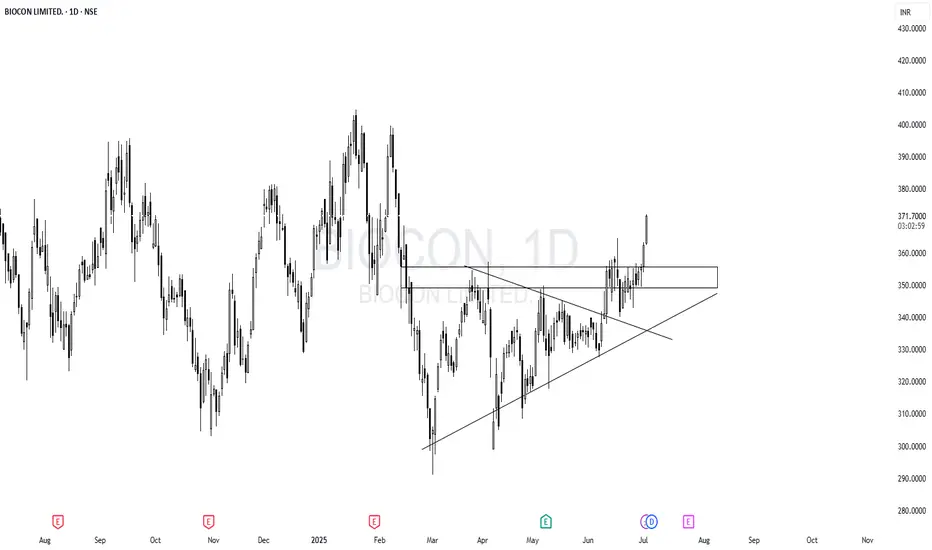
Impulse Started - BioconBiocon has broken its crucial resistance zone and is now poised for a good impulse moves in the coming weeks. We can expect the target around 400
Corrective Downtrend | Hourly Ethereum seems to have completed Wave B in an hourly timeframe and now moving towards Wave C which could end a little lower than the starting of Wave B.
Will keep updating in case of any changes
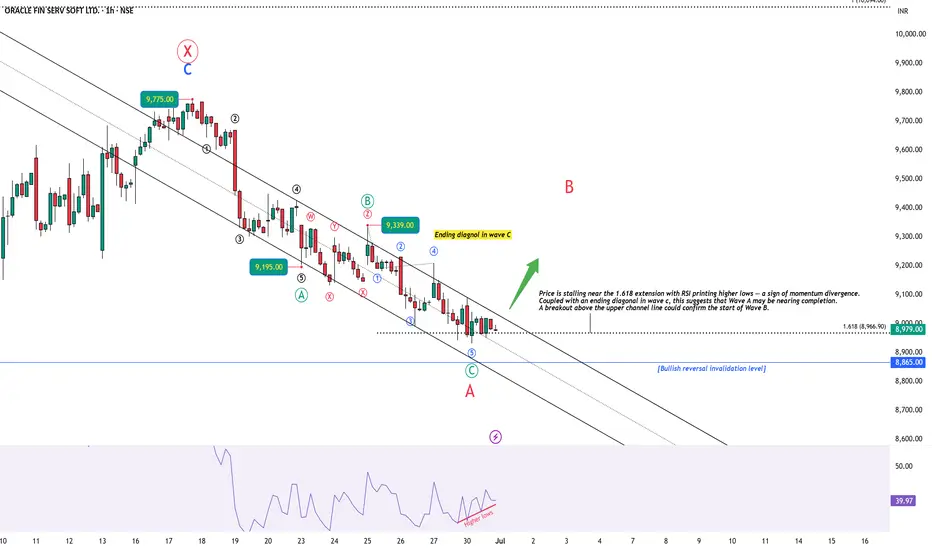
OFSS: Setting Up for a Relief Rally?🔍 Introduction
This analysis starts from the 1-hour timeframe, where price action shows signs of exhaustion at the tail end of a 5-wave decline. A classic ending diagonal in wave c, along with bullish RSI divergence, points toward a potential short-term reversal — possibly the start of Wave B in a larger A-B-C corrective structure. We then zoom out to place this setup within a broader W-X-Y correction that began from the 13,220 high.
🕐 1H Chart: Ending Diagonal + RSI Divergence into Key Zone
Following the peak at 9775, price has been declining in what appears to be a ABC zigzag correction. Subwave 5 (within wave c) exhibits ending diagonal behavior, with overlapping internals and weakening thrust. Importantly, RSI has been printing higher lows, diverging strongly against lower price lows — a signal of potential bottoming.
Price is also testing the 1.618 Fibonacci extension level. A decisive breakout above the upper trendline would confirm a likely transition into Wave B.
🟢 Watching closely for a decisive breakout / close above the channel.
📆 Daily Chart: W-X-Y Structure from 13,220 High
Zooming out, ORACLE FIN SERV is unfolding a W-X-Y correction from its 13,220 high:
Wave W completed as a zigzag down to 7038.
Wave X unfolded as a zigzag rally, peaking at 9775. Notably, Wave C of X did not reach 100% of Wave A — signaling internal weakness.
Wave Y is now developing as a red A-B-C structure, with Wave A possibly ending near the 8930 level.
🧠 Conclusion & Key Levels to Watch
Wave A of Y appears to be nearing completion, supported by:
Ending diagonal structure in wave C (1H)
RSI bullish divergence
Price stalling at 1.618 extension
A breakout above the channel could mark the start of Wave B — potentially retracing 38–61.8% of the drop from 9775
📌 This setup offers both short-term and structural clues. I’ll post follow-ups as this unfolds.
⚠️ Disclaimer
This post is for educational purposes only and does not constitute financial advice. Please do your own research and manage risk appropriately.
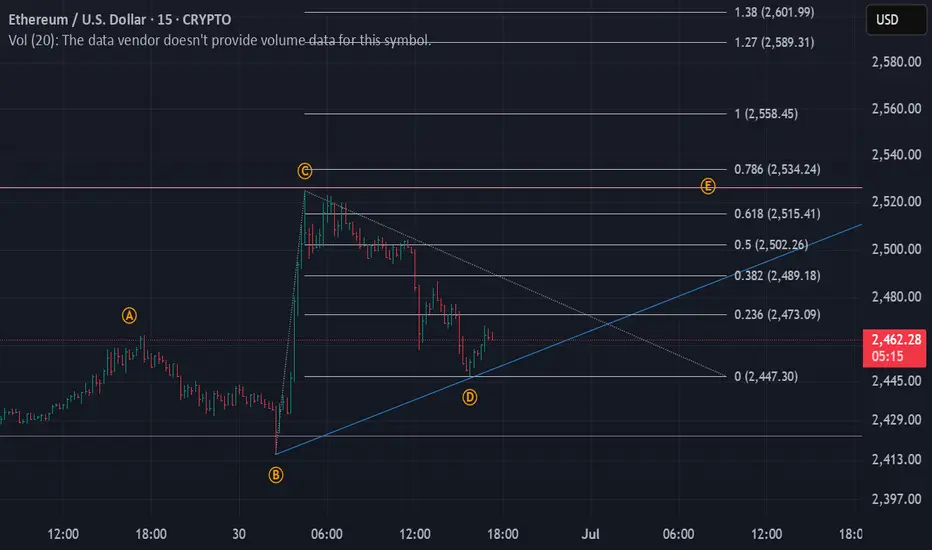
Corrective Rise UpEthereum seems to have or nearly completed Wave D of a neutral triangle and entering Wave E.
The minimum target of Wave E is around 2480
A break below current B-D trendline will be a warning sign that Wave D is still in progress
Nifty ready to Test All Time High at 26100-200After weeks of consolidation Nifty has given a Strong Breakout with Comfortable Weekly Close above
0.78 Fib Retracement
In days to come Nifty could test 26000 Level again.
It will be interesting to see price action at 26000
Time being buy dips to 26000
Rest for the Next
Rationale
Taken Support at 0.23 Fib retracement and 20 MEMA

INFY | DOWNTRENDInfosys seems to have completed Wave B on a larger timeframe
and we have now entered Wave C to the downside.
Recommended to stay away from this stock for long term investment

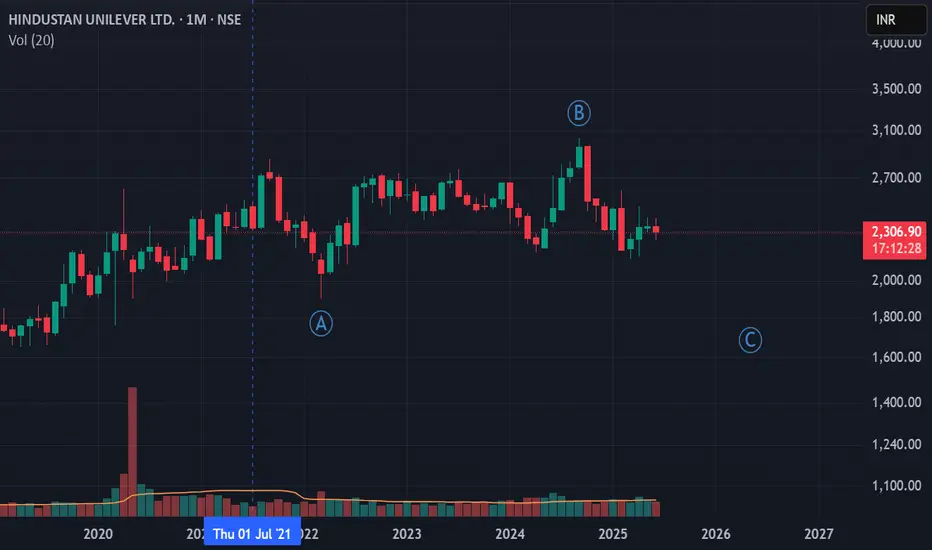
HINDUNILVR | In a downtrendHindustan Unilever seems to have completed Wave B on a monthly timeframe and has entered Wave C.
It's better to stay away if planning for long term investment
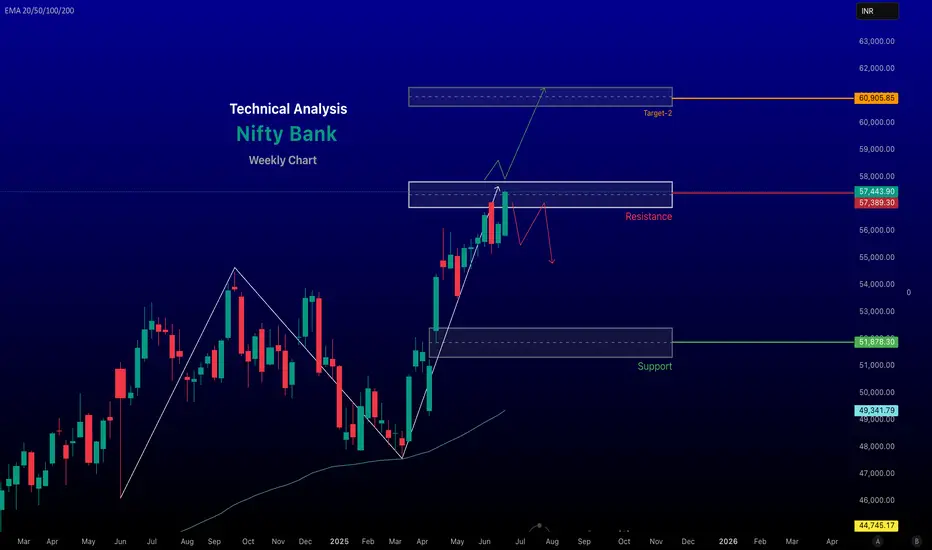
Bank Nifty Weekly Analysis for June 30, - 04, July - 2025The Bank Nifty index, as of June 28, 2025, shows a bullish outlook based on recent market data and technical analysis, though traders should remain cautious due to potential volatility and resistance levels. Here's a detailed analysis for today:
Market Performance and Sentiment
Recent Performance: The Nifty Bank index closed at 57,443.90 on June 27, 2025, with a gain of 237.20 points (+0.41%), indicating continued bullish momentum. The index has been trading near its 52-week high of 57,475.40, reflecting strong sectoral leadership. Posts on X suggest that Bank Nifty has outperformed the Nifty 50, which is 2.5% below its all-time high, with a target of 59,000.
Market Sentiment: Positive global cues, including a ceasefire between Israel and Iran, falling crude oil prices, and dovish signals from the U.S. Federal Reserve, have boosted risk appetite, supporting the banking sector's rally. Foreign Institutional Investors (FIIs) have been net buyers for four consecutive months, further fueling bullish sentiment. However, significant open interest (OI) buildup in the last two days suggests potential for abnormal volatility in the near term.
~~~ Technical Analysis ~~~
Current Levels and Trends: The index is closing at around 57,443.90, with a gain of 0.41%. The advance/decline ratio is positive at 8:4, indicating broader participation in the uptrend. The index is trading above key exponential moving averages (20-day, 50-day, and 200-day EMAs), confirming a strong upward trend on the weekly timeframe.
# Support and Resistance:
Support: Strong support is noted around 57,000, which has held well in recent sessions. A break below this could drag the index to 56,400–56,000. Additional support lies at 55,500, a critical level for maintaining bullish bias.
Resistance: Immediate resistance is at 57,500–57,800. A decisive break above 57,800 could push the index toward 58,000–58,400. Call options at 56,500 and 57,000 show significant open interest, reinforcing these as key resistance levels.
Technical Indicators: The Relative Strength Index (RSI) on the weekly timeframe is at 67.31, showing a reversal toward the upside, indicating strengthening momentum. However, a bearish divergence on the 4-hour chart remains unresolved, suggesting a potential correction toward 52,000 if the bullish structure weakens.
-- Bullish trend, next target 61,000 if we break and close above 57,800 on weekly timeframe --
Chart for reference.
- Disclaimer --
This analysis is based on recent technical data and market sentiment from web sources. It is for informational purposes only and not financial advice. Trading involves high risks, and past performance does not guarantee future results. Always conduct your own research or consult a SEBI-registered advisor before trading.
#Boost and comment will be highly appreciated