JIO FINANCE is going to Fly soonWave 4 completed in JIO FIN and stock has already started it's wave 5. Minimum projection for wave 5 is 38.2%. Targets are 38.2%, 61.8% and 100%.
Targets
1. T1 -> 400
2. T2 -> 460
3. T3 -> 600
SL will be below wave 4 which is 300 on daily closing basis only.
Elliott Wave

BHEL 2nd Wave in formation After completing full Elliot wave cycle on Weekly chart. It has started to fall from top and some corrective has came with gains in index. Stock has started to take resistance from 61-70% area of wave B and seems like wave C is going to start and we can see stock below 200 and possibly till 140 as well

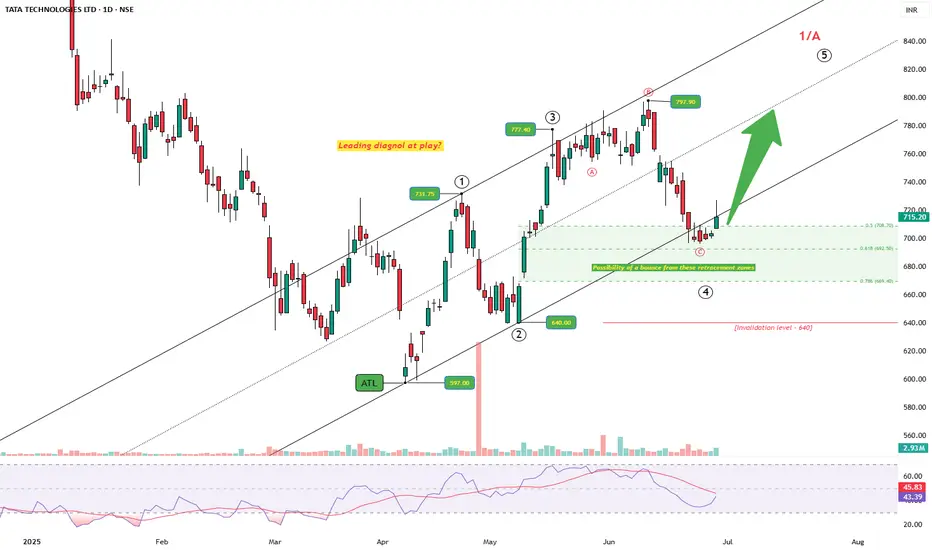
TATA TECH: Messy But Intentional — Diagonal at Work?After tagging the all-time low at 597, price started a steady climb. The structure unfolding looks like a potential leading diagonal, not a typical impulsive sprint. Wave 1 pushes up to 731.75, followed by a sharp drop to 640 — a classic deep Wave 2, but still holding above the origin. From there, Wave 3 stretches to 777.4, slightly longer than Wave 1, keeping things in check.
Then comes the messy drop — choppy, overlapping, three-legged, as Wave 4 of a diagonal. It lands right into the golden retracement zone, finding support between 0.5 and 0.786.
Now the price is bouncing back and is above 715, nudging towards the upper channel. If it sustains, Wave 5 could unfold next, aiming to breach the 797 high. But — and this is crucial — if price falls below 640, this structure breaks down. That would kill the diagonal count and force a rework.
RSI is curling up from oversold, hinting at renewed strength. Price, structure, and momentum — all are beginning to align. Let's see how the price strcuture unfolds in the coming week.
Nifty - Elliot Wave - Update - Stay long till proven otherwise!Our view that at least one more leg up was pending has held out well.
View shared here:
Now, Since it took longer in consolidation, I am open to considering that we did a sideways 2 and are heading up in 3.
Crossing 25700 will invalidate LD and hence increase probability that 3 up has started.
P.S.: If we are actually in 3, then 28k - 30k possible in this year. So, hold on :)

Bitcoin - Interesting Price Action in 1 HTFTRADERS AND INVESTORS,
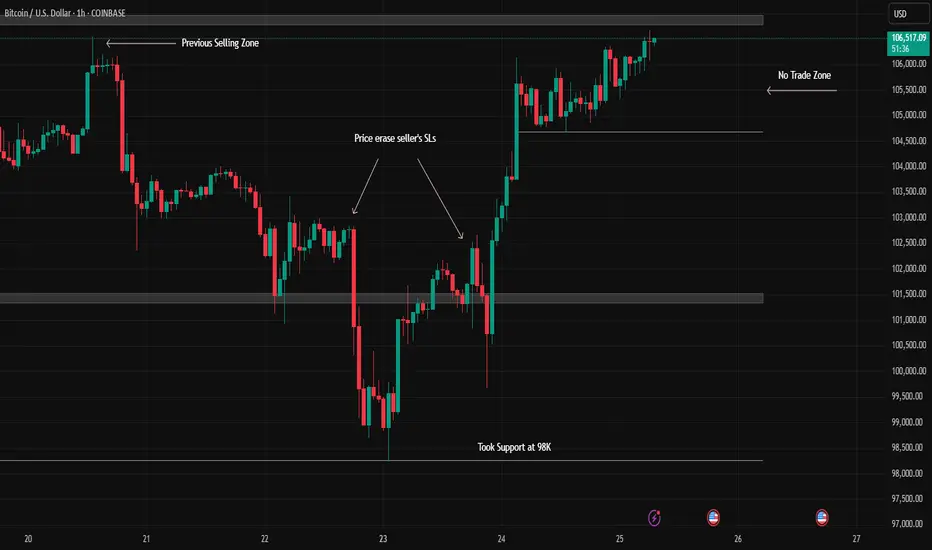
The Bitcoin chart presents an interesting setup on the 1-hour timeframe (1 HTF). Here's a breakdown of recent price action:
Initial Resistance & Downtrend : Bitcoin's chart indicated potential trend changes, with significant selling pressure at the $106,000 mark establishing a clear resistance level.
Downtrend Confirmation & Support : This was followed by a series of lower highs, confirming a downtrend. Subsequently, Bitcoin found support and bounced from the $98,000 level.
Potential Reversal Signal : The recent upward movement cleared sellers' stop-losses, which could be an early indication of a potential trend reversal.
WHAT MIGHT HAPPEN NEXT?
Currently, Bitcoin is re-testing the crucial $106,000 resistance level.
Bullish Scenario : A confirmed breakout and sustained move above $106,000 could signal the continuation of an uptrend.
Bearish Scenario : Conversely, a strong rejection from this level might lead to a decline, potentially targeting the $101,000 support.
Current Stance : At present, this area appears to be a no-trade zone due to the indecisive price action.
Disclaimer : This analysis is for educational purposes only and should not be considered financial advice. Always conduct your own research before making investment decisions.

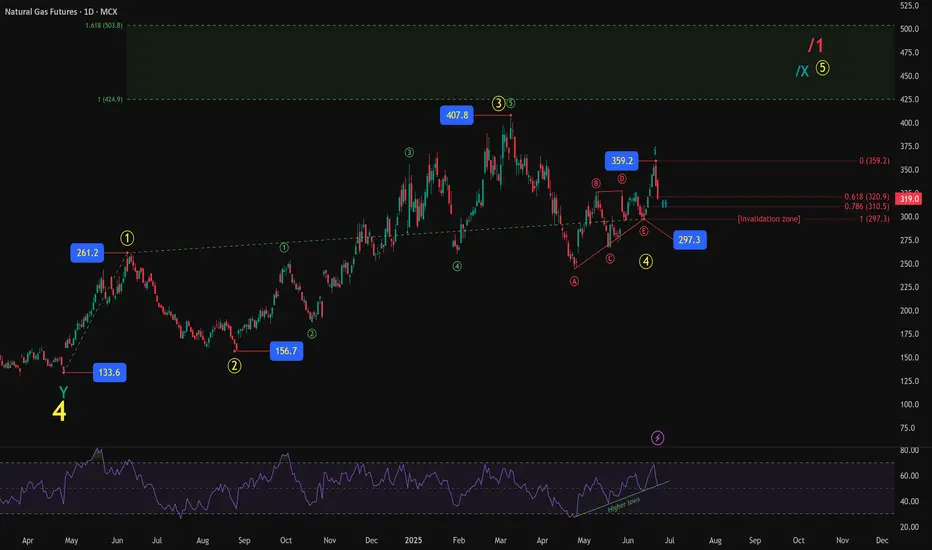
Natural Gas Futures: Triangle Breakout and New Impulse UnfoldingNatural Gas Futures (MCX) is showing an interesting Elliott Wave structure unfolding. After completing a corrective Y wave near 133.6, prices started a well-defined impulsive advance. The initial advance took shape as a 5-wave structure (yellow degree), completing wave 1 at 261.2, followed by a healthy correction into wave 2 at 156.7. The subsequent rally carved out another 5-wave pattern (green degree), pushing prices toward 407.8, marking a likely completion of wave 3.
The corrective wave 4 unfolded as a typical contracting triangle (ABCDE), finding support around 297.3. This triangle structure respected the Elliott guidelines quite well and indicates a potential setup for the next impulsive leg higher.
Post-triangle, the initial move up to 359.2 can be counted as wave i of the next larger impulse. The ongoing retracement has pulled back close to 61.8%–78.6% Fibonacci levels, a common zone for wave ii corrections. The RSI continues to print higher lows, supporting the underlying bullish sequence.
The invalidation zone is clearly marked around 297.3. As long as price remains above this level, the possibility of an ongoing bullish impulse remains valid, with eventual targets extending much higher toward the 1.618 projection zone near 503.
This remains a developing wave count, with structure still unfolding. Monitoring how price reacts around current levels will provide further clues whether the larger bullish sequence resumes or deeper correction emerges.
Disclaimer:
This analysis is for educational purposes only and does not constitute investment advice. Please do your own research (DYOR) before making any trading decisions.
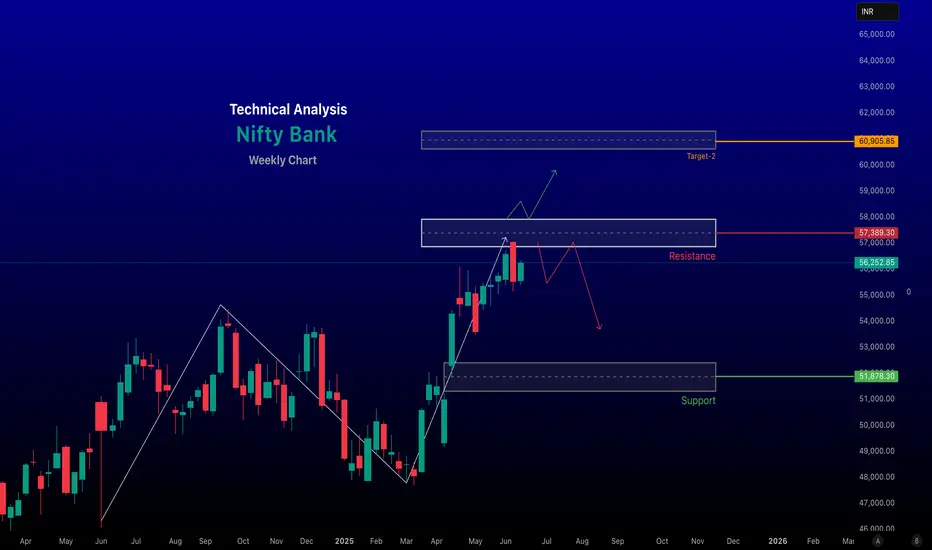
Bank Nifty Weekly Analysis for June 24 –June 28 June , 2025~~ Technical Outlook ~~
Current Trend: The Nifty Bank Index is in a positive trend, with a closing value of 56,252.85 on June 20, 2025, reflecting a 1.22% gain. The index has entered a bullish phase in the last trading session, supported by strong buying in key constituents like HDFC Bank (+1.44%), ICICI Bank (+1.07%), Canara Bank (+2.25%), and Federal Bank (+1.62%).
#Support and Resistance Levels:
Support: Immediate support lies at 55,781, followed by 55,308 and 54,726. A critical long-term support is around 51,500; a break below 51,000 could signal weakness.
Resistance: Resistance is seen at 56,900, with potential upside targets at 56,600, 57,000, and a new all-time high around 57,267–57,500 if momentum sustains. the Long-term Target is around 60,500
!! Market Sentiment
Domestic and Institutional Activity: Domestic Institutional Investors (DIIs) have been strong buyers, purchasing ₹8,207 crore on June 18, while Foreign Institutional Investors (FIIs) were net buyers with ₹1,482 crore, indicating robust domestic support.
Sectoral Performance: The banking sector led gains, with 11 of 12 constituents in the green on June 20. Private banks like HDFC and ICICI Bank limited downside pressure, while public sector banks (PSU Banks) showed relative weakness, with the Nifty PSU Bank Index down 0.9% on June 16.
# Due to geopolitical tension, the market may be sideways or volatile.
-- Disclaimer --
This analysis is based on recent technical data and market sentiment from web sources. It is for informational purposes only and not financial advice. Trading involves high risks, and past performance does not guarantee future results. Always conduct your own research or consult a SEBI-registered advisor before trading.
#Boost and comment will be highly appreciated
IDFC FIRST BANKIDFCFIRSTBANK.
Anything above 112 should be part of euphoria that may extend upto 164.17 (if sentiment allows); corrective 5th may end around 50-53 and then final thrust towards new high (5th) should begin. (If , moves past 80-83 without 5th correction , corrective wave count will be invalid).
Labelling of counts can be wrong in this, but you get the idea.

Sonata Software - Bullish OpportunityWe have a bullish opportunity for Sonata Software - positional long:
- Trend seems to be upwards on Monthly and Weekly TFs
- On 1 Day TF, we have price reacting upwards from nearest 1-D Demand Zone
- As per Elliott Wave model, price is forming bullish impulse wave upwards as shown in the chart. Currently, it seems to be forming a good solid 3rd Wave upwards on 1-D TF
- Entry can be done at 620-625ish and Targets can be 650, 688, 700 for immediate swings. If the momentum carries forward, we will revisit for exact target of when 3rd wave completes later.

R-Power Bullish opportunitySince, there is a good flow of news on this stock, let's analyze it from technical standpoint for positional long bet.
In the chart (Weekly):
- We seem to be in primary impulse 3rd wave of which we have created sub impulse waves 1-2-3-4 (colored in yellow)
- The yellow colored 3rd may have either terminated at 50 and is coming towards 34 for completing yellow colored 4th wave OR the price may go up from here itself and touch yellow 3rd wave of target of 60ish and then some consolidation may happen
- Also, note we have a good strong weekly demand zone at 32-34ish and price if enters here again, can be a good long bet with excellent risk reward

Insecticides India - Bullish OpportunityWe have a bullish opportunity for Insecticides India - positional long:
- Trend seems to be upwards on Monthly and Weekly TFs
- On 1 Day TF, we have price reacting upwards from nearest 1-D Demand Zone
- As per Elliott Wave model, price is forming bullish impulse wave upwards as shown in the chart. Currently, it seems to be just starting to initiate a 5th wave upwards on 1-D TF
- We will wait for proper impulse formation until price crosses 855ish and then time an entry on hourly or 75 Mins TF chart. As of now, this is on my radar/watchlist.

CDSL: Moving as expected, what's next?As predicted, CDSL is in wave 4 now.
Wave 4 is Zig-zag correction in nature.
Currently, it looks like we are in wave C of zigzag.
The targets for this wave C are minimum 61.8% , next targets will be 100% at both these levels we have cluster of fib levels. At these levels wave 4 may complete.
It means, at these levels we can have buying opportunity for wave 5.
But buying is only if there is any bullish candlestick pattern is formed.
For educational purposes only.
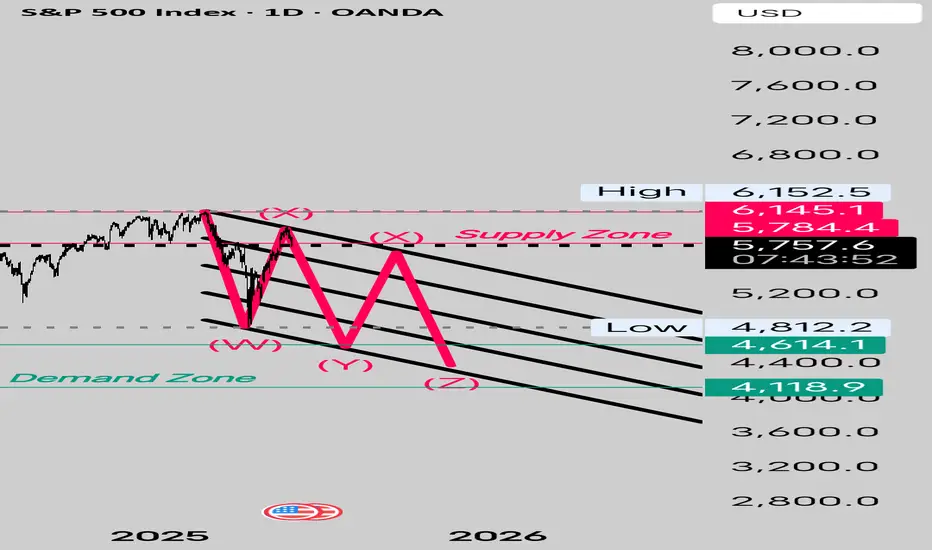
SPX500 Ready for Wave C of The Triple Combo Elliot waves
SPX500 Has rejected from Supply Zone at 0.854 Fib retracement
These are the Marked Circles from where some Bounces are expected.
Though less likely to be meaningful.
Fib Extensions Suggest the Wave C could upto 4300. Finally Testing the Demand Zone.
End of the Drop? Tata Motors Sets Stage for Wave 3Tata Motors has completed a clear five-wave advance from the April low of 535.75 to a high near 742, which is being marked as wave 1. After that peak, the stock entered a corrective phase and has now dropped into what appears to be an a-b-c structure (expanding flat), likely forming wave 2. The recent decline has reached the 1.618 extension of wave a, with wave c possibly ending near 672.
This 1.618 level is often where deeper corrections tend to exhaust, and price has also moved below the lower edge of the Bollinger Band, which can signal short-term pressure easing. These two conditions together suggest that the current downmove may be ending. If this count is correct, the next move should be a fresh upward rally in the form of wave 3.
For this idea to stay valid, wave 2 must not fall below the April low at 535.75, which serves as the key invalidation level. Until then, the setup remains constructive, with early signs pointing to a possible bounce from here.
Disclaimer: This analysis is for educational purposes only and does not constitute investment advice. Please do your own research (DYOR) before making any trading decisions.

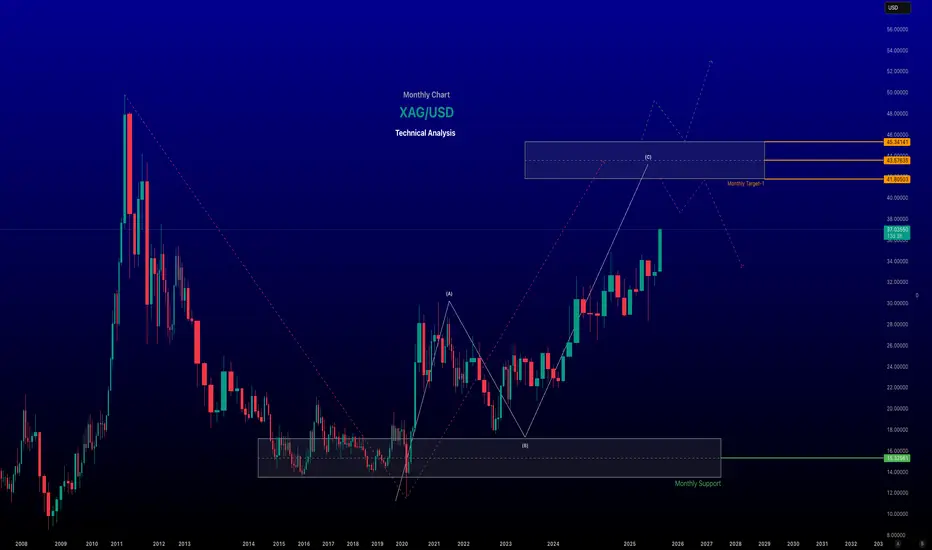
XAG/USD (Silver Spot vs. US Dollar) Analysis - Monthly Chart ~~ XAG/USD (Silver Spot vs. US Dollar) Analysis ~~
#Current Price and Recent Performance
As of June 18, 2025, the XAG/USD spot price is approximately $37.00 per troy ounce at the time of posting, reflecting a 13-year high. Silver has surged nearly 30% year-to-date in 2025, driven by heightened safe-haven demand amid geopolitical tensions, particularly in the Middle East, and global economic uncertainties. Over the past month, silver prices have risen by 12.43%, and year-over-year, they are up 23.33%.
-- Key Drivers of Recent Trends
Geopolitical Tensions: Escalating conflicts, such as Israel’s military actions in Iran, have boosted demand for safe-haven assets like silver and gold. This has been a significant catalyst for silver’s rally, with prices climbing in tandem with gold.
US Dollar Weakness: A softer US dollar, influenced by expectations of Federal Reserve rate cuts and softer inflation data, has supported higher silver prices. Since silver is priced in USD, a weaker dollar makes it more affordable for foreign investors, increasing demand.
Industrial Demand: Silver’s dual role as a precious and industrial metal (used in electronics, solar panels, and medical devices) accounts for ~56% of its demand. Growing industrial applications, particularly in green technologies, continue to support price growth.
Supply Constraints: A persistent supply deficit of 150–200 million ounces annually (10–20% of total supply) and declining above-ground inventories by nearly 500 million ounces in recent years have tightened the market, pushing prices higher.
Speculative Activity: Futures and spot market trading on exchanges like COMEX and the London Bullion Market, coupled with speculative interest, contribute to price volatility. The market is also influenced by “paper silver” (futures, ETFs), which some argue suppresses physical silver prices.
~~Technical Analysis~~
Current Levels and Trends: Silver is trading above the key support zone of $34.90–$35.15, maintaining a bullish outlook. Recent suggest a strong bullish trend, with a breakout above a downward trend line and minor resistance on the 4-hour chart.
Support and Resistance:
Support: Key levels include $34.99, $33.70, $32.67, and the 0.618 Fibonacci retracement at ~$35.00.
Resistance: Immediate resistance lies at $37.85, with further targets at $38.00 and potentially $40.34–$44.21 in the coming weeks or months.
-- Disclaimer --
This analysis is based on recent technical data and market sentiment from web sources. It is for informational purposes only and not financial advice. Trading involves high risks, and past performance does not guarantee future results. Always conduct your own research or consult a SEBI-registered advisor before trading.
#Boost and comment will be highly appreciated
ROTOROTO is showing good strength and currently trading above previous resistance line. It is in to consolidation phase. It seems like accumulation has been observed in recent sessions. Now as long as it is closing above 279 then ROTO is very strong and available at very good risk-reward. One may expect 12% to 21% in next rally once it comes from consolidation phase.

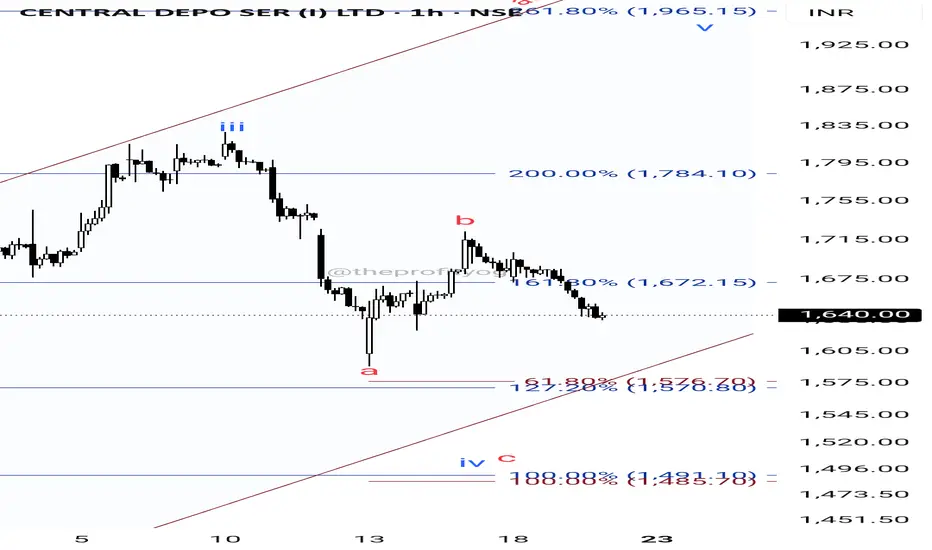
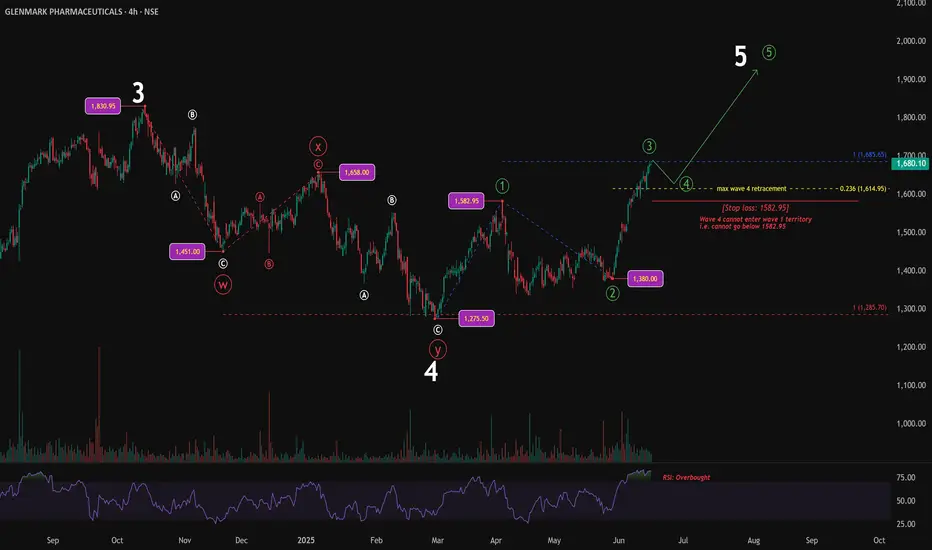
Wave 3 Completes, All Eyes on 1582.95After completing a W-X-Y corrective structure, price has started moving higher in what appears to be a new impulse wave. Within this sequence, Wave 3 seems to have topped at 1685.65, which is 100% of Wave 1 measured from the Wave 2 low — a common relationship in impulse extensions.
Wave 1 had ended at 1582.95, and Wave 2 retraced deeply to 1380, falling beyond the 0.618 Fibonacci level. As per the rule of alternation, since Wave 2 was deep, Wave 4 is expected to be shallow. A possible support zone lies near the 0.236 retracement level at 1614.95.
For the structure to remain valid, Wave 4 must stay above the Wave 1 high. If price breaks below 1582.95, it would invalidate the current impulse count and suggest that this may not be Wave 5.
RSI reached the overbought zone during the final part of Wave 3, which supports the idea of a pullback unfolding. As long as price respects the invalidation level, the setup remains intact and points toward a potential Wave 5 advance.
The chart will be updated as price action evolves.
Disclaimer: This analysis is for educational purposes only and does not constitute investment advice. Please do your own research (DYOR) before making any trading decisions.
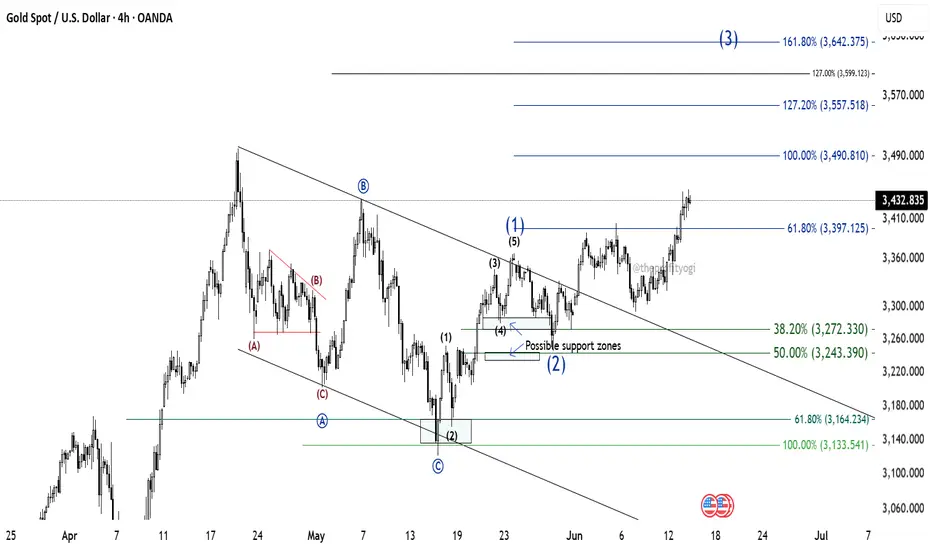
GOLD: Further levels using Elliott Wave TheoryWe successfully forecasted the path of gold in our post on May 12th.
Now, GOLD is looking like it's entering an impulse wave.
Wave (1) of this impulse was completed on 23rd May. The price then falls between the zone 38.2% and 50% to form wave (2). This was also predicted by us.
Currently, GOLD is in wave (3).
Now, to get the targets of wave (3), we have two possibilities.
1. Wave (3) goes to 100% and then reverses. This case is of the Terminal impulse. And the further path of GOLD can be predicted later.
2. Wave (3) goes to 161.8% (minimum). This is the case of Trending or normal impulse. And further path of GOLD can be predicted accordingly.
For now, GOLD is looking like going to touch at least the 100% (3490.81) level.
This analysis is based on Elliott Wave theory and Fibonacci.
This analysis is for educational purposes only.
This is not any buying recommendations.
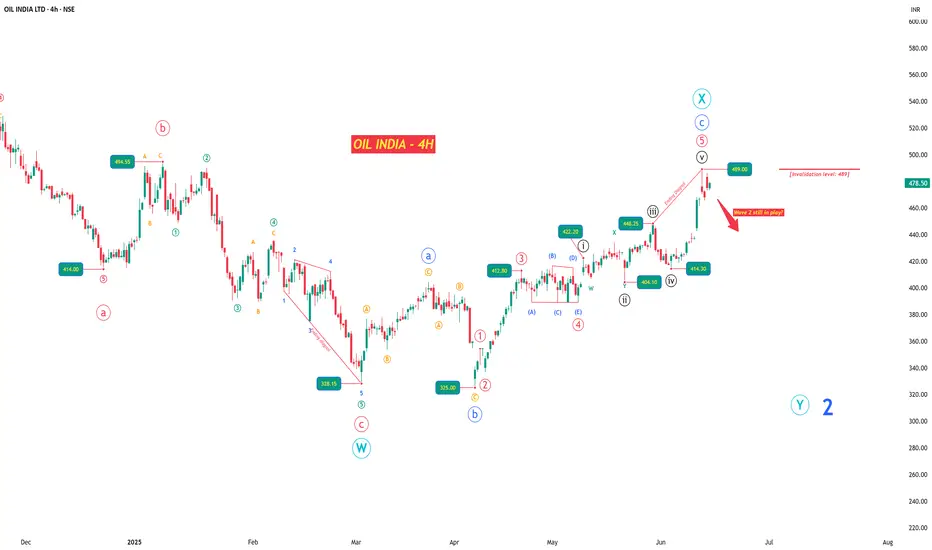
OIL INDIA LTD – Structure Tiring as Crude Starts Firing?What began as a heroic rally from ₹42 to ₹767 in a powerful impulse now finds itself wobbling under its own weight. OIL INDIA LTD’s chart tells a story of exhaustion — both structurally and contextually — just when crude oil is flexing again on the global stage.
Amid rising geopolitical tensions and war-like murmurs pushing crude prices higher, the Indian oil sector may be sailing into headwinds. And this isn’t just a macro hunch — the waves themselves are flashing caution.
After a Wave 1 climax near ₹767.90, price action has shifted into a corrective mode. I interpret the ongoing structure as a W-X-Y double zigzag , and within it, a key event unfolded: a classic ABC flat correction, beginning in March.
The April rally — which at first glance looks like a fresh impulse — is in fact the C leg of that flat. While it did unfold in 5 waves, the fifth wave formed an ending diagonal , complete with overlapping internals and fading momentum. This could be the last gasp .
Zooming into the 4H chart, the rise from ₹325 to ₹489 fits neatly into a corrective framework, not an impulsive one. That makes ₹489 a crucial invalidation level . If price stays below it, we likely begin Wave Y of the broader correction — a move that could push OIL INDIA back toward or even below ₹325.
However, if price breaches ₹489 and sustains, that’s your early signal that this entire bearish setup is off, and a new bullish sequence may be unfolding instead.
The stop-loss is tight, the downside wide. If this count holds, the risk-reward setup is highly favorable.
Further analysis continues in the notes below — covering multi-timeframe wave counts, internal structures, and confluences from RSI, volume, and Bollinger Bands.
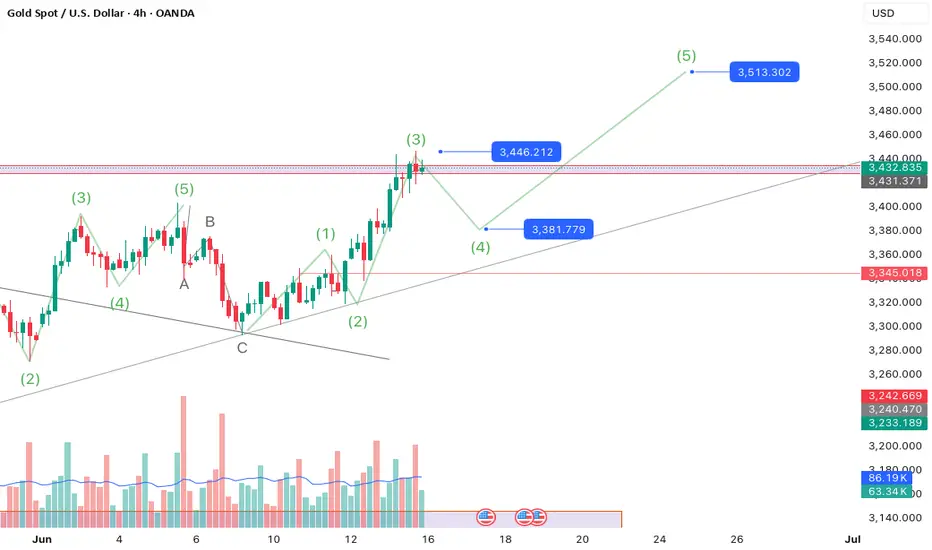
Gold 4 hour Elliot Wave AnalysisThe current state of the market shows that we are in Wave 3. This is currently at 1.618 of Wave 1 possibly making one alert to near the end of this. This is being confirmed by liquidity sweep on the 1 hour time frame at the top. We can enter Wave 4 which shows a 500 pip decline to near 3380 levels. Post this we will start Wave 5 which can take us to 3515 levels which will be Fibonacci extension of 1 of Wave 3. After this it is possible to see a big fall. Will update when we get there.
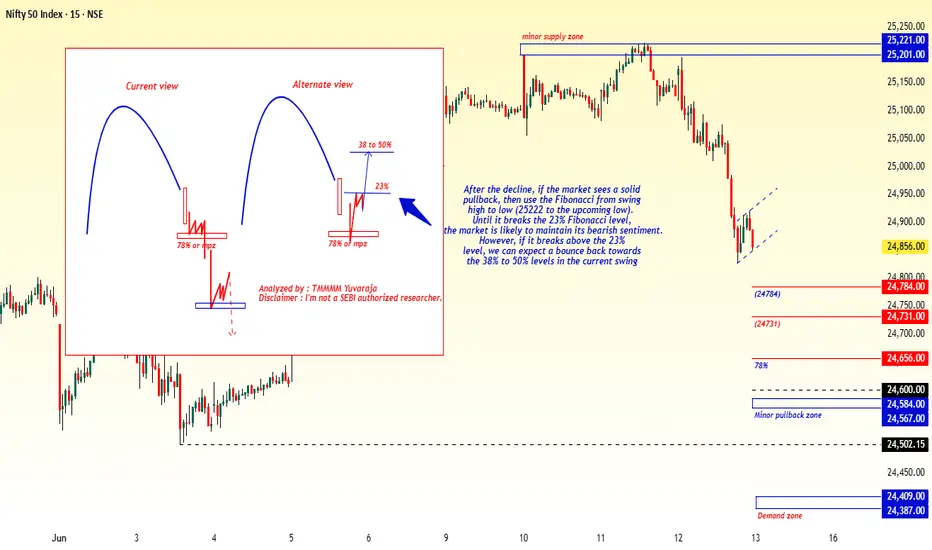
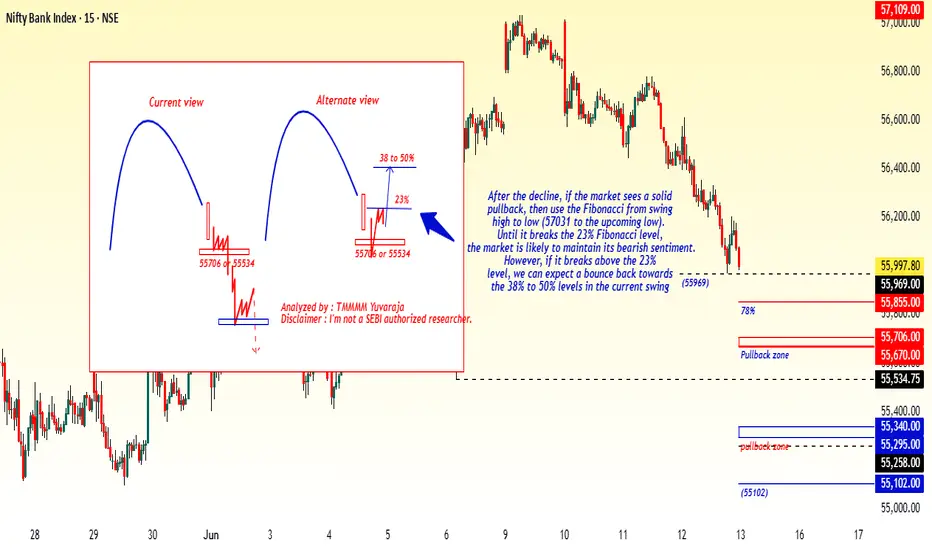
#Banknifty directions and levels for June 13th:Current View
The current view suggests that if the market sustains the gap-down and breaks immediate support levels, we can anticipate further continuation of the correction, possibly with some consolidation.
Alternate View
The alternate view suggests that if the gap-down does not sustain and the market experiences a solid pullback, it may re-enter a range-bound scenario. This means that until it breaks the 23% Fibonacci level, the market is likely to maintain its bearish sentiment. However, if it breaks above the 23% level, we could expect a bounce back towards the 38% to 50% levels in the current swing."
#Nifty directions and levels for June 13th:"Good morning, Friends! 🌞
Here are the market directions and levels for June 13th:
Market Overview
Several external factors have led to a significant decline in both global and local markets this morning. Consequently, Gift Nifty is indicating a negative start of 280 points.
So, what can we expect today?
Based on current sentiment, if the market opens with a large gap-down, the overall bias will shift to negative. However, this could be a temporary scenario, and it's difficult to predict how the market will react to this incident. If the decline sustains structurally, it could signal the third wave of a correction. Therefore, the market may continue to move downwards, potentially with some consolidation, as the fourth wave is typically a consolidation wave, followed by a fifth wave of trend continuation (correction). Let's examine the chart.
Current View
The current view suggests that if the market sustains the gap-down and breaks immediate support levels, we can anticipate further continuation of the correction, possibly with some consolidation.
Alternate View
The alternate view suggests that if the gap-down does not sustain and the market experiences a solid pullback, it may re-enter a range-bound scenario. This means that until it breaks the 23% Fibonacci level, the market is likely to maintain its bearish sentiment. However, if it breaks above the 23% level, we could expect a bounce back towards the 38% to 50% levels in the current swing."