ROTOROTO is showing good strength and currently trading above previous resistance line. It is in to consolidation phase. It seems like accumulation has been observed in recent sessions. Now as long as it is closing above 279 then ROTO is very strong and available at very good risk-reward. One may expect 12% to 21% in next rally once it comes from consolidation phase.
Elliott Wave

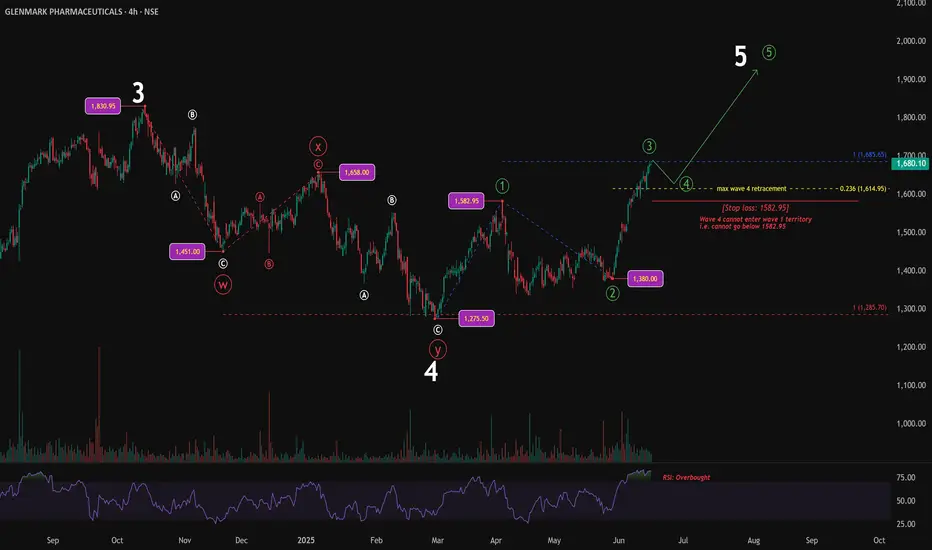
Wave 3 Completes, All Eyes on 1582.95After completing a W-X-Y corrective structure, price has started moving higher in what appears to be a new impulse wave. Within this sequence, Wave 3 seems to have topped at 1685.65, which is 100% of Wave 1 measured from the Wave 2 low — a common relationship in impulse extensions.
Wave 1 had ended at 1582.95, and Wave 2 retraced deeply to 1380, falling beyond the 0.618 Fibonacci level. As per the rule of alternation, since Wave 2 was deep, Wave 4 is expected to be shallow. A possible support zone lies near the 0.236 retracement level at 1614.95.
For the structure to remain valid, Wave 4 must stay above the Wave 1 high. If price breaks below 1582.95, it would invalidate the current impulse count and suggest that this may not be Wave 5.
RSI reached the overbought zone during the final part of Wave 3, which supports the idea of a pullback unfolding. As long as price respects the invalidation level, the setup remains intact and points toward a potential Wave 5 advance.
The chart will be updated as price action evolves.
Disclaimer: This analysis is for educational purposes only and does not constitute investment advice. Please do your own research (DYOR) before making any trading decisions.
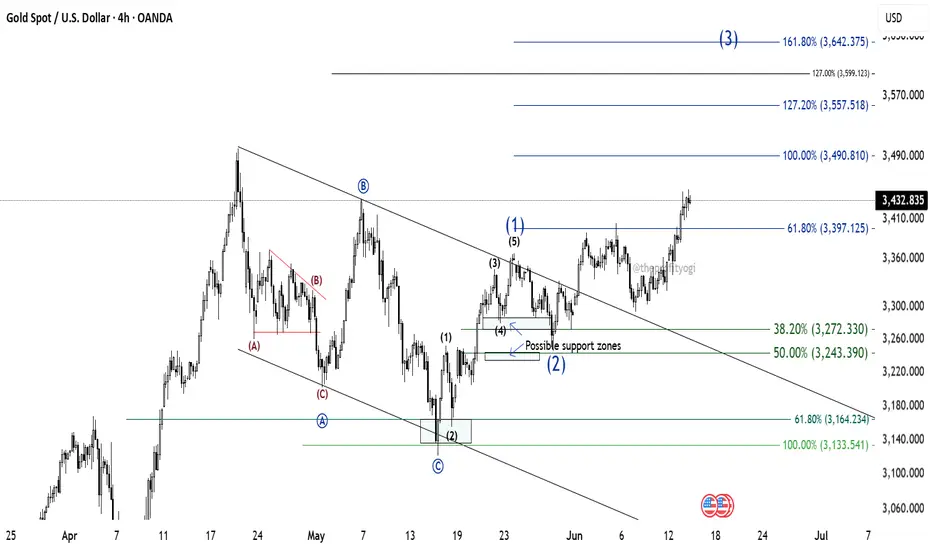
GOLD: Further levels using Elliott Wave TheoryWe successfully forecasted the path of gold in our post on May 12th.
Now, GOLD is looking like it's entering an impulse wave.
Wave (1) of this impulse was completed on 23rd May. The price then falls between the zone 38.2% and 50% to form wave (2). This was also predicted by us.
Currently, GOLD is in wave (3).
Now, to get the targets of wave (3), we have two possibilities.
1. Wave (3) goes to 100% and then reverses. This case is of the Terminal impulse. And the further path of GOLD can be predicted later.
2. Wave (3) goes to 161.8% (minimum). This is the case of Trending or normal impulse. And further path of GOLD can be predicted accordingly.
For now, GOLD is looking like going to touch at least the 100% (3490.81) level.
This analysis is based on Elliott Wave theory and Fibonacci.
This analysis is for educational purposes only.
This is not any buying recommendations.
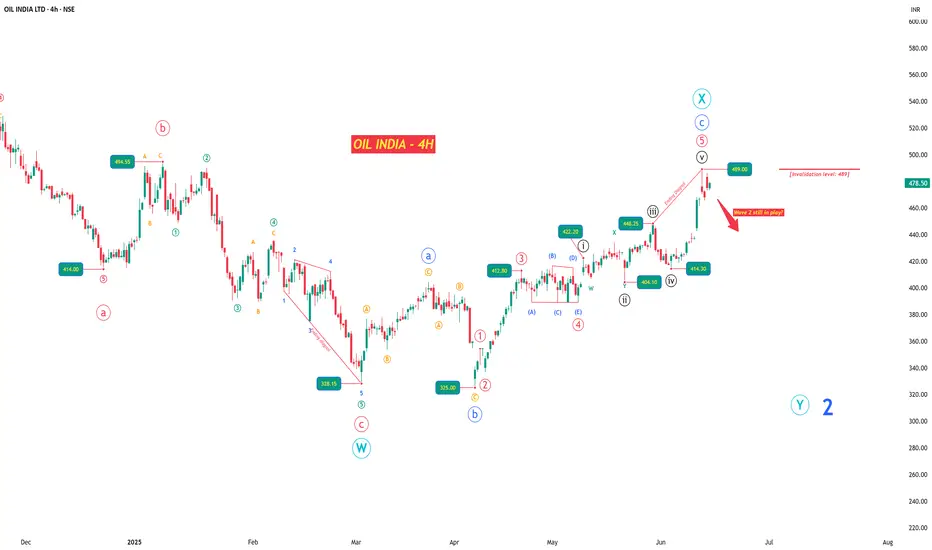
OIL INDIA LTD – Structure Tiring as Crude Starts Firing?What began as a heroic rally from ₹42 to ₹767 in a powerful impulse now finds itself wobbling under its own weight. OIL INDIA LTD’s chart tells a story of exhaustion — both structurally and contextually — just when crude oil is flexing again on the global stage.
Amid rising geopolitical tensions and war-like murmurs pushing crude prices higher, the Indian oil sector may be sailing into headwinds. And this isn’t just a macro hunch — the waves themselves are flashing caution.
After a Wave 1 climax near ₹767.90, price action has shifted into a corrective mode. I interpret the ongoing structure as a W-X-Y double zigzag , and within it, a key event unfolded: a classic ABC flat correction, beginning in March.
The April rally — which at first glance looks like a fresh impulse — is in fact the C leg of that flat. While it did unfold in 5 waves, the fifth wave formed an ending diagonal , complete with overlapping internals and fading momentum. This could be the last gasp .
Zooming into the 4H chart, the rise from ₹325 to ₹489 fits neatly into a corrective framework, not an impulsive one. That makes ₹489 a crucial invalidation level . If price stays below it, we likely begin Wave Y of the broader correction — a move that could push OIL INDIA back toward or even below ₹325.
However, if price breaches ₹489 and sustains, that’s your early signal that this entire bearish setup is off, and a new bullish sequence may be unfolding instead.
The stop-loss is tight, the downside wide. If this count holds, the risk-reward setup is highly favorable.
Further analysis continues in the notes below — covering multi-timeframe wave counts, internal structures, and confluences from RSI, volume, and Bollinger Bands.
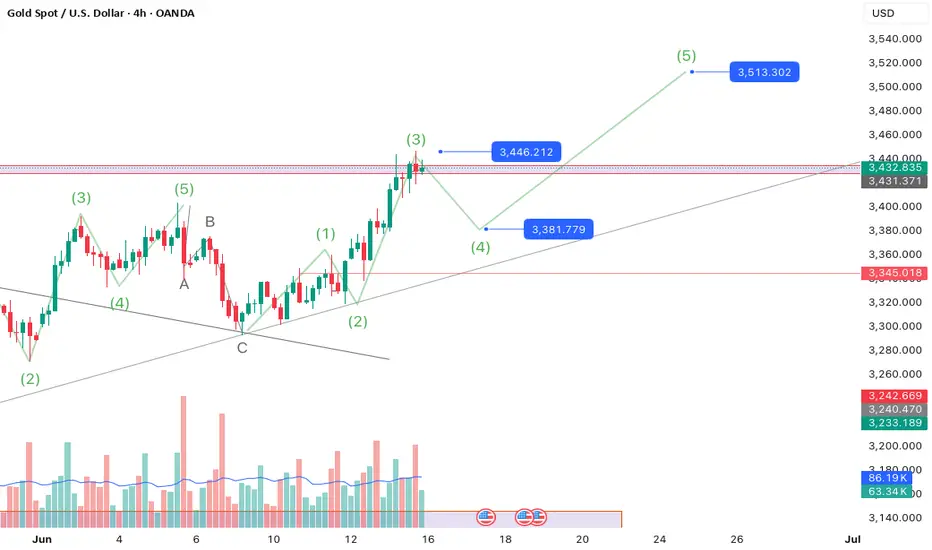
Gold 4 hour Elliot Wave AnalysisThe current state of the market shows that we are in Wave 3. This is currently at 1.618 of Wave 1 possibly making one alert to near the end of this. This is being confirmed by liquidity sweep on the 1 hour time frame at the top. We can enter Wave 4 which shows a 500 pip decline to near 3380 levels. Post this we will start Wave 5 which can take us to 3515 levels which will be Fibonacci extension of 1 of Wave 3. After this it is possible to see a big fall. Will update when we get there.
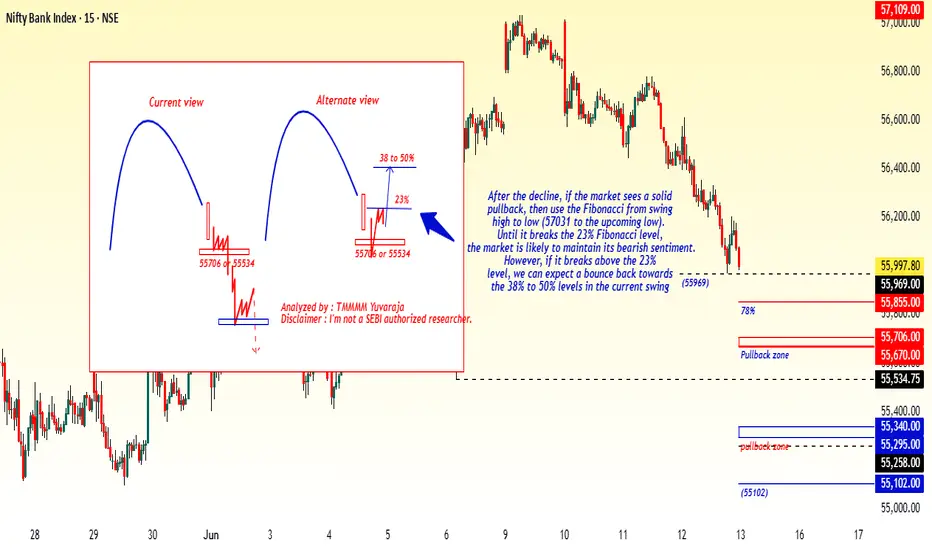
#Banknifty directions and levels for June 13th:Current View
The current view suggests that if the market sustains the gap-down and breaks immediate support levels, we can anticipate further continuation of the correction, possibly with some consolidation.
Alternate View
The alternate view suggests that if the gap-down does not sustain and the market experiences a solid pullback, it may re-enter a range-bound scenario. This means that until it breaks the 23% Fibonacci level, the market is likely to maintain its bearish sentiment. However, if it breaks above the 23% level, we could expect a bounce back towards the 38% to 50% levels in the current swing."
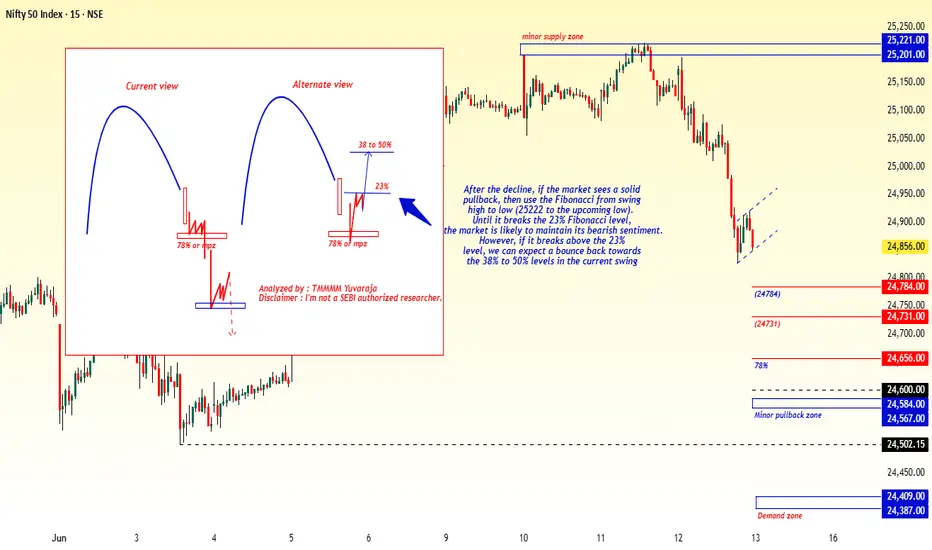
#Nifty directions and levels for June 13th:"Good morning, Friends! 🌞
Here are the market directions and levels for June 13th:
Market Overview
Several external factors have led to a significant decline in both global and local markets this morning. Consequently, Gift Nifty is indicating a negative start of 280 points.
So, what can we expect today?
Based on current sentiment, if the market opens with a large gap-down, the overall bias will shift to negative. However, this could be a temporary scenario, and it's difficult to predict how the market will react to this incident. If the decline sustains structurally, it could signal the third wave of a correction. Therefore, the market may continue to move downwards, potentially with some consolidation, as the fourth wave is typically a consolidation wave, followed by a fifth wave of trend continuation (correction). Let's examine the chart.
Current View
The current view suggests that if the market sustains the gap-down and breaks immediate support levels, we can anticipate further continuation of the correction, possibly with some consolidation.
Alternate View
The alternate view suggests that if the gap-down does not sustain and the market experiences a solid pullback, it may re-enter a range-bound scenario. This means that until it breaks the 23% Fibonacci level, the market is likely to maintain its bearish sentiment. However, if it breaks above the 23% level, we could expect a bounce back towards the 38% to 50% levels in the current swing."
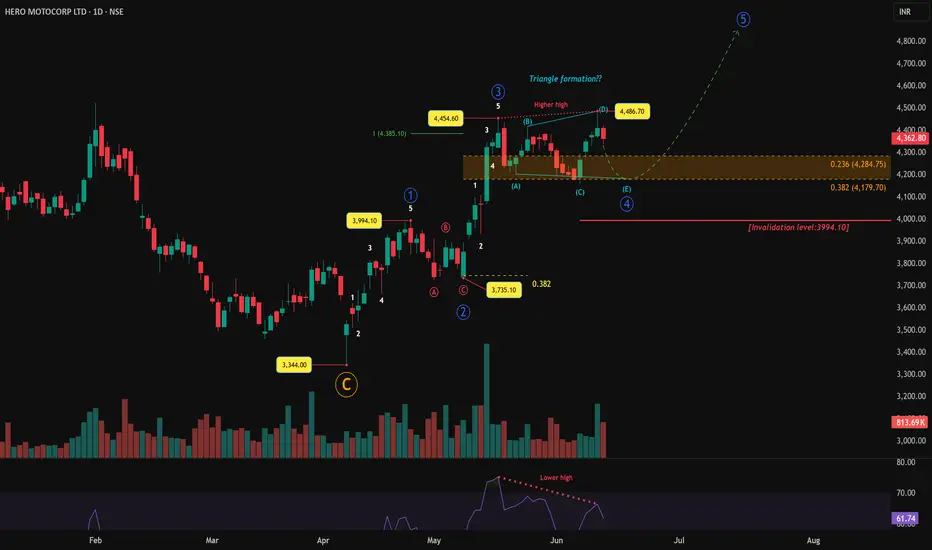
The Silent Power of Wave 4: Why You Shouldn’t Ignore TrianglesMarkets often scream during impulse waves but whisper during corrections. Yet it’s in those quiet phases—especially Wave 4 corrections—that the next big move is born. HERO MOTOCORP’s current price action may just be one of those setups that rewards the patient.
Spotting the Triangle in Wave 4
After a strong Wave 3 high at ₹4,454.60, the price began consolidating. Instead of a sharp drop, a sideways grind with overlapping price action began unfolding—classic signs of a triangle possibly forming. So far, the internal structure appears to be evolving as an (A)-(B)-(C)-(D)-(E) formation, although the triangle is not yet confirmed . The final leg (E) is pending, and until a proper breakout with impulsive character occurs, this remains a working hypothesis.
The retracement zone between 0.236 (₹4,284.75) and 0.382 (₹4,179.70) of Wave 3 has held price so far. This shallow pullback supports the idea of a triangle, which is typically more time-consuming than other corrective forms.
RSI Divergence: A Sign of Weakness
There’s also a noticeable RSI divergence in play. While price made a higher high, RSI printed a lower high—a clue that momentum is cooling. This supports the idea that Wave 3 ended and Wave 4 is underway. Momentum cooling during a triangle formation is common, as the market pauses before its next move.
Volume Behavior
Volume spikes during impulsive waves and contracts during consolidations. HERO’s chart reflects just that—volume expanded strongly during Wave 3 and has dried up during this suspected Wave 4. This aligns well with triangle behavior, where uncertainty reduces participation before the breakout.
Invalidation Level and Risk Clarity
₹3,994.10—Wave 1’s top—acts as the invalidation level. If price breaks below this, the current wave structure becomes invalid and must be recounted. As long as this level holds, the bullish bias remains intact. A breakout above the Wave 3 high with conviction could mark the beginning of Wave 5.
Since Wave 4 hasn’t completed, potential targets for Wave 5 can only be projected once it ends. Typically, Wave 5 can extend to 1x or 1.618x of Wave 1, measured from the end of Wave 4—once its final low is in place.
Final Thoughts
Triangles are often ignored. But in Elliott Wave Theory, they are hidden launchpads—silent phases that precede explosive moves. HERO MOTOCORP might be presenting one such opportunity. If the triangular structure completes cleanly and holds key levels, a fresh impulse could be unfolding.
Chart will be updated as price action evolves.
Disclaimer: This analysis is for educational purposes only and does not constitute investment advice. Please do your own research (DYOR) before making any trading decisions.
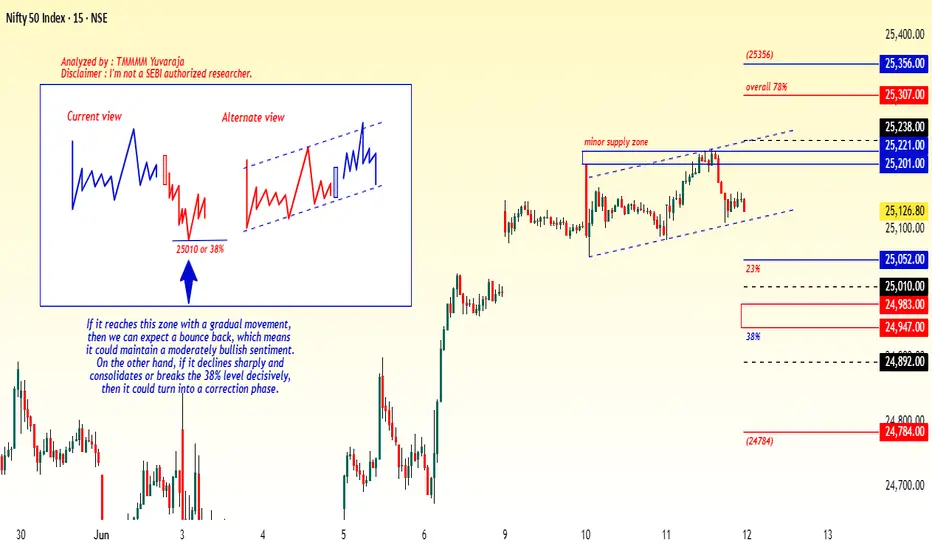
#Nifty directions and levels for June 12th:Good morning, Friends! 🌞
Here are the market directions and levels for June 12th:
Market Overview
Today as well, there have been no major changes in either the global or local markets. Both are showing a moderately bullish sentiment. Meanwhile, Gift Nifty indicates a neutral to slightly gap-up start of around 30 points.
So, what can we expect today?
There’s still no change in the market structure—Nifty is showing a moderately bullish bias, while Bank Nifty is showing a bearish bias. This makes the direction a bit difficult to predict.
However, my expectation is: even if the market opens positively, it may not sustain. Initially, we can expect a minor correction. If it breaks the support, then the correction may continue. On the other hand, if it pulls back from support, then it may re-enter a range-bound market.
Let’s look at the charts.
Current View
The current view suggests that if the market reaches the immediate support level with a gradual movement, we can expect a bounce back, which would mean it may continue to hold a moderately bullish sentiment.
However, if it declines sharply and consolidates or breaks the immediate support level decisively, then it could enter a correction phase.
Alternate View
The alternate view says: if the gap-up sustains structurally, we can expect only a minor rally. However, if a solid bullish candle forms, we may consider entering a directional trade.
#Banknifty directions and levels for June 12th:Current View
The current view suggests that if the market reaches the immediate support level with a gradual movement, we can expect a bounce back, which would mean it may continue to hold a moderately bullish sentiment.
However, if it declines sharply and consolidates or breaks the immediate support level decisively, then it could enter a correction phase.
Alternate View
The alternate view says: if the gap-up sustains structurally, we can expect only a minor rally. However, if a solid bullish candle forms, we may consider entering a directional trade.

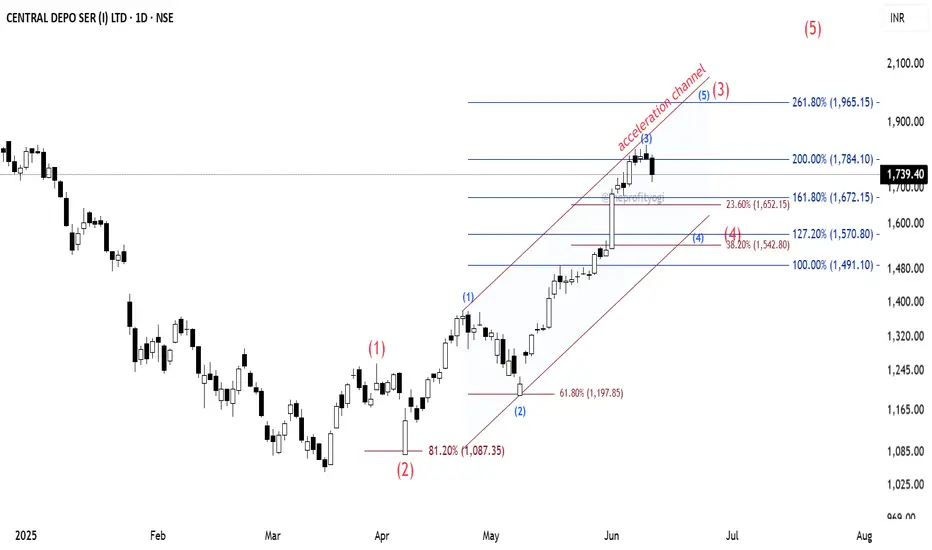
CDSL: Elliott Wave AnalysisThe CDSL daily chart indicates that the stock is in an impulse.
See the counting using Elliott Wave theory where the major wave (2) (shown in red) bounced from the 81.2% level to enter into wave (3).
The subordinate of wave (3) are shown in blue colour, where we can see the subordinate wave (2) of major wave (3) bounced from 61.8%.
To get the possible projection of the subordinate wave (3), I have applied Fibonacci extension to it, and we can see the price is at 200% extension currently. If the recent high is not broken up, we can presume that this is the top of wave (3).
Now, wave (4) will form. And for predicting wave (4) target that I have plotted the Acceleration Channel. This channel can be plotted by joining the line from the top of wave (1) to the top of wave (3) and then its parallel line from the bottom of wave (2).
This channel gives us a hint about where wave (4) may terminate.
Also, I have applied Fibonacci retracement from the bottom of wave (1) to the top of wave (3), and as we know that wave (4) may terminate between 23.6% and 38.2% levels.
So we can get some idea about where wave (4) may complete.
We can see there are clusters of Fib extension and retracement levels near these zones. So we may have a safe buying zone between those.
Important: Here, I have assumed that the subordinate wave (3) is completed.
If the price crosses above the recent top, then we have to replot and recount this study.
This analysis is based on Elliott Wave theory and Fibonacci.
This analysis is for educational purposes only.
This is not any buying recommendations.
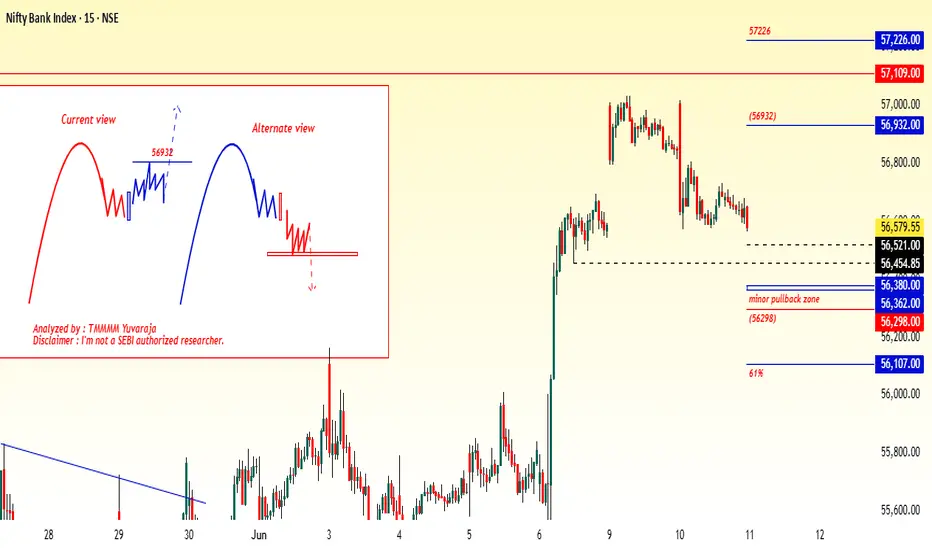
#Banknifty directions and levels for June 11th:Current View
If the market starts with a gap-up and sustains, we can expect consolidation near the previous high. If it then breaks above the previous high, we may see continuation of the rally.
Alternate View
If the gap-up does not sustain and the market breaks below the pullback zone effectively, we can expect the correction to continue. On the other hand, if the market finds support around the minor pullback zone, it may continue to trade in a range-bound structure
#Nifty directions and levels for June 11th:Good morning, Friends! 🌞
Here are the market directions and levels for June 11th:
Market Overview
There have been no major changes in both the global and local markets. They are still showing a moderately bullish sentiment. Meanwhile, Gift Nifty indicates a neutral to slightly gap-up start of around 30 points.
So, what can we expect today?
As per the structure, Nifty continues to hold a bullish bias, but Bank Nifty is showing a slightly negative bias. One more important point to note: today is a full moon day according to the calendar. As per Astro theory, full moon days (including one day before and after) are typically known for increased volatility.
My expectation is that we are currently in a minor range, so we can expect a directional move once the market breaks this range.
Let’s look at the charts.
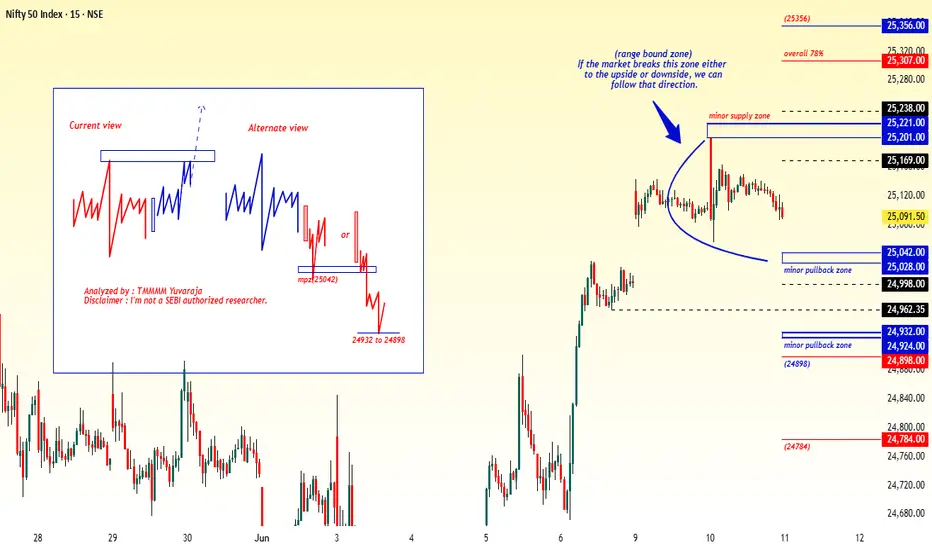
Current View
If the market starts with a gap-up and sustains, we can expect consolidation near the previous high. If it then breaks above the previous high, we may see continuation of the rally.
Alternate View
If the gap-up does not sustain and the market breaks below the pullback zone effectively, we can expect the correction to continue. On the other hand, if the market finds support around the minor pullback zone, it may continue to trade in a range-bound structure.
#Nifty directions and levels for June 10th:Good morning, Friends! 🌞
Here are the market directions and levels for June 10th:
Market Overview
Both the global market and our local market are showing moderately bullish sentiment. Meanwhile, Gift Nifty indicates a gap-up start of around 60 points.
So, what can we expect today?
In the previous session, both Nifty and Bank Nifty opened with a gap-up but didn’t perform much afterward. Today’s structure seems somewhat similar, so my expectation is that the same kind of move might happen again.
Let’s look at the charts.
The chart sentiment appears to be similar for both Nifty and Bank Nifty in today’s session.
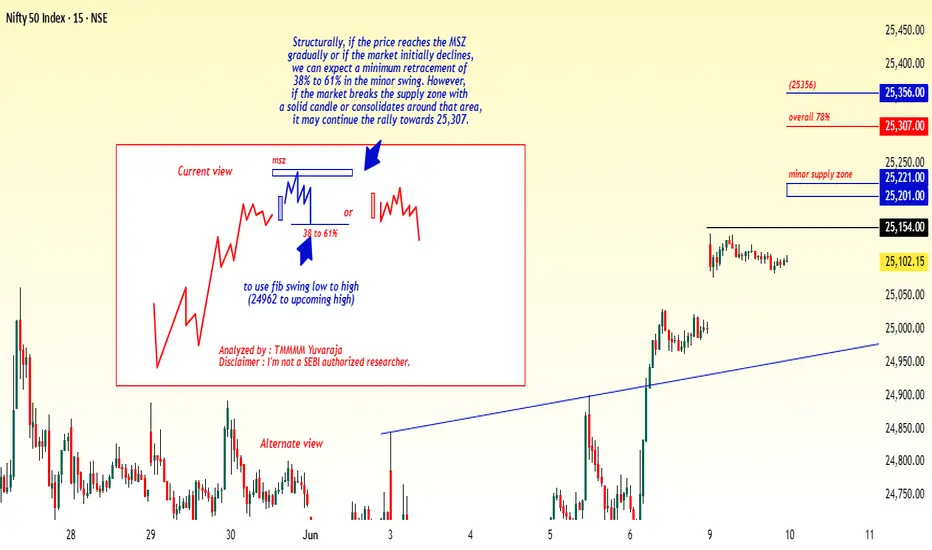
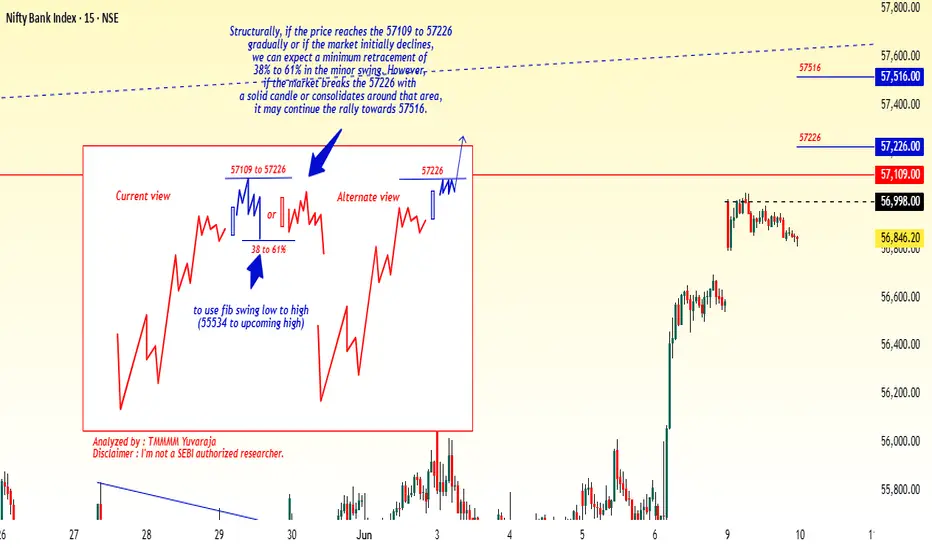
Current View
> The current view suggests that if the market reaches the immediate resistance gradually and faces rejection there, we can expect a minimum retracement of 38% to 61% in the minor swing.
> In this case, if the market declines initially, it may consolidate for a while—similar to yesterday's performance.
Alternate View
> e alternate view says that if the market breaks the immediate resistance with a strong rally or consolidates around that level, we can expect the rally to continue.
#Banknifty directions and levels for June 10th:Current View
> The current view suggests that if the market reaches the immediate resistance gradually and faces rejection there, we can expect a minimum retracement of 38% to 61% in the minor swing.
> In this case, if the market declines initially, it may consolidate for a while—similar to yesterday's performance.
Alternate View
> e alternate view says that if the market breaks the immediate resistance with a strong rally or consolidates around that level, we can expect the rally to continue.
BUY GOLDIt is possible that there is a Buy opportunity . We should wait for confirmation before entering like 1H or 4H wick rejection in buy zone area and retest trand line . If the confirmation is negative, then we should exit the trade. If the confirmation is positive, then we can enter the trade.

Apollo Tyres: Navigating the WavesWelcome to RK_Chaarts.
Today, we're analysing the daily time frame chart of Apollo Tyres from Elliott waves perspective. Here, we can clearly see that the intermediate-degree Wave (3) (blue) formed a high around ₹555 in February 2024. After that, an A-B-C corrective pattern unfolded in a 3-3-5 expanded flat structure, which is Wave (4) blue intermediate-degree. We can say that Wave (4) possibly ended at the March 2025 low around ₹370.
Now, we're possibly unfolding Wave (5) in blue of the intermediate degree, which will have five sub-divisions: of minor-degree Waves 1-5 (red). Possibly, Wave 1 (red) has ended, and Wave 2 (red) is currently unfolding. After Wave 2 ends, the price may reverse upwards, forming Wave 3, followed by Wave 4's retracement and then Wave 5's high.
Where can be next possible reversal
On the weekly timeframe, the price is moving within the upper Bollinger Band zone. The weekly 20-Weekly simple moving average (or 20-week simple moving average), which is the mid-Bollinger Band, is around ₹440-₹437. It's possible that Wave 2 will find support around this level and then reverse upward.
Invalidation level
Note that Wave 2 cannot retreat more than 100% of Wave 1, according to wave theory principles. The low of ₹371, where Wave 1 began, is the invalidation level. If the price breaks below this level, it may trigger an invalidation, and we might be looking at a double correction or a double three structure instead.
Projected Targets
However, if the invalidation level holds, the upward movement will likely continue. The projected target for Wave 5 could be around ₹555-₹603, based on the ratio analysis of Waves (3) and (4).
Important Notes
- Breaking below the invalidation level would require re-evaluation of the wave count.
- Sustaining above the invalidation level increases confidence in the projected target.
Let's see how the market unfolds. This entire study is shared solely for educational purposes. Thank you so much.
I am not Sebi registered analyst.
My studies are for educational purpose only.
Please Consult your financial advisor before trading or investing.
I am not responsible for any kinds of your profits and your losses.
Most investors treat trading as a hobby because they have a full-time job doing something else.
However, If you treat trading like a business, it will pay you like a business.
If you treat like a hobby, hobbies don't pay, they cost you...!
Hope this post is helpful to community
Thanks
RK💕
Disclaimer and Risk Warning.
The analysis and discussion provided on in.tradingview.com is intended for educational purposes only and should not be relied upon for trading decisions. RK_Chaarts is not an investment adviser and the information provided here should not be taken as professional investment advice. Before buying or selling any investments, securities, or precious metals, it is recommended that you conduct your own due diligence. RK_Chaarts does not share in your profits and will not take responsibility for any losses you may incur. So Please Consult your financial advisor before trading or investing.

Living on the edge It seems to have completed 5 wave move with negative divergence of RSI . At least book profits. A pattern failure would happen after 6086 . Till then expect a correction till wave 4 of one lesser degree. Since it is a powerful wave 3 till will take time to correct.

Waves Gone Wild: Understanding Complex CorrectionsUntangling the Mystery of Complex Corrections – A Simple Walkthrough Using CUMMINS INDIA
Ever wondered why the market suddenly becomes messy and confusing after a big rally? Welcome to the land of Elliott Wave corrections, where things aren't always a straight road—but if you know the signs, you won’t get lost.
Let’s break it down using a real chart – CUMMINS INDIA , where we can spot all types of corrections playing out like a drama series.
Step 1: Why Do Corrections Happen?
Corrections mostly show up in Wave 2 and Wave 4, which come after a strong trend (Wave 1 or 3). The job of corrections is simple – to cool things down before the next move.
Step 2: The Simple Ones – Flats and Zigzags
Zigzags (Pattern: 5-3-5):
Wave A: 5 waves
Wave B: 3 waves (does not cross the start of A)
Wave C: 5 waves, usually equal to or 1.618x of A
Zigzags are sharp and directional – like a quick jab.
Flats (Pattern: 3-3-5):
All about sideways movement.
The B wave often ends near or slightly above/below A’s start – forming what we call expanded flats (hello, double tops and bottoms!)
C wave finishes things off with 5 waves.
Flats are more chill – like the market catching its breath.
Step 3: The Slow Builders – Triangles
Triangles are like coiled springs. They’re made of five legs: A-B-C-D-E, all 3-wave moves. These usually show up in:
Wave 4 of an impulse
Y wave inside complex corrections
Think of triangles as the calm before the final push. You’ll often spot them before Wave 5 explodes.
Step 4: When One Correction Isn't Enough – Enter WXY
Imagine the market says, “One ABC correction? Nah, let’s keep going.”
WXY: Two corrections joined by an X wave.
W = ABC
X = ABC (a connector)
Y = ABC again
So it’s like: ABC + ABC + ABC
Step 5: When Even That’s Not Enough – The WXYXZ Beast
Sometimes the market just doesn’t want to move on. So it throws in another ABC.
WXYXZ:
That’s three ABC corrections, joined by two X waves.
If that’s still not enough? (Yes, this happens)
The whole mess becomes just Wave W of another larger correction. Fun, right?
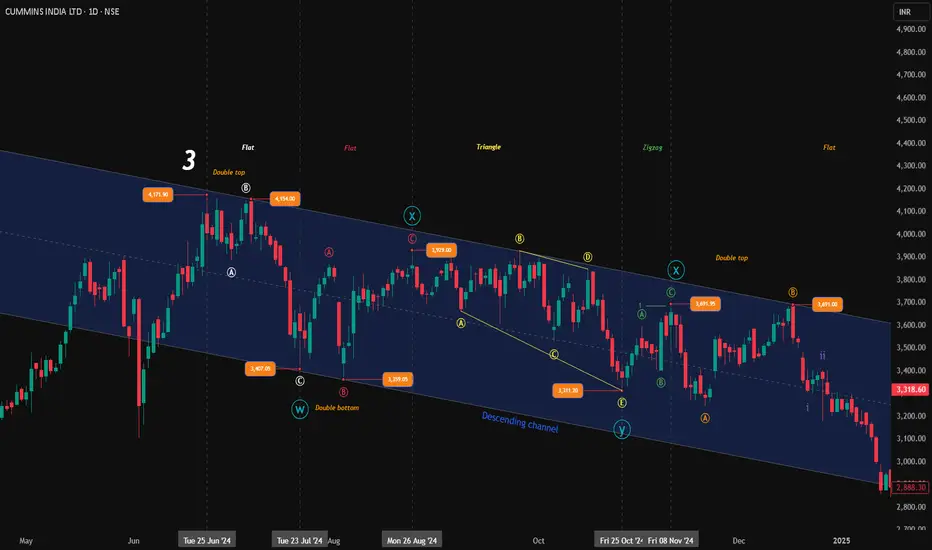
CUMMINS INDIA – The Perfect Textbook Example
In the chart:
You’ll see flats, zigzags, triangles, all wrapped inside a giant WXYXZ correction.
It spanned months, unfolded in layers, and just maybe, it’s done now.
From April onwards, the move looks impulsive (non-overlapping), hinting at a fresh trend. Or… is it just a big Zigzag in disguise? (C = 1.618 × A, remember?)
Only time (and maybe a bit more charting) will tell.
Final Thoughts
There are amazing books, and thousands of charts to study if you’re serious about learning.
"Give a man a fish, he eats for a day. Teach him how to fish, he eats for life." Trading is the same. Learn the process. Dont chase the calls.
I’m just sharing what I’ve learned with this post. Hope it helps someone out there. Happy charting, and remember— no one is ever 100% right. Stay curious. Stay humble.
Disclaimer: This analysis is for educational purposes only and does not constitute investment advice. Please do your own research (DYOR) before making any trading decisions.
Nifty - Elliot Wave UpdateNifty has been testing patience and not letting anyone take positional trades since mid of May.
24500 has acted as a crucial support - and as we come to re-test it today for the 3rd time, I thought of updating the view after my last post on May 15th, as we have a good RR long trade here.
We had two alternates:
1. We are in 5th up/ which got done, is about to be done. In this case we head down to 23500 or so and then we review if this bounce was corrective or we are going to ATH.
2. We did 1 and 2 and have started 3 up. Within 3 we started the 3rd up today. If this is true, the run up should continue for next few days.
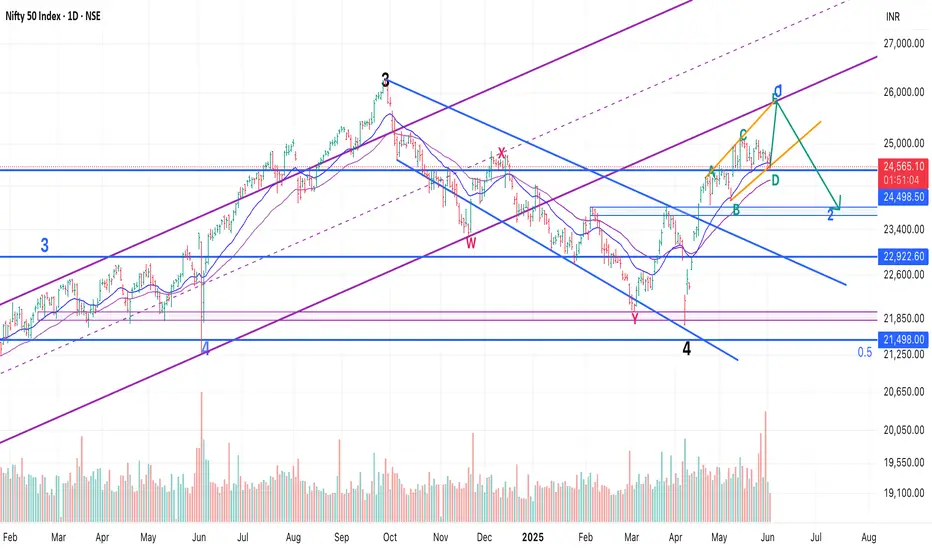
Now, possibility 2 remains as it is, but possibility 1 has changed to look like a leading diagonal.
So, instead of 12345 (where 1 and 4 cannot overlap), we are moving up in ABCDE (where A and D can overlap).
My view is that we have E up pending - and since we have taken so much time in D, more room is getting opened in E up (top of the wedge structure) - which was 25300 earlier, and is now looking at around 25700 - which is a good 1200 points from here.
This move up will also test the bottom of the longer channel we followed from March 2023 and broke in Jan 2025. So, a first test of that channel would mark as a good point for wave 1 to end and a correction to begin till 24000-23800.
24500 breaking and sustaining should act as SL. So, we have a good trade set-up at hand to play till 25500 or 5 wave up, whichever happens first
All the best!
CDSL – Leading Diagonal Kicking Off a Bullish Cycle?A possible new bullish impulse may be forming in CDSL, following a strong corrective downtrend.
From the ATH at ₹1989.80, the stock completed a 5-3-5 Zigzag correction that bottomed out at ₹1047.45. The final leg (Wave C) shows the characteristics of an Ending Diagonal , signaling possible exhaustion and the end of the correction.
From that low, the structure that follows appears to be a Leading Diagonal , possibly acting as Wave 1 of a new motive sequence. Despite its expanding nature, Wave 3 is not the shortest , and trendlines are respected — validating the diagonal structure.
This upward move has completed five waves, currently labeled as Wave (1), (2), (3), (4), and (5), which together form a larger Wave (A) . If this structure turns out to be impulsive , this may not just be an ABC correction, but the start of a full 5-wave impulse:
1 → 2 → 3 → 4 → 5
Now, we’re likely entering a Wave (2) correction, typically retracing 0.382 to 0.618 of Wave (1) . This retracement could break below the diagonal trendline , shaking out late bulls.
Post that, if the structure holds, we may see a strong Wave 3 advance — usually the most powerful leg in any impulse.
This is a hypothesis, and structure confirmation will be key. If price fails to hold support zones or shows structural invalidation, the count will need to be revised accordingly.
Tools Used: Elliott Wave, Fibonacci, Trendlines
Timeframe: 2H
This is not a buy/sell recommendation — purely an educational analysis. Chart will be updated as price action evolves.

Zigzag in Play- Can Wave C deliver the goods for ESCORTS KUBOTA?ESCORTS KUBOTA – A Zigzag Taking Shape
Structure Summary:
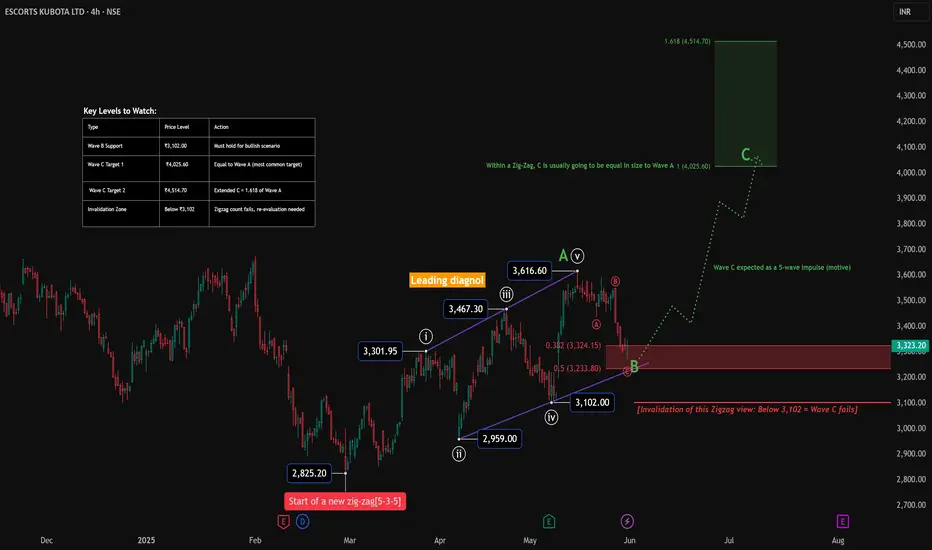
ESCORTS may be unfolding a classic Zigzag correction (5–3–5) from the low at ₹2,825.20. Wave A formed a clean leading diagonal. Wave B is currently developing and is expected to end near the 0.382–0.5 retracement of Wave A.
If this structure holds, we could soon see a powerful Wave C impulse aiming for the 4,000+ zone.
Elliott Wave View:
Wave A : Leading diagonal from ₹2,825.20 to ₹3,616.60
Wave B : Still developing – may complete near ₹3,233.80 (0.5 retracement)
Wave C : Expected to be a 5-wave impulse targeting:
₹4,025.60 (1.0 × Wave A)
₹4,514.70 (1.618 × Wave A)
Key Levels to Watch:
Wave B Support Zone: ₹3,233–₹3,102
Target 1: ₹4,025.60 (equal to Wave A)
Target 2: ₹4,514.70 (1.618 × Wave A)
Invalidation : Below ₹3,102 → Zigzag scenario fails, alternate count required
Note:
Wave C, if it triggers, should develop as a 5-wave impulse. Price action around the retracement zone will decide whether bulls still have control.
Disclaimer:
This is part of the educational WaveTracker series. It is not a trading recommendation.
Always DYOR and manage risk wisely.
Forecast for Long Term for INJUSDT -- Current Market Overview --
Price (as of May 28, 2025): INJ/USDT is trading at approximately $15.01, with a 24-hour increase of 4.93–10.79% and a weekly gain of 23.1–24.94%.
# Market Sentiment: Recent Wave indicate bullish sentiment, with analysts noting a breakout from a monthly demand zone and support at a weekly fair value gap (iFVG). The price has broken a higher-time-frame (HTF) downtrend, suggesting potential for further upside.
Market Cap and Volume: INJ has a market cap of $1.5B and a 24-hour trading volume of $218.9M, reflecting strong liquidity and interest.
-- Technical Analysis --
Price Action and Key Levels
# Support: The price recently found support at the $9.32–$10.00 demand zone, with a low of $6.5 in the past six months. The weekly iFVG and monthly demand zone around $10–$11 have held, acting as strong support.
Resistance: Key resistance levels are at $16.13 (short-term), $20–$25 (weekly target), and $33 (top of a multi-year descending wedge). A break above $16.13 could signal a mid-term swing toward $48.
Price Structure: INJ is in a bullish phase, having broken out from a descending wedge on the weekly chart and reclaiming the 21-day EMA. The price is trading above the 50-day SMA ($10.02) and 200-day SMA ($14.03 projected for June), indicating bullish momentum.
-- Disclaimer --
This analysis is based on recent technical data and market sentiment from web sources. It is for informational purposes only and not financial advice. Trading involves high risks, and past performance does not guarantee future results. Always conduct your own research or consult a SEBI-registered advisor before trading.
Boost and comment will be highly appreciated
