CDSL [Follow up] – Wave (5) Ending or Extending?The earlier hypothesis of a bullish impulse in CDSL saw Wave (5) completing near the 1.0 extension from Wave (4), right at the upper channel boundary — a strong confluence zone.
On closer inspection, the internal structure of Wave (5) looks more like an A-B-C rather than a clean 1-2-3-4-5, hinting at possible exhaustion.
This raises the likelihood that Wave (A)/(1) may already be in, and a Wave (B)/(2) correction could be in progress.
Still keeping an eye on the 1.618 projection as a stretch target if the trendline breaks. Until then — structure confirmation is key.
Tools: Elliott Wave, Fibonacci Projections
Timeframe: 30min / 1H for intrawave clarity
Elliott Wave

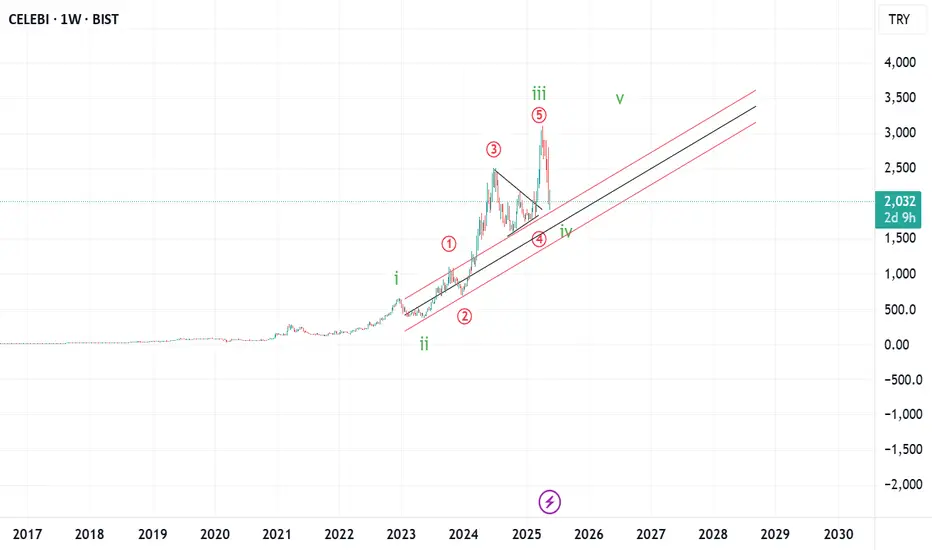
End of wave iiiCelebi Akash Services did not fall because India revoked its security clearance. It fell because it had completed a higher level wave iii with a triangle in previous wave 4 of one lesser degree. And market knew in advance . It has now almost at the end of correction (-40%) till the previous wave 4 of one lesser degree but can buy only on a reversal candle .
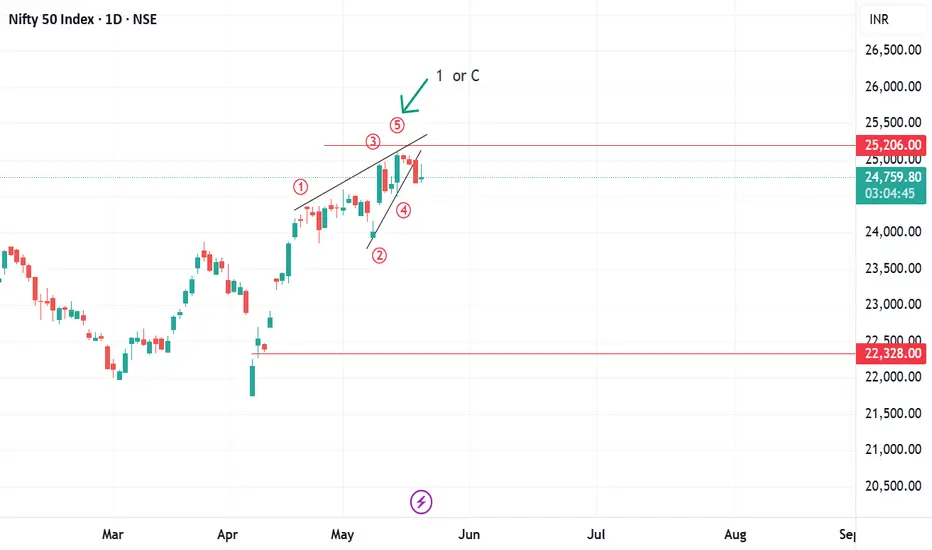
A non overlapping leading diagonalThis is a non over lapping leading diagonal , hence an impulse wave . Question is whether its a wave 1 or a wave C . Irrespective of the fact , a diagonal retraces till the territory level of wave 2 . Hence a short or square off buying positions .
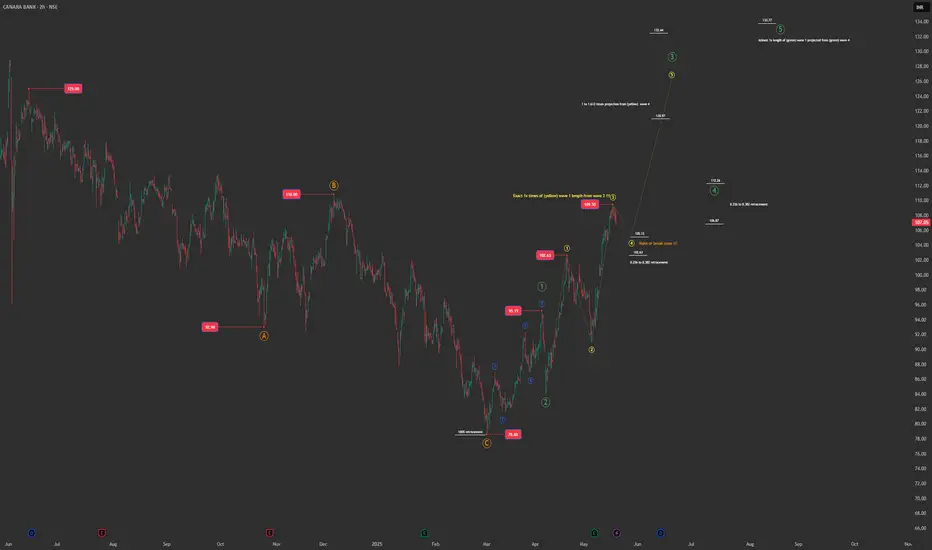
Canara Bank – Impulse Wave in Play After ABC Correction?From the mid-June 2024 high, Canara Bank completed a textbook ABC correction, with Wave C terminating precisely at the 100% retracement of Wave A from B. This setup marked the end of the downtrend and the potential beginning of a new impulsive uptrend.
The current structure shows a higher-degree impulsive move (marked in green), within which Wave 3 appears to be subdividing into its own smaller impulse (yellow count). Notably, Wave 3 (yellow) has completed exactly 100% of Wave 1 from Wave 2 at 109.50, which aligns well with common Fibonacci projections.
A healthy retracement (Wave 4 of yellow) is now underway, typically expected to fall within the 0.236–0.382 retracement zone. This region is a critical make-or-break zone — sustaining above 102.63 keeps the bullish structure intact and sets the stage for Wave 5 (yellow), which could complete the larger Wave 3 (green).
Once Wave 3 (green) tops out, a correction in Wave 4 (green) could unfold, again within the 0.236–0.382 retracement zone. Monitoring RSI divergence will be essential to identify exhaustion at the top of Wave 3.
If the pattern continues to hold, Wave 5 (green) could push price to 130+ levels , assuming a minimum 1x projection of Wave 1 from the Wave 4 base.
The structure remains valid only as long as 105.12 and 102.63 are respected . A deeper breakdown would suggest the count is invalid and we may instead be dealing with a complex W-X-Y-X-Z correction , with Z potentially unfolding below 78.60.
Given that earnings and revenue reports in both Jan and May have been strong, the bullish case is fundamentally supported too. Still, alternate bearish counts must be kept in mind.
This is a technical analysis for educational purposes only and not a buy/sell recommendation.
Timeframe: 2hr
Tools Used: Elliott Wave, Fibonacci Retracements, RSI
Jio Financial Services – Wave 5 Exhaustion? Retracement AheadJio Financial Services has completed a clean 1-2-3-4-5 Elliott Wave sequence, with each leg respecting Fibonacci levels well. From the Wave 4 low, price rallied and reached the 100% Fibonacci extension of Wave 1, marking ₹279.35 as a potential Wave 5 termination point.
Key Technical Signals:
Complete 5-wave impulse structure
Wave 5 = 100% of Wave 1
Bearish RSI divergence at the top
Volume shows signs of exhaustion
These signals suggest that Wave 5 may have ended and a corrective phase could begin.
Retracement Levels to Watch:
A retracement from the top is expected toward:
0.236 level: ₹270.55
0.382 level: ₹265.10
Price action in this zone will help determine if this is just a correction or the start of a larger reversal.
Indicators Used:
Elliott Wave count
Fibonacci levels
RSI
Volume
Timeframe: 2H

EURUSD Chart Analysis : An Elliott Wave Approach Hello friends, welcome to RK Charts!
Today, we'll analyse the EURUSD chart using Elliot Waves. This study is based on Elliot Wave theory and structure, which enables multiple possibilities. Please note that the possibilities outlined here are not definitive predictions, but rather potential scenarios.
The provided information is for educational purposes only and should not be considered trading advice. There is a risk of being completely wrong, and users are warned not to trade or invest solely based on this study.
We are not responsible for any profits or losses incurred. Individuals should consult a financial advisor before making any trading or investment decisions.
Now, let's dive into the analysis. According to Elliot Wave principles, we're currently in a corrective pattern, which consists of ((A)), ((B)) and ((C)) patterns. We've completed ((A)) and ((B)) and are now unfolding ((C)).
Within ((C)) we expect five sub-divisions, labeled as intermediate waves (blue bracketed): blue (1), (2), (3), (4) & (5). Almost four of these sub-divisions are completed, and we've just begun the (5).
We've set an invalidation point at 1.1065, which is the recent low. If this low is not breached, we'll likely continue unfolding the (5) wave of ((C)), which should break above the high of wave (3).
However, if the low is breached, it's possible that wave (4) is undergoing a double correction.
Both scenarios are possible, and we'll continue to monitor the market's unfold.
Scenario 1
Scenario 2
This study is a deep dive into Elliot Wave counts, aligned with the rules and principles of Elliot Wave theory, as well as higher time frame and higher degree analysis.
I hope this analysis based on Elliot Wave theory has helped you understand the chart better and learn something new. Please keep in mind that this is for educational purposes only.
I am not Sebi registered analyst.
My studies are for educational purpose only.
Please Consult your financial advisor before trading or investing.
I am not responsible for any kinds of your profits and your losses.
Most investors treat trading as a hobby because they have a full-time job doing something else.
However, If you treat trading like a business, it will pay you like a business.
If you treat like a hobby, hobbies don't pay, they cost you...!
Hope this post is helpful to community
Thanks
RK💕
Disclaimer and Risk Warning.
The analysis and discussion provided on in.tradingview.com/u/RK_Charts/ is intended for educational purposes only and should not be relied upon for trading decisions. RK_Charts is not an investment adviser and the information provided here should not be taken as professional investment advice. Before buying or selling any investments, securities, or precious metals, it is recommended that you conduct your own due diligence. RK_Charts does not share in your profits and will not take responsibility for any losses you may incur. So Please Consult your financial advisor before trading or investing.

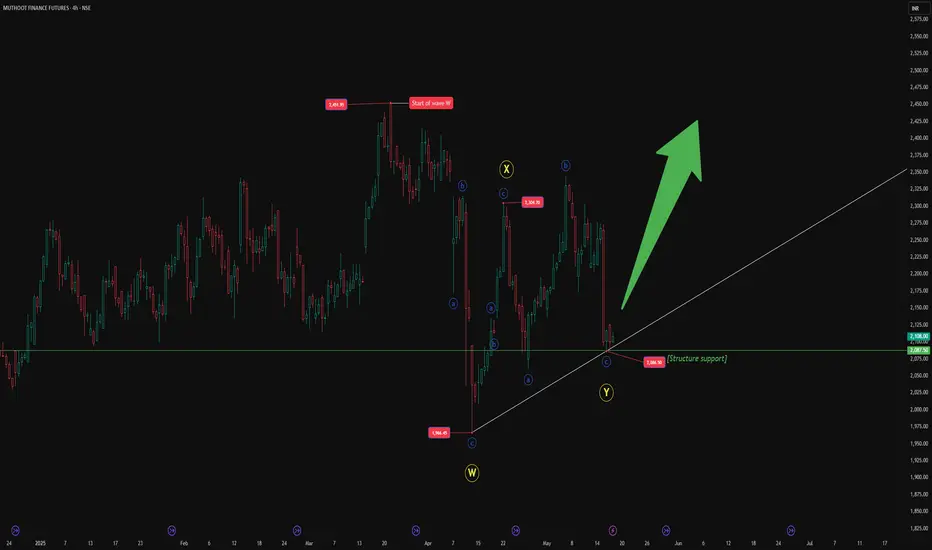
Muthoot Finance Futures – WXY Done? Bounce ExpectedA W-X-Y corrective pattern may have just wrapped up in Muthoot Finance Futures, with Wave Y potentially completing at ₹2086.50.
The final leg of this correction formed a neat a-b-c structure and tapped into a rising trendline support, adding strength to the bullish setup.
If price pushes above ₹2150–₹2180, that would break recent swing highs and hint at trend reversal.
But a fall below ₹2086 would invalidate the structure and open doors for deeper downside.
🧭 Bias: Bullish (as long as price holds above support).
📘 Just sharing my wave-based view — not financial advice. Open to thoughts and feedback!
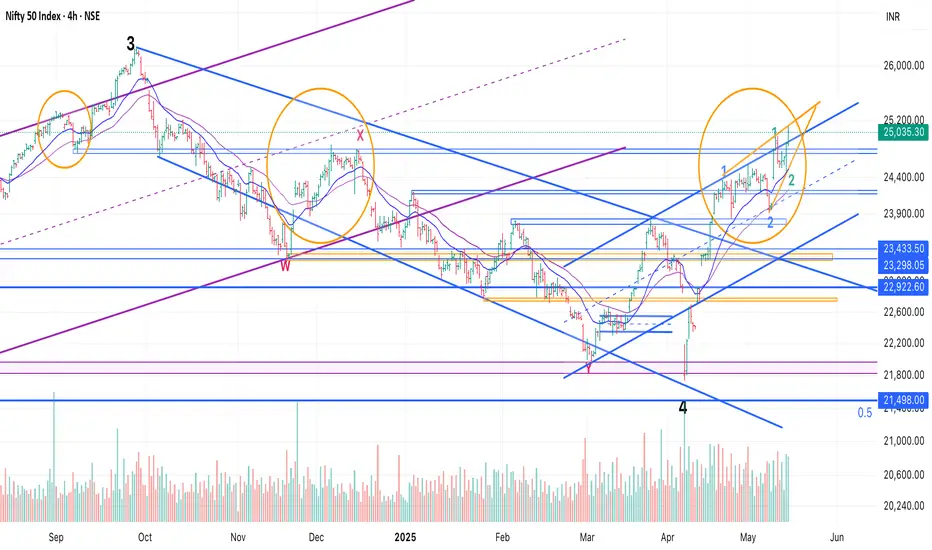
Nifty 50 Technical Analysis - May 16, 2025Nifty 50 Technical Analysis - May 13, 2025
Current Market Overview:
Closing Price: The Nifty 50 closed at 25,035.30, Up 395.20 points.
Day Range: Low: 24,750.00 | High: 25,400.00
Market Sentiment: The market exhibited strong bullish momentum, driven by positive global cues, including a ceasefire between India and Pakistan and optimism around US-China trade negotiations
Chart for your reference

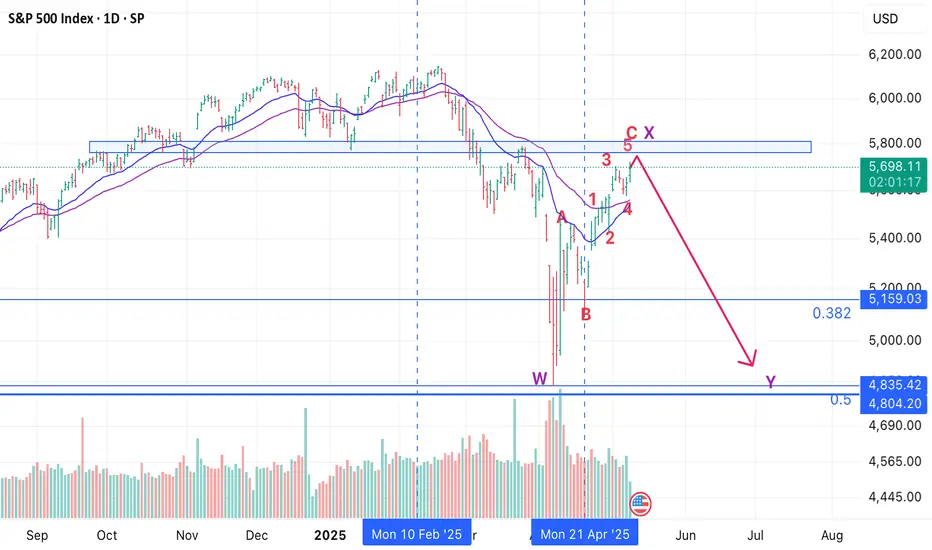
SPX/ NDX/ DJI - Elliot Wave - Change in CountsI have expected May 8th as the top of the pullback in this post:
However, it seems that there were more legs pending.
View still remains that this is a counter trend rally, and we will eventually head down again.
We are in 3rd of C and we will get another move up in 5th, which should mark the end of the entire leg up.
If I am invested in US markets - I would use this rally to book profits!
View is similar in Nasdaq and DJI, so not sharing those charts again. :)
All the best!

Nifty - Elliot Wave Update So, thankfully we have been aligning are views with the market and reviewing counts at the right time. Lucky much? :)
On May 2nd - We caught the top, when the breakout didn't look convincing
We got a good correction (Correction was even better in stocks) and booked out at around 24k on May 9th, and changed views, again as the fall wasn't as bad as it was expected after the end of 5th. Hence, it made sense to expect a 5th up.
This change in view helped us ride a good move of +1000 points in Nifty and multiple +10% moves in stocks (crazy moves there).
Now, while the view shared on May 9th still remains valid, there's an even more bullish view possible.
Ideally, I should have waited for more clarity, but thought that someone shouldn't book out of positions, if it's actually that.
So, there are two scenarios:
1. We are in 5th up/ which got done, is about to be done. In this case we head down to 23500 or so and then we review if this bounce was corrective or we are going to ATH.
2. We did 1 and 2 and have started 3 up. Within 3 we started the 3rd up today. If this is true, the run up should continue for next few days.
How to decide, I am keeping 61.8% of today's move as a deciding factor. So, if we come back to 24700, I'll be out of longs - will even book cash trades and wait for clarity to re-enter.
P.S.: You must be wondering, what the two Orange circles denote - Well they are for reminding me that this price action can be a trap, as it has happened in past. :D
Though looking at set-ups in stocks and the way they are moving after clearly defining a base - I am quite confident that the low has been made for this correction.
As usual, important to track closely and be nimble to change the view and humble to accept mistakes :)
All the best!
Is BTCUSD still in WXY correction phase ?BTCUSD continues to be correcting till 48K-62K band, this is weekly chart so it will take time.
Current up-move seems to be X wave as indicated.,
Why 51-62K is the band where correction will end ?
a. Technical divergence gets resolved here
b. 1.618 Fib relation of assumed corrective Wave-W falls in this band
Can the current rising segment impulsive ?
No because current rising segment is pretty corrective supporting high probability of next wave-Y
Will the correction stop at Wave-Y ?
May not be as one more leg up (Wave-X) and one more Leg down (Wave-Z) can be formed

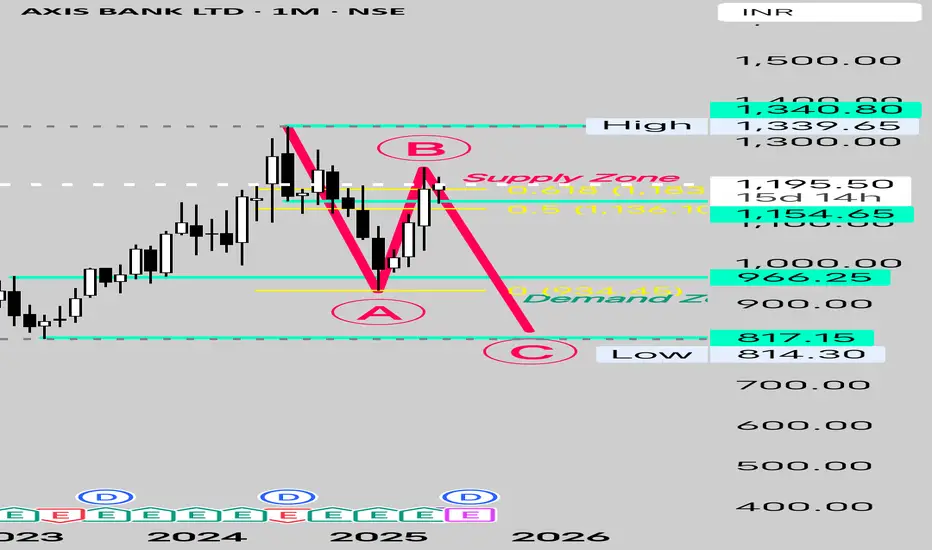
Axis Bank Ready for Next Down Leg Axis Bank is Trading in a Strong Supply Zone.
With disappointing Results and Technical Analysis Suggesting another Pending Wave C
In Months to Come we May retest The Demand Zone between 966 and 817 completing Wave C of The Elliot Wave Theory.
Silver MCX - Elliot Wave Counts - Long TradeSilver lagged Gold in the entire run up through the year
However, in last week Silver held quite well, while Gold has been correcting.
It seems like weekly Wave 4 is done and 1,2 of Wave 5 are done.
Wave 3 - targets 1.1L, 1.15L. Wave 5 targets + 1.2L
All the best!

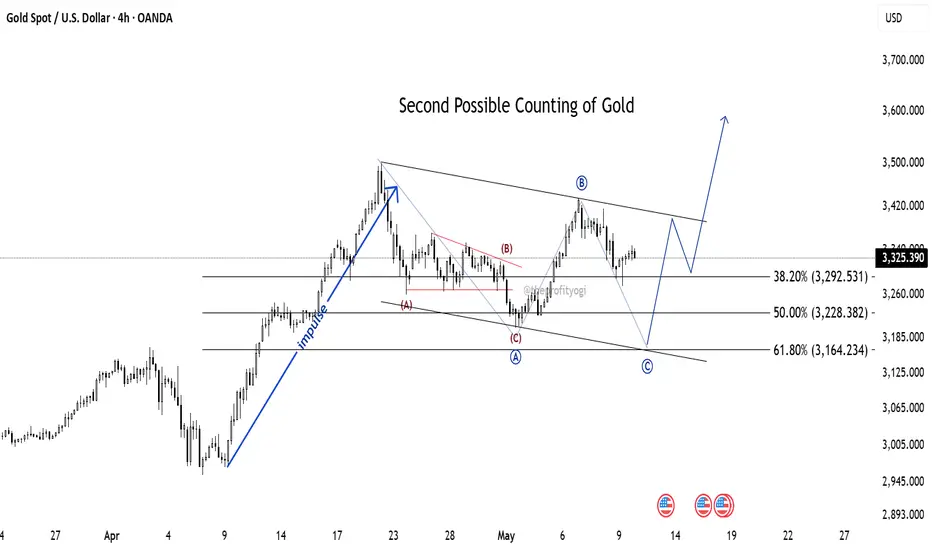
Another Possible Elliott Wave counting of GoldCounting 2:
Here, after an impulse, a Zig-zag correction is formed (marked in red ABC)
Here, I have assumed that this is just point (A) of further correction (in blue colour).
Then the price has gone to form wave (B), and currently the market is in wave (C).
This correction will complete near 61.8% (near 3164 level). And from here, a new impulse will start.
This analysis is based on Elliott Wave theory and Fibonacci study.
This analysis is for educational purposes only.
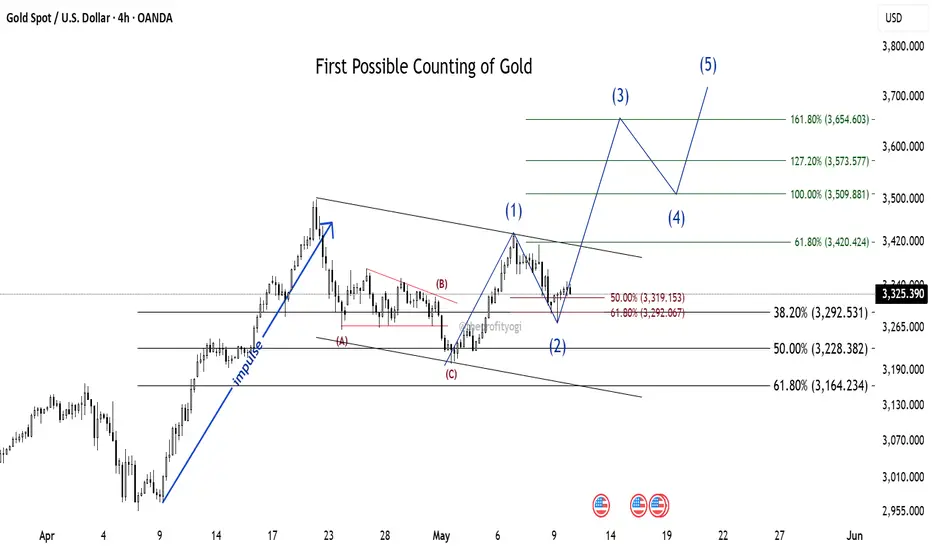
Possible Elliott Wave counting of GoldCounting 1:
After a clear impulse, the price formed a Zig-zag correction (marked in red ABC).
If the correction is completed near 50% (near 3228 level), then the recent upmove is a new impulse.
Of which wave 1 is completed, reaching a high of 3435. The market is currently in wave 2, and the next possible moves are marked as impulse counting (blue 12345).
This analysis is based on Elliott Wave theory and Fibonacci study.
This analysis is for educational purposes only.
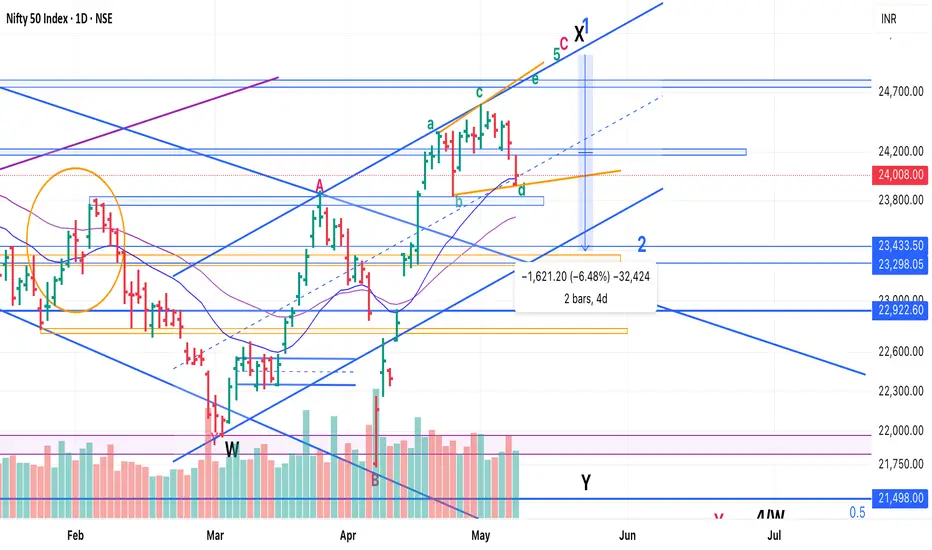
Nifty - Elliot Waves - Another PossibilityWell, Nifty is at a place that there are so many possibilities :)
This one is in line with the previous one, where I had mentioned that 5 up is pending and 25k can come.
I saw a few stocks making an expanded ED and turning, which gave the idea that Nifty could also be doing that.
So, here it goes - we go up in an E - 24800 is top of the expanded ED - we might even see a throw over to 25k - but unlikely) and then roll over.
After that there will be 2 options:
1. Bullish Scenario - We are just doing a 1 and the retracement we get is 2 (23400 target). Once this retracement is over we head to all time high.
2. Bearish Scenario - This entire leg up was corrective and we head down breaking April's lows.
In both cases we should get a decent short opportunity aroun 24800-25000.
However, now we have a minor trade for long - I would usually trade this very light and mostly intraday.
Will wait for the end of move for short trades. All the best!
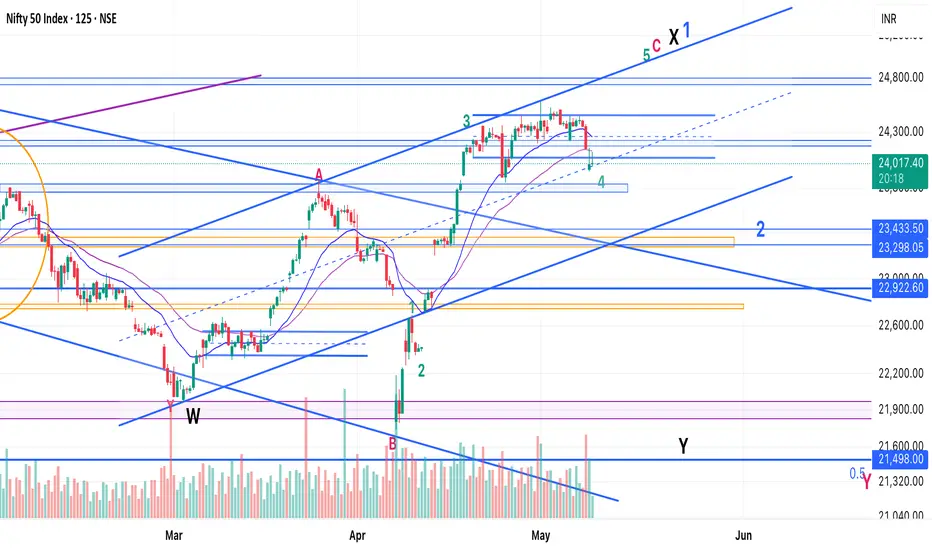
Nifty - Elliot Wave - Alternate counts - Bullish ScenarioI called a top on May 2nd as the buying looked like a trap - which usually acts as a good end of a trend move.
It worked out quite well, but we didn't get a selling momentum, that I expected.
So, contemplating if we are still in 4th and there's another leg up pending, which should be:
1. Bearish scenario - C of X - Y down should take us to new lows
2. Bullish Scenario - 1 of 5 (weekly) - We should have a 2 and then head up in waves 3 and 5 to 27-30k.
It's a tricky position to be in.
Plan: Keep position light and let the 5th up complete. In both bullish and bearish scenarios, we'll get a good retracement from there - Min 23500 (in 2) and can go till 21500 - 20500 in Y.
Ride the leg down and then take a call if it's bottoming out earlier or we are heading down?
For the time being, I have booked all of my shorts and awaiting clarity.
Cheers - All the best!
Bitcoin - Elliot Waves - Minor Counts (Last leg up)Here are the counts of the 5th of 5th that's going on. 108-110 should be max it goes.
Target after this is 60k.

BTC - Elliot Wave - Last Leg - 60k Coming AgainBTC completing the pending 5th of 5th of 5th.
God - this is going to be a painful correction.
P.S.: There could still be some steam left, but once done we are looking for 60k again!
All the best!

SPX - Elliot Wave Update -PullBack Over - Time for next leg downSPX has pulled back in an ABC with 5th of C going on today.
Good time to short and ride at least 10%, if lucky 15-20% :)
All the best!
STAY AWAY FROM LIC HOUSING FINANCELIC Housing Finance is in down trend since July 2024. It has form a downward sloping triangle. we are in Big Wave E of a triangle and we are going to see one more triangle within a triangle, Once the small triangle which is forming in last leg of E is completed we will see uptrend, but the confirmation will come only after we close successfully above 600. Remember Stock movement is not linear, what that means is after the cross over above 600 we will see a pullback which will be the time to go long, till then need to keep patience.
Disclaimer: This Idea is for educational purpose only and its not a buy or sell recommendation. you guys do your own analysis and decide.

RELIANCE INDUSTRIES IN LAST LEG OF CORRECTION ??Reliance Industries has seen a lot in last few months. Its time for Reliance industries to complete its last leg of correction and then resume its upward journey.
2 possibilities in last leg of correction.
1) It can be an impulsive move which will be in 1-2-3-4-5, which will be overall Wave C
2) It could be a triangle in which case the downfall and so the correction will be limited but boring.
Check out my previous chart on Reliance Industries.

POWER GRID CORPORATION SHOWING POWERWe have completed the Corrective waves and Impulsive waves have begun.
I can think of 2 possibilities as of today:
1) We are in 5th wave which should get truncated and soon the corrective phase which will be either simple or complex will start
2) If we are still in wave 3 continuation then we will reach 339++.
In any case we are in uptrend and there is still long way to go.
First Immediate target expected it to be 315 and if we are in 2nd possibility then we will reach 330++ soon.
Disclaimer: I am not SEBI registered member. This Idea is only meant for Educational Purposes.
