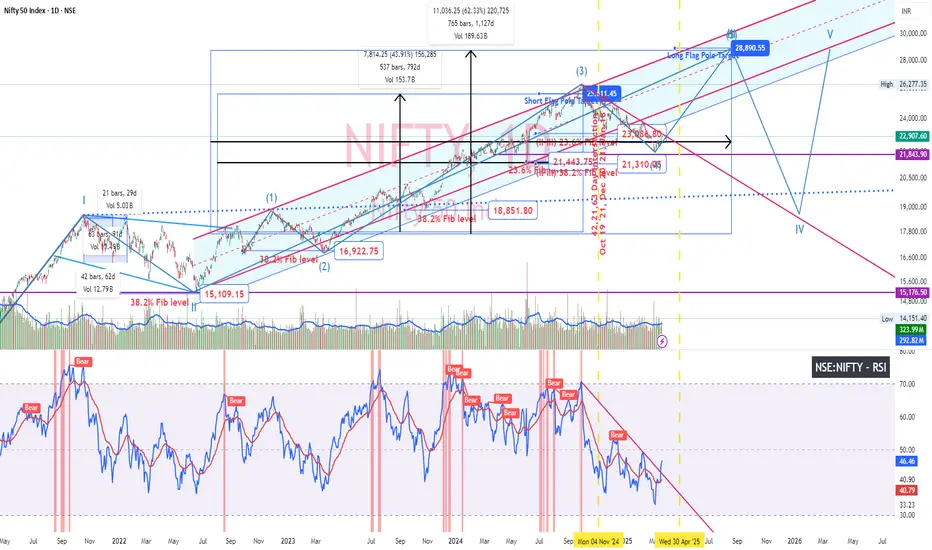
Nifty50 RSI Breakout in Daily timeframeNifty50 RSI breakout in daily timeframe. Soon, breakout will happen in price chart and head towards 29K mark. Could witness many scrip had breakout in RSI & Price in daily timeframe.
Elliott Wave
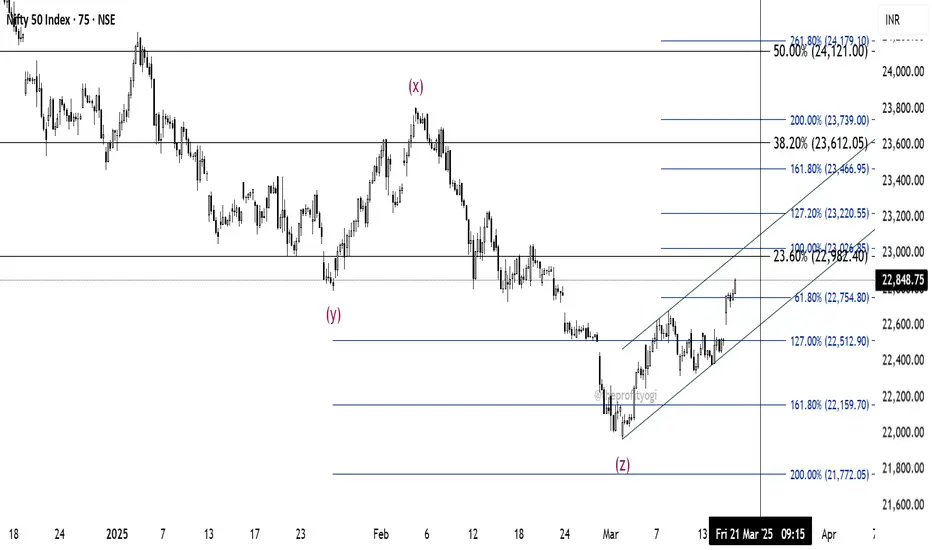
NIFTY: What's next?Nifty is moving as per our previous prediction posted on 5th March.
After making a low of 21964.60, which is the completion of wave Z, the price is moving upwards.
If this move is impulsive, the price must reach 100% level (23026.85) by 21st March.
At this level, there is a cluster of Fib retracement level of 23.6%
Further targets will be 127%, and 161.8% levels.
This analysis is based on Elliott Wave theory and Fibonacci.
This is not any buying recommendation.
For educational purposes only.
Gold - Long Term Elliot Wave Counts - Top is near!Gold has finally started it's last leg up, 5th of 5th on Weekly.
This can go another 3-5% to 90600, 9100 or so, or maybe slightly higher, however, when it ends, we are looking for a sharp fall, as an extended 5th with short retracement in 4th doesn't end well.
Lot of people would be trapped, and when it starts breaking levels it will create double pressure from bears shorting and bulls covering longs.
I am expecting around 75k.

Dow Jones Industrial Average further correction PossibilityThe Dow Jones Industrial Average (DJIA) is currently at 41,500, and a potential bearish continuation could push it down to 38,400. If the downward momentum persists, the index could correct by approximately 7.5%, possibly due to factors such as global politics, economic slowdown, or weakening corporate earnings. A break below key support levels could accelerate selling pressure. If Weekly candle close above 42540 then possibility to have some bullishness.
Disclaimer: The information provided is for informational purposes only and should not be considered as financial or investment advice. Stock market movements are influenced by various unpredictable factors, and past performance is not indicative of future results. Investors should conduct their own research and consult with a professional financial advisor before making any investment decisions. Neither the author nor this platform assumes any responsibility for financial losses incurred based on this analysis.

WHERE DOES RELIANCE INDUSTRIES STAND AS OF 13th MARCH 2025we are about to complete Wave e of Wave 4 and we still have long way to go before we see some sunshine, what this means we still have wave 5 to complete. Please refer the below charts which I posted in the past.
Disclaimer: I am not SEBI registered member and these ideas are meant only for educational purposes only

Elliott Waves Insights: Tesla’s Roadmap to SuccessHello friends, let's analyze Tesla's chart using theory. This is a 4-hour chart where we can clearly see that the higher degree, primary degree wave ((3)) in black has been completed. Currently, we're on the verge of completing wave ((4)) in black of the primary degree, which has three subdivisions marked in blue as (A), (B) & (C).
(A) and (B) are completed, and (C) is near completion. Within (C), we have five subdivisions in red, of which 1, 2, 3, & 4 are completed, and the 5th is also more than 60% complete. Once the red fifth is complete, it will mark the end of blue (C) and primary degree wave ((4)) in black.
As soon as wave ((4)) is complete, we can expect a reversal, which should be wave ((5)). Which should cross the high of wave ((3)) which is ATH, So, we're expecting wave ((5)) to start move upwards.
Now, friends, what's the invalidation level for this view? It's $139.20. This is a level that wave ((4)) should not cross, as it's the low of black wave ((2)). According to theory, wave 2 cannot retrace more than 100% of wave 1, wave 3 cannot be the shortest in impulse, and wave 4 cannot enter the territory of wave 1, which is here we’re witnessing in current scenario, which is considering we’re in any diagonal or triangle of higher degree.
If wave ((4)) crosses $139.20, it will invalidate our view. We might be missing some dots to join or create the picture perfectly. Currently, the price is around $222, and we might see a small bounce before making a lower low possibly around $200. If we witness a divergence there, it could lead to a reversal.
Please note that this study uses theory and structures, involves multiple possibilities, and focuses on one potential scenario. There's a risk of being completely wrong. This is for educational purposes only, and users should not trade or invest solely based on this study.
I am not Sebi registered analyst.
My studies are for educational purpose only.
Please Consult your financial advisor before trading or investing.
I am not responsible for any kinds of your profits and your losses.
Hope this post is helpful to community
Thanks
RK💕
Disclaimer and Risk Warning.
The analysis and discussion provided on in.tradingview.com/u/RK_Charts/ is intended for educational purposes only and should not be relied upon for trading decisions. RK_Charts is not an investment adviser and the information provided here should not be taken as professional investment advice. Before buying or selling any investments, securities, or precious metals, it is recommended that you conduct your own due diligence. RK_Charts does not share in your profits and will not take responsibility for any losses you may incur. So Please Consult your financial advisor before trading or investing.

Can NIFTY Regain Its Balance or Will It Plummet Further?Timeframe: 4h
After reaching a peak of 26,277 , the NSE NIFTY has begun to decline within a downward parallel channel. The Elliott wave structure can be identified as (W) – (X) – (Y) , where wave (X) peaked at 24,867 , followed by a downward movement for the final wave (Y). The price has fallen below the 20 , 50 , 100 , and 200 EMA levels, with an ATR of 166.36 .
The correction has several key levels to consider:
At 100% retracement of wave (W) at 21,962
At 100% retracement of wave (a) at 22,827
At the lower boundary of the corrective channel
Bearish sentiment is currently stronger than buyer demand. A reversal may occur either after a breakout from the parallel channel or at the lower boundary of the channel. This is possible as long as the swing low of 21,283 remains intact.
We will update further information soon.

Nifty - EW Update - Time to be lightABC up from recent low seems to be done.
Also, we are in the range from where price had gapped down and broken last time
So, it's time to be cautious. If we make another leg up, then we have 5 up which will be good and we can start taking longs on the next retracement.
However, if we turn from here, we are going lower in E of E to 21500 or so.
Possible Elliott Waves Counts of BITCOINHello friends, today we're analyzing the Bitcoin chart based on Elliott Wave Theory. We're using a 4-hour chart, where we can clearly see that we've completed the intermediate degree 3rd, 4th, and 5th waves means the completion of the primary degree ((3)) wave marked in black. After that, we completed another primary degree ((4)) wave marked in black.
Currently, we're moving upwards, which should be the primary degree ((5)) wave, containing five sub-divisions marked in blue as (1), (2), (3), (4) and (5) We've almost completed the (1) sub-division and are nearing the completion of the (2) sub-division.
According to Elliott Wave Theory, if the recent low wave ((4)) at around $70,200 holds and doesn't break below, the price has the potential to reach new highs towards $110,000 to $120,000. This analysis is entirely based on Elliott Wave Theory and its structure.
In this study we used Elliott Wave Theory & Structures, here we have plotted possible wave counts on daily time frame chart of DXY Dollar Index, it involves multiple possibilities, and the analysis presented focuses on one potential scenario. The provided information is for educational purposes only, not trading advice. There's a risk of being completely wrong.
I am not Sebi registered analyst.
My studies are for educational purpose only.
Please Consult your financial advisor before trading or investing.
I am not responsible for any kinds of your profits and your losses.
Hope this post is helpful to community
Thanks
RK💕
Disclaimer and Risk Warning.
The analysis and discussion provided on in.tradingview.com/u/RK_Charts/ is intended for educational purposes only and should not be relied upon for trading decisions. RK_Charts is not an investment adviser and the information provided here should not be taken as professional investment advice. Before buying or selling any investments, securities, or precious metals, it is recommended that you conduct your own due diligence. RK_Charts does not share in your profits and will not take responsibility for any losses you may incur. So Please Consult your financial advisor before trading or investing.

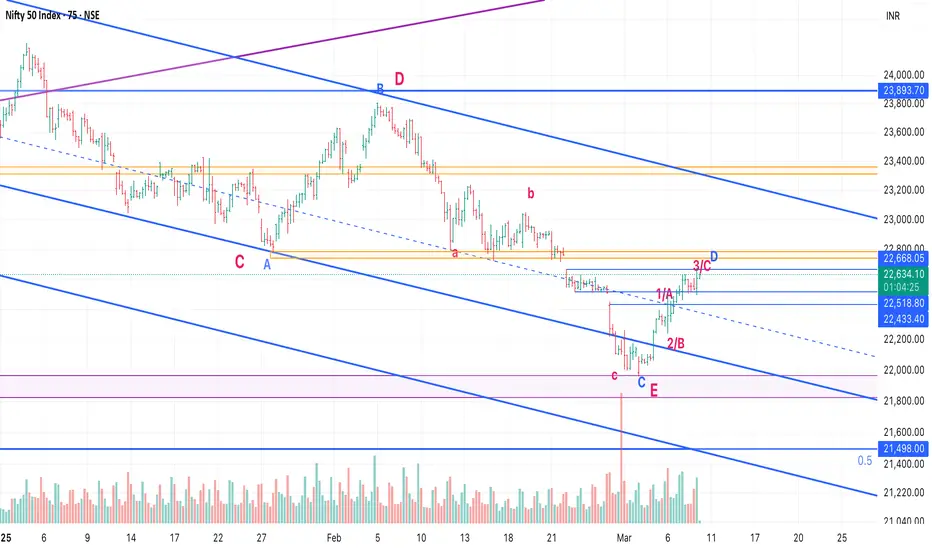
Nifty EW UpdateSo we had a good 2 days of upside.
I am changing the possibilities a bit:
1. Possibility 1 (Red): We are in larger Triangle (ABCDE - Red) E done and we have made a bottom. Wave 1 of next leg up seems done, we should expect a 2 now.
2. Possibility 2 (Blue): We are in a Larger ABC (Red) and C is further an ED (ABCDE - Blue).
In that case the leg up of last 2 days was an A.
We should expect a B down (22200-250) and C up (22800, 23050) which will complete D.
Post that, we will have a E of Red C down, mostly till 21500, 21200.
Still hoping red one holds, but no one knows. :)

Is it a reversal in NIFTY?If we observe the daily chart of NIFTY, a pattern like Morning Star can be seen near the 161.8% retracement level. Also, as per our previous study, the recent fall was wave (Z).
The minimum target for it is 38.2% extension (which is a failure wave (Z) because most of the time, it is seen that wave (Z) is a failure or truncated).
So, we can have a risky buying opportunity here with a small stop-loss below the recent low. Or, if one wants to play safe, he may have his stop bellow 61.8% (21662) level.
The near target will be the bottom of wave (Y), i.e., 22786.90
This analysis is based on the Elliott wave theory and Fibonacci.
This is not any buying recommendations.
This analysis is for educational purposes only.

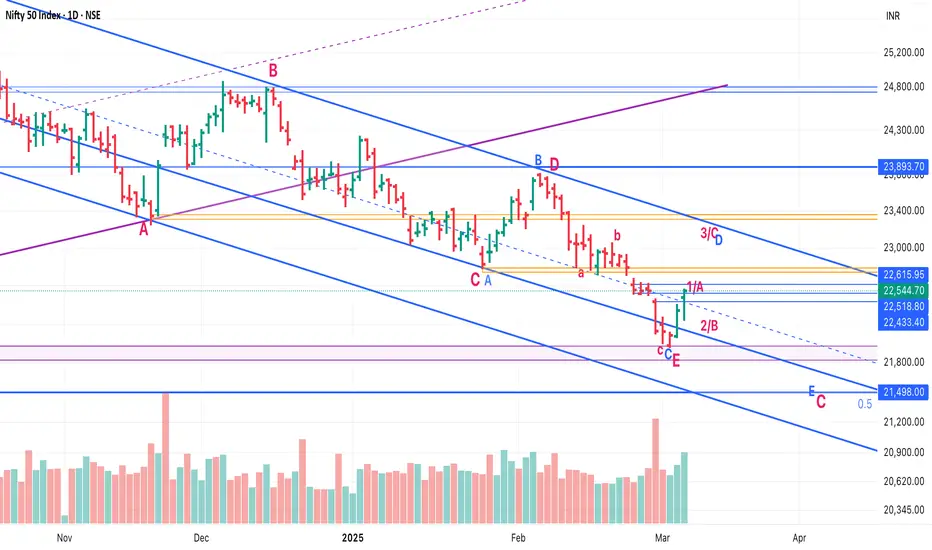
Nifty EW UpdateConfusion remains:
Either bottom done in an ABC in E
OR it's just 3rd wave in C3 done and 4th going on.
Crossing 22800 should give confidence that it's not C3, and we could have made a bottom.
All in all, stocks are doing well, Metals, PSEs, Capital goods etc are already breaking above the levels they were at when Nifty was at 23k.

Cholamandalam Next Immediate Target Expect to be1465Cholamandalam was in correction for a long time, it has just now wakeup. As per the Analysis I am expecting the first wave to end at 1465.
Will keep on updating the chart as we move ahead.
Disclaimer: I am not SEBI registered member, this Idea is only for educational purposes.

Nifty - Elliot Waves UpdateWe are in a confusing situation right now.
Possibility 1 (in red): We are in an ED and E of ED got done in ABC
Possibility 2 (in blue): Larger C is going on and only 3 of C3 is done - We can head till 20500 (even lower) in this case.
In both cases we are either at bottom or within 5% of it. However, upside is big - at least 23500.
One good thing is that we recovered after a gap down in last 2 days, especially when US markets fell quite sharply yesterday.
Wait and watch time for traders. Deploy cash time for investors :)

Expanding Flat on NVIDIA: Bearish or Final Leg?NVIDIA after a recent bullish trend has formed an Expanding Flat correction.
Wave (B) exceeded Wave (A)’s start, confirming this as an Expanding Flat (3-3-5) structure.
Wave (C) is in progress, unfolding in a five-wave sequence.
The 1.618 Fibonacci extension (~102 USD) is a key support zone, with 2.618 (~56 USD) as an extreme bearish target.
A reversal could follow after Wave C completes, so these levels are crucial to watch.
Key Levels to Watch:
102 USD (1.618 Fib extension - first support zone).
56 USD (2.618 Fib extension - extreme bearish case).
❓ Is this the final leg down before a bullish reversal, or more downside ahead?

NIFTY further possible levels These are the next possible levels for NIFTY according to Fibonacci retracement and extension.
For educational purposes only.

Banknifty possible further levelsNext possible levels for BANKNIFTY according to Fibonacci retracement and extension.
For educational purposes only.

City Union Bank completed a Wave 4 on Weekly timeframeCity Union Bank has been in an uptrend since February 2009 and has recently completed Wave 4 in a triangle pattern. Now, it is poised to form Wave 5 in the coming weeks. A conservative approach to maximize gains from Wave 5 is to enter the market at the right moment, which is when the stock starts trading above Rs. 181, marking an entry over Wave D of the triangle.
This strategy aligns with the principles of Elliott Wave Theory, where Wave 5 typically represents a final upward movement in the trend. By waiting for the stock to trade above Rs. 181, you can potentially capture the gains from this anticipated upward movement.

Bitcoin Analysis Bitcoin Analysis
Its Looking like bullish and bulls are trying to control the market but, wave analysis is saying its should come one more down than final up

Ethereum Technical Analysis - Weakly 🇺🇸 CRYPTOCAP:ETH Weekly Technical Analysis: #Ethereum broke previous support at $2250 on the 4-hour timeframe. We are in a bearish trend, 💔raising concerns. As the weekly closing is pending, I will update if there are changes after the weekly and monthly closings.
📈📉Chart for reference. posted on trading view as well link below

Nifty 50 - Potential Deep Correction AheadAfter analyzing the current structure of the Nifty 50 index, I believe we're looking at a potential deeper correction in the market. The larger downtrend has been playing out with Wave A completing at 23,263.15. We're now in Wave C, and a deeper correction could be expected with Wave C potentially extending further down.
Key points:
Wave 5 might be Wave 3 and could indicate a bigger correction.
Wave C could target 21,292.70, with further downside potential.
The Max retracement for Wave 4 suggests a corrective rally without violating the start of Wave 1.
Fibonacci extension indicates a deeper retracement, possibly extending beyond the 1.618 level.
I believe there's a strong chance the market might head lower, and this could mark the start of a bigger trend reversal.
Would love to hear your thoughts and if others are seeing a similar pattern! Let's see how this unfolds.
Chart Details:
Timeframe: 4-Hour Chart
Indicators: Fibonacci retracements, wave counting
Key Levels:
Target for Wave C: 21,292.70 or lower
Max retracement for Wave 4: 22,720.30
1.618 extension: Lower levels are anticipated.

Nifty 50 - Elliot Wave UpdateHere are the scenarios (ignore technical details (as I can post only one chart per post)
Possibility 1: ED in E of E - 22400 should be low
Possibility 2: C started in E - Can go till 22000 - 22250
Possibility 3: C1, C2 done C3 going on - This will be bad. - 21600 possible
Tomorrow (Friday, Feb 28) is a crucial day for us to get the answer.
Tracking Nifty 500 (currently at 20315) will give a better picture.
Why? Because it was holding above the previous low, while Nifty had broken. This was giving the confidence that Nifty is divergent and forming a bottom, and we should head up after Feb expiry.
So, here’s what we need to track in Nifty 500 (today’s close: 20315)
If we turn before 20130 - We'll go up till 22300-500
If we break 20130, then we'll first go down to 19300-500, and then recover to 21500-700
Best would be today’s closing becomes the bottom, and we have a +1% green day tomorrow - breaking 20550 tomorrow is important (20 month moving average).
Let's see what the market has in store!
