U(R) Truce on the Way – Nifty: Nervous to Nirvana! ElliottWave
Life and markets share a common truth:
Decisions made at crossroads define the journey ahead. Whether it's turning left or right at an intersection or navigating the ever-changing waves of financial markets, one thing remains constant—preparation is key.
In trading, emotions often cloud judgment. The impulsive, last-minute decisions taken without a backup plan lead to uncertainty, just as a driver who hesitates at a crucial turn may end up lost. If you don’t prepare in advance, you will always be at the mercy of emotions rather than logic.
I’ve always warned about hidden market paths, sharing insights through stocks like BHEL, ONGC, and others that signaled Nifty’s nervousness well before it unfolded. If you ignored the signs or failed to rethink, then neither I nor anyone else can help—because wisdom lies in learning before mistakes become losses.
As someone once said:
👉 If you learn from your own mistakes, you’re intelligent.
👉 If you learn from others’ mistakes, you’re a genius!
Now, coming back to our topic:
The Ukraine-Russia Truce & Nifty’s Grand U-Turn?
The war between U (Ukraine) & R (Russia) seems to be moving towards a truce, but only time will confirm its reality. However, technically, Nifty has been unfolding a wedge pattern since December 2024—a structure known for its time-consuming, overlapping movements across multiple wave degrees.
On January 29, 2025,
I proposed a falling wedge scenario with a key requirement: Nifty must overlap 22,537 to confirm the pattern
Copyright of WaveTalks
By Budget Day (February 1, 2025)
Not only did Nifty hit this level, but it surged to 23,807 on February 5, adjusting the structure to an expanding wedge — a rare phenomenon .
6th Feb 2025 - Expanded Ending Diagonal
Last Wave Pending Downside (One Day Before RBI Policy on 7th Feb 2025)
Copyright of WaveTalks
11th Feb 2024 - What a fall in Expanded Ending Diagonal
Copyright of WaveTalks
What’s Next? The Big U-Turn?
If this pattern completes in the current zone and starts bouncing upwards, we might witness Nifty’s journey from Nervous to Nirvana—a potential upside move towards 25,000, possibly even 26,277 for a new high!
Are We Ready for the Grand Turn?
Just like life, trading is about preparation. Those who anticipate the next wave will ride it effortlessly; those who hesitate will be left watching.
Stay tuned as this unfolds—Catch me with another exciting idea from WaveTalks…
Market Whispers! Can You Hear Them?
Regards,
Abhishek
Elliott Wave

Nifty Bottomed out Buy From hereChart on Near to Long term trend line support level, Pattern showing last falling completed here near to 22500, Trend resistance will be at 23300, bounce back likely to come, from current level to, small resistance at 23300, but eventually this break the resistance

Triangle Pattern in Elliott Wave-4A Triangle pattern in wave4
The wave 5 could end near 22464.
This could be followed by a Sharp reversal trade retracing wave 5 completely

Price + time correction of wave iii - Abhi iska ho gayaDixon will become a trading stock now . Its investment value is over because of an extended wave iii. Its not a buy and hold stock now . We dont know how much and how long it will correct.

#Nifty directions and levels for February 21:Good morning, Friends! 🌞
Here are the market directions and levels for February 21:
Market Overview
The global market has a slightly negative bias; however, the structure remains bullish (as indicated by the Dow Jones). Our local market is maintaining a moderately bearish sentiment. Today, the market may open neutral to slightly gapping down, as the Gift Nifty indicates a negative move of 50 points.
In the previous session, both markets consolidated after a gap-down start. What about today? Structurally, we are still in a range, so it may continue in that manner. However, in the previous session, apart from HDFC Bank, all banking stocks performed well. If HDFC Bank supports the market today, we can expect some positive bias; conversely, if it does not support, the market may consolidate or correct. Just my opinion—let's look at the chart.
Nifty Current View:
The current view indicates that the Gift Nifty is suggesting a gap-down start. If the market finds support around the 78% level, or if the initial market takes a solid pullback without breaking the previous day's low, we can expect a pullback of a minimum of 38% to 78% within the range. After that, if it breaks the top of the range, we can expect a continuation of the rally, based on the structure.
Alternate View:
The alternate view suggests that if the gap-down has a solid structure and consolidates around the 78% to minor pullback zone, then the correction will likely continue to 22,725 to 38%.

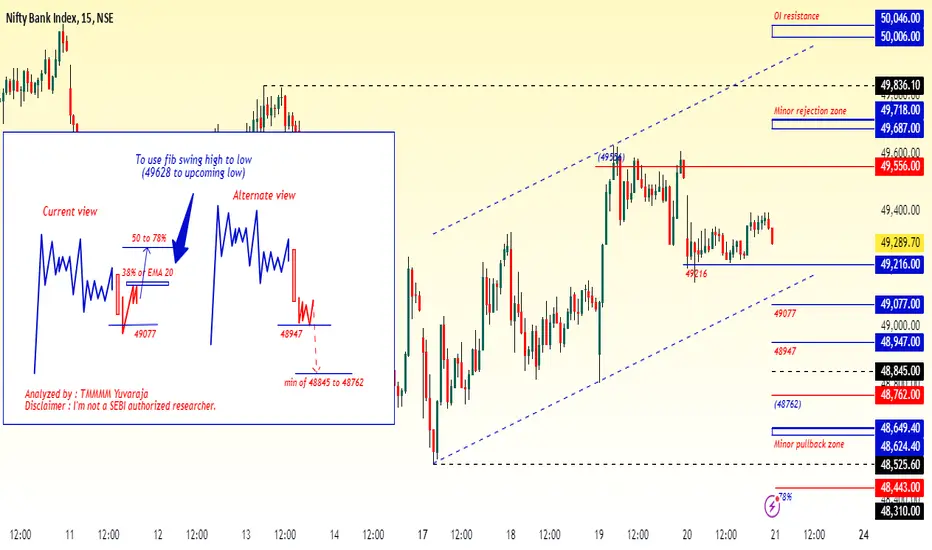
#Banknifty directions and levels for February 21:Bank Nifty:
It is similar to the Nifty structure. If the market takes a pullback around the immediate support level, we can expect a range market leading to a continuation of the rally. Alternatively, if it shows a solid correctional structure, then the correction will likely continue towards 48,845 to 48,762.
The Beauty of Fibo retracements - CAMSCAMS is getting ready for its fifth wave impulse after its really nice 4th wave correction for a couple of months , keep this in your watchlist to look out!

Nifty - Elliot Wave Update - Close to bottom, for Now!I am considering the entire correction from October highs as a triangle - ABCDE.
We are now in E and E seems to be forming an Ending Diagonal - Another ABCDE.
The chart shared shows internals of the Wave E.
I have marked two alternates - Red and Orange, and in both cases we are close to end of correction which should end anywhere between 22500-600.
If 22500 breaks we will have to update the counts and consider a dip to 22000.
The bottom that gets formed could either be completion of correcting in Weekly Wave 4 in which case we head to ATH i.e. +28k in Nifty OR it could be just first leg of correction that ends in W and we go up in an X, in which case I expect 24-24.5k.
In both cases a good move up should unfold - Expecting March to be a green month and most likely April to follow through upwards - So, gunning for 2 green months.
A few factors getting aligned - US market seems topping out in Weekly Wave 3 and so does USDINR - both should favor some flow of funds towards a better valued Indian markets - and hence a +ve fund flow from FIIs should help bump up the markets, along with liquidity getting infused by RBI.
So, time to start putting in the lump-sums :)

DLF mine favorite stock, its time againDLF was in sideways moves for quite a long, however it was trying to finish the contracting triangle. What more we are at the right time.
Possibilites:
1) we can have another small contracting triangle in which leg e will be the leg a and so on.
2) we will see a sharp move towards 944-945 considering the triangle is completed.
Its a little wait and watch situation for few more days before we see any conclusive move.
Disclaimer: This is for educational purpose only. I am not authorised to give buy/sell recommendation. please do your own analysis and then take a decision.

Cipla Update after the Correction
Please refer the earlier chart of Cipla. Correction is over, we are seeing a big move up after the end of correction at wave e, remember there might be a pull back but overall the uptrend has just began. I am expecting that Cipla to move at 1675-1679 by Mid March to End of March.
First Immediate move to 1580 and then the rest will unfold slowly.
Disclaimer: I am not SEBI registered member and these Ideas are meant only for educational purposes.

DR REDDY GAP DOWN IN 3rd WAVEwe clearly see GAP DOWN in 3rd wave of the 5 waves of the C wave. What does this indicates? A fall to complete the 3rd wave was quick. we are done with 3rd wave and in the process to complete the 4th wave.
Possibilities:
*) Downward it can go to 1148-1160 to complete the 5th wave.
*) It may close the 3rd wave Gap before resuming its downward Journey to complete the 4th wave. (Less Probability)
In Either case I would prefer not to enter any new position and wait for the right opportunity.
Disclaimer: I am not SEBI registered Member. This is Strictly for educational purpose only.

Wave iii was PE expansion - Now we wait for earnings Mazagaon docks had a vertical wave iii based on PE expansion . Now it requires earnings expansion . Till EPS does not increase it will continue to be in wave iv and most probably form a triangle till it digests the PE increase in wave iii. Valuations will take time to normalize . But its a hold . Since many stocks have completed wave iii , we should be good at trading for another 6-12 months

Building a base for the BounceElliot wave counts on Indian Indices, expecting a bounce in either X or 5

Nifty directions and levels for February 20th:Good morning, Friends! 🌞
Here are the market directions and levels for February 20th:
Market Overview
Globally, nothing has changed, while our local market is maintaining a moderately bearish sentiment. Today, the market may open neutral to slightly gapping down, as the Nifty futures indicate a negative move of 50 points.
In the previous session, Bank Nifty had a solid pullback, but Nifty didn't react similarly and maintained its range. What’s next? The two structures are a bit different, so we can't take this in a single direction. My personal opinion is that structurally, there is still a decline pending today. If this decline finds support around the immediate support level, we can expect a continuation of the pullback with some consolidation. On the other hand, if it doesn't find support today, the market will likely consolidate before continuing its correction, Let’s look at the chart.
Nifty Current View:
The current analysis suggests that if the market pulls back initially or finds support around 22,830, we can expect a pullback. However, until it breaks the previous high, we can't anticipate significant movement. This is the first scenario.
Alternate View:
The alternate view indicates that we are in a range-bound market. Until the market breaks 22,769, the range will continue. However, if the decline has a solid structure and breaks 22,769, we can expect a continuation of the correction.

Banknifty directions and levels for February 20th:Bank Nifty Current View:
Bank Nifty is a bit different from Nifty; it has a bullish structure, resembling a "Flag pattern." If the market initially pulls back and breaks the minor rejection zone, we can expect further rally continuation. If it reaches there with gradual movement, it may not go up significantly.
Alternate View:
This is similar to the first one. If the market finds support around the immediate support level, we can expect a continuation of the pullback. Conversely, if it breaks that level, we can expect a minimum move to the channel bottom before the next correction target.

CDSL Stock is Currently trading in the 4th wave CDSL Stock is Currently trading in the 4th wave and now the fifth wave may come
Stock major support near 1000 so watchful and if you can get a bounce then you can enter into trade.

Nifty- End of a diagonal triangleAvoid aggressive shorts . A wedge/diagonal triangle is approaching the end . This can be a wave a of a diagonal . which can give rise to an aggressive wave b . or its end of correction

XAUUSD: Analysis from Wyckoff's perspective!Currently, TPO is still in an uptrend. After reading briefly about the Wyckoff structure, it is predicted that there will still be a strong increase towards the 2946 area because when the price line touches 2946, it is a new ETH GOLD (ending 5 waves 12345 Elliot). After touching 2946 to form a UTAD, GOLD will create a new correction wave.

Nifty MIDCAP 100 End of Correction ABC Correction seems to have ended for Midcaps . Lets see if its 12345 or and ABC

EURUSD - Elliott Analysis 1:14 Risk RewardFibonacci ratios are frequently used to anticipate the length and retracement levels of ABC waves:
Wave B: Traders often look for Wave B to retrace 38.2%, 50%, 61.8%, or other Fibonacci ratios of Wave A.
Wave C: Traders often look for Wave C to be equal in length to Wave A or related to it by a Fibonacci ratio (e.g., 1.618 times the length of Wave A).
Follow Chart

#Nifty directions and levels for February 18th:Good morning, Friends! 🌞
Here are the market directions and levels for February 18th:
Market Overview
There have been no significant changes in the global markets. The global sentiment remains bullish, as indicated by the Dow Jones, while our local market is showing a moderately bearish sentiment. Today, the market may open neutral to slightly gap down, as the Gift Nifty indicates a negative move of 20 points.
In the previous session, both Nifty and Bank Nifty experienced a solid pullback after an initial decline. What’s next? The trend still seems bearish, but the pullback is accompanied by RSI divergence and some parameters supporting further continuation of the pullback. Therefore, the probability leans towards consolidation or continued pullback. Let's look at the chart.
Both Nifty and Bank Nifty structures seem similar, but the wave structures are a little mismatched.
Current View:
Based on the wave structure, there is a progressing leading diagonal in Nifty. So, even if the market opens negatively and breaks the pattern's bottom, we can expect some pullback after the decline because it's the initial wave of the motive (leading diagonal). The decline could be in the second wave of the motive. Once it starts to pull back and breaks the previous high, we can expect continuation of the pullback to the upside. This is the basic structure.
To explain it simply: the pullback has bullish momentum. So, even if the market starts negatively (as indicated by Gift Nifty), we can expect a pullback after some decline because RSI and other parameters support it.
Here, a correction will occur only if the decline forms in a straight line and consolidates around the previous bottom. Until then, we could maintain a bullish bias in today’s session.
Alternate View:
The alternate view suggests that if the market opens with a gap up or if the initial market takes a pullback, the rally will likely continue with some rejections.

#Banknifty directions and levels for February 18th:Current View:
the pullback has bullish momentum. So, even if the market starts negatively (as indicated by Gift Nifty), we can expect a pullback after some decline because RSI and other parameters support it.
Here, a correction will occur only if the decline forms in a straight line and consolidates around the previous bottom. Until then, we could maintain a bullish bias in today’s session.
Alternate View:
The alternate view suggests that if the market opens with a gap up or if the initial market takes a pullback, the rally will likely continue with some rejections.

Coromandel - EW Analysis - Short tradeWe have done a pullback in X and at a key resistance level now.
Expecting next leg down to start anytime. Good RR here for a short with 1905 as SL.
Targets 1800, 1750, 1700.
