Reliance is leading the Fall in NiftyA possible Head & Shoulders formation will likely give confirmation.
Right Shoulder may form either near 1420 or 1530 with Neckline around 1335-1340.
Likely to terminate between 1110 to 1000.
View negates with a close above 1551.
Elliott Wave

Budget day Nifty Strategy for Feb 01, 2026Wrap up:-
After hitting of Trailing Sl in wave 3 counts have been changed and internal wave 2 of major wave 2 is still pending because Nifty has made 1-2 and internal 1-2 for a impulsive move of wave c of b of y of 4. Now, wave 3 is about to start and also, breakout will be confirmed once nifty breaks 25475.
What I’m Watching for Feb 01, 2026 🔍
Sell Nifty @25315 sl 25458 for a target of 25131-25075.
Buy Nifty @25131-25075 sl 24919 for a target of 25613-25710.
Disclaimer: Sharing my personal market view — only for educational purpose not financial advice.
"Don't predict the market. Decode them."

Nifty – Technical Outlook before Budget.Nifty – Technical Outlook
As per the current Nifty weekly and monthly chart analysis, the index is trading within a broad consolidation range between its all-time high zone of 26,300 and the key support area near 25,160. The price structure indicates a flat correction formation as per Elliott Wave theory.
Based on the wave structure and momentum indicators, the ongoing flat correction appears to be in its final stage. Once completed, the market is expected to witness a five-wave downside move, which would mark the next corrective leg in the broader trend.
As per the chart structure, the potential correction from current levels could extend in the range of approximately 6–10%.
On the monthly timeframe, Nifty has formed an Evening Star candlestick pattern, which is a bearish reversal signal and indicates underlying weakness in the market structure.
Budget Session Outlook
During the budget session, Nifty may witness a pullback or bounce toward the 25,650 – 26,063 zone However, this upside is likely to be corrective in nature and may represent Wave 2 of the anticipated five-wave downside structure.
⚠️ Buying should be avoided in this resistance zone, as risk-reward does not favour fresh long positions at these levels.
Shorting Opportunities
Primary short opportunity:
If the index shows rejection or reversal signals in the 25,650 – 26,060 resistance zone , it may provide a favourable setup for short positions.
Confirmation-based short opportunity:
A decisive close below 25,160 (which also coincides with the 200 EMA) would confirm downside strength and offer another high-probability shorting opportunity.
Invalidation Level
This bearish outlook will be invalidated if Nifty closes above 26,350 and sustains above this level, which would negate the current Elliott Wave and corrective structure.

Nifty Analysis for Feb 01, 2026Wrap up:-
Trailing Sl in wave 3 has been hit and now, Nifty has made wave 1 at 25435 and in wave 2 nifty has been making abc correction of which a is completed at 24932, b at 25458 and now, wave c is in progress.
What I’m Watching for Feb 01, 2026 🔍
Sell Nifty @25350 sl 25458 for a target of 24954-24920.
Disclaimer: Sharing my personal market view — only for educational purpose not financial advice.
"Don't predict the market. Decode them."

Updated Nifty Analysis for Feb 01, 2026Wrap up:-
Trailing Sl in wave 3 has been hit and now, Nifty has made wave 1 at 25435 and in wave 2 nifty has been making abc correction of which a is completed at 24932, b at 25458 and now, wave c is in progress.
What I’m Watching for Feb 01, 2026 🔍
Buy Nifty only above 25386 for a target of 25613-25710 -25818-25937.
Sell Nifty below 25270 sl 25370 for a target of 24954-24920.
Disclaimer: Sharing my personal market view — only for educational purpose not financial advice.
"Don't predict the market. Decode them."

SILVER (XAGUSD) – Expanded Flat Correction Completed?Silver appears to have completed an Expanded Flat (ABC) correction on the 75m timeframe.
🔹 Wave B expanded beyond the origin of Wave A, fulfilling the core requirement of an expanded flat.
🔹 Wave C unfolded as a strong impulsive decline, extending into the 1.618 – 2.618 Fibonacci extension zone.
🔹 Price is now testing rising channel support, aligning with historical structure and long-term trend support.
This zone represents a high-confluence area where sellers may be exhausting. A reaction or corrective bounce is likely, while a clean break below the channel would invalidate the setup.
⚠️ Invalidation: Sustained acceptance below the channel and failure to reclaim the 2.0 extension level.
🎯 Bullish scenario: Reaction from channel support → corrective rally back toward 0.382–0.5 retracement.
Not financial advice. Always manage risk.

Nifty – Complex Corrective Structure on Lower Timeframe (ElliottThe attached chart illustrates a developing complex correction in Nifty on the lower timeframe, with multiple flat structures and a terminal impulsive sequence.
Wave (a) – Flat Correction
Wave (a) (marked in red) unfolds as a classic flat, where the internal (A)–(B)–(C) subdivision (in blue) follows a 3–3–5 structure. The retracement in wave (B) is relatively deep, consistent with flat correction behavior.
Wave (b) – Flat Correction
Wave (b) again resolves as a flat correction, reinforcing the sideways and overlapping nature of the broader corrective phase. Price action during this segment remains choppy, typical of corrective markets.
Wave (c) – Five-Wave Impulse
Wave (c) progresses as a clear five-wave impulse, adhering to Elliott Wave principles:
Wave 1: Initiates the bullish leg from the wave (b) low.
Wave 2: Forms a flat correction, providing a controlled retracement without violating wave-1 origin.
Wave 3: Extends impulsively, showing strong momentum and range expansion.
Wave 4: Develops as an expanding triangle (A–B–C–D–E), indicating volatility expansion and time correction.
Wave 5: Concludes with an impulsive push to complete wave (c).
Overall View
The structure suggests a mature corrective pattern composed of multiple flats and a final impulsive leg. Such formations often precede either a higher-degree trend resumption or a larger consolidation. Traders should be mindful of false breakouts and overlapping moves, as complex corrections can remain range-bound longer than expected.

Nifty Analysis for Jan 29, 2026Wrap up:-
Nifty has made 1-2 and internal 1-2 for a impulsive move of wave c of b of y of 4 and now, heading towards wave 3 and also, breakout will be confirmed once nifty breaks 25475.
What I’m Watching for 29 Jan, 2026 🔍
Buy Nifty above 25373 sl 25186 for a target of 25475-25613-25710.
Disclaimer: Sharing my personal market view — only for educational purpose not financial advice.
"Don't predict the market. Decode them."

ZENTECH Bullish Breakout: Falling Wedge Resolves Within Long-TerZENTECH is currently trading within a long-term triangle structure, indicating prolonged consolidation before a directional move.
On the intermediate timeframe, price has broken out of a falling wedge pattern, which is a classic bullish reversal setup.
The breakout is confirmed above the ₹1384 zone, which now acts as an important support.
If price sustains above this breakout level, the structure suggests a continuation towards higher levels.
📈 Minimum projected target: ₹1600
As always, watch for volume confirmation and price holding above the breakout zone for further strength.
#ElliottWave #ChartPatterns #FallingWedge #Triangle #BullishBreakout #TechnicalAnalysis

BitcoinIn this chart we clearly see that bitcoin is about to end its impulse 5th wave in upcoming days..
After that we can see sharp reversal on bullish side
Disclaimer:- Invest at your own risk,, i am not register with Sebi.. This chart is according to my technical analysis which i learnt from past years

Tata Steel (4H) - Late Stage Structure: Ending Diagonal in PlayThe price action in Tata Steel on the 4H timeframe is showing characteristics of a potential Ending Diagonal forming near the tail end of the advance.
From the Wave 4 low at 177.33 , the rise has not developed as a clean 5-wave impulse . Instead, the internal structure so far appears corrective , unfolding in three waves , which keeps the Ending Diagonal scenario valid.
Structure Assessment
Wave (iii) of the 5th wave appears complete
The ongoing move is likely Wave (iv)
Cardinal rule of an Ending Diagonal: Wave (iv) must overlap Wave (i) by trading below ~191
If this overlap condition is satisfied, the final Wave (v) is expected to unfold as a three-wave advance , completing the Ending Diagonal.
Implications
Ending Diagonals typically signal trend exhaustion rather than continuation . Once the structure completes, the probability of a larger corrective phase increases.
Invalidation
No overlap below 191 weakens the Ending Diagonal view
A strong impulsive decline instead of a choppy correction would require a reassessment
For now, the focus remains on structure and rule compliance, not prediction.
Disclaimer:
This analysis is for educational purposes only and does not constitute investment advice. Please do your own research (DYOR) before making any trading decisions.

Tech Mahindra: Wave 3 or Trap?The recent rally in Tech Mahindra presents a clear structural dilemma that traders should pay close attention to.
From the lows near 1209 , price has staged a strong advance. If this move is indeed a third impulsive wave , then price must extend decisively higher , as any subsequent Wave 4 should not overlap the 1732 region . A sustained hold above this level would keep the impulsive bullish scenario intact.
However, failure to extend meaningfully higher raises an alternate and equally important possibility. In that case, the entire decline from the prior highs near 1807 is better interpreted as a higher-degree (A)–(B)–(C) zigzag correction . The internal structure already supports this view, with the ABC correction unfolding as a textbook 5–3–5 zigzag .
In the near term, price may still attempt marginal new highs , but with RSI already in the overbought zone , any further upside is likely to be accompanied by bearish momentum divergence , signalling potential exhaustion rather than strength.
If the higher-degree zigzag scenario confirms, the next phase would be a five-wave decline , with the risk of price eventually breaking below the lows of Wave (A) near 1209 .
Key takeaway:
This is a classic extension vs exhaustion setup. The coming price action will decide whether Tech Mahindra is building a powerful third wave — or merely disguising a larger corrective structure .
Disclaimer:
This analysis is for educational purposes only and does not constitute investment advice. Please do your own research (DYOR) before making any trading decisions.

Base channelling techniqueIn my early days plotting waves , I used to plot them in thin air . The counts did not have any foundation . As a result I use to have many alternate counts , it was a period of great uncertainty and confusion . J. Kennedy taught this technique called Base channelling.
Basic rule : When a base channel breaks a 5 wave move is complete . And support will occur a one lower level of base channel . This is shown in this scrip . And always remember base channel can be very thin but still are solid support areas .

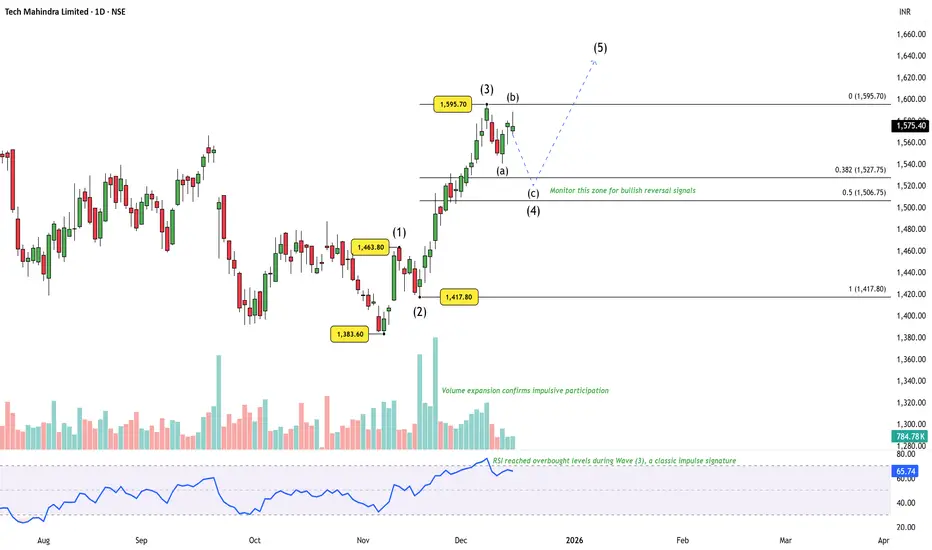
Tech Mahindra: Structure Still Favors One More Upside LegPrice action from the ₹1383.60 low has unfolded as a clean impulsive sequence, with Waves (1), (2), and a strong Wave (3) already in place. The advance was supported by clear volume expansion , validating the impulsive nature of the move. Momentum also peaked during Wave (3) , with RSI reaching overbought levels — a classic third-wave signature .
Following the Wave (3) high near ₹1595.70 , price has transitioned into a corrective phase. The decline is best interpreted as Wave (4) in progress , with only the (a),(b) legs formed so far. The structure continues to respect the typical Fibonacci retracement zone , keeping the broader bullish setup intact. A final (c) leg is still expected before Wave (4) can be considered complete.
Importantly, the higher-degree context does not materially alter the forward expectation . Whether the move from ₹1383.60 marks the start of a fresh impulsive advance , or represents the internal Wave C of a larger corrective pattern unfolding as a five-wave structure, the current setup continues to favor one more upside leg — Wave (5) .
That said, patience remains key . Focus remains on identifying a proper Wave (4) termination before anticipating continuation higher.
Disclaimer: This analysis is for educational purposes only and does not constitute investment advice. Please do your own research (DYOR) before making any trading decisions.
DLF 15-Min: Impulse Attempt in PlayPrice action on the 15-minute chart shows early signs of an impulsive advance . Wave (i) and (ii) appear in place with a clearly defined invalidation at 604.55 . As long as this level holds, the structure favors a Wave-(iii) expansion toward the marked targets. A corrective Wave-(iv) pause may follow before one more leg higher completes the sequence, potentially forming a higher-degree Wave 1 .
Levels are marked. Structure will decide.
Disclaimer: This analysis is for educational purposes only and does not constitute investment advice. Please do your own research (DYOR) before making any trading decisions.

Natural Gas : Bullish with the key level 2.600Earlier I posted but it this post I changed the count of motive waves instead of impulse wave!
i:e: taking this whole upside move as an expanding diagonal structure
which suggest wave 3 of higher degree can take the prices up to 6.500
key level for this scenario is 2.600

GOLD SPOT VIEWGOLD POSSIBLE MOVE
WAVE 4 4950 4980
WAVE 5 5240 5350
View is for study purpose only , we are not recommend any trade or investment
Always do your own analysis
4924 below sustain invalidation

Maruti Suzuki - A Solid OpportunityMaruti Suzuki has entered into short term bearish mode.
It is down nearly 7% from the top in last 2 weeks, confirming a strong downside momentum.
Structure: Playing Wave C, of 4 in short term.
Trend: Bearish
Also a clear divergence in RSI indicator at the top
Trade Setup: Short
Target: 15270/-
StopLoss: 16500/-
Notes
This is a classic Elliot wave pattern. Wave C generally moves fast.
⚠️ Disclaimer: Not financial advice. Manage risk properly.

Paytm - Is a Bearish Barrier Triangle Signaling a Deeper CorrectLooking at the 4H chart for One 97 Communications Ltd. (Paytm), Am seeing a classic consolidation pattern following a strong impulsive move. After completing what appears to be a 5-wave sequence (blue labels), the price action is now squeezing into a Barrier Triangle structure—a specific Elliott Wave pattern that often precedes a sharp "thrust" in the direction of the larger trend.
Wave B did an exactly 0.786 retracement.
Below 1260, its gonna be a straight fall to 1100 odd.
RSI already indicating a clear breakdown.

AdaniEnt – When headlines meet structure: Wave C in progress
Adani Enterprises completed an intermediate-degree Wave 5 on 21 Dec 2022 and has since been undergoing a corrective phase, forming a classic zigzag, with Wave A and Wave B already complete. The sharp decline following the Jan 2023 Hindenburg report merely accelerated the Wave A that was already in place.
The corrective pattern since the top is best classified as a zigzag (A-B-C).
Wave A unfolded as a 5-wave impulse, with Wave (iii) showing a clear extension (SW5 extension at 1.618x of SW1-2) and Wave (v) concluding at ~38.5% of Wave (iii) on 28 Feb 2023.
Wave B retraced ~86% of Wave A, which is insufficient for a flat correction and hence confirms a zigzag structure.
Wave C is currently in formation.
As per Elliott Wave Principle, Wave C of a zigzag must at least equal Wave A, implying the possibility of a lower low or, at best, an equal low relative to the termination of Wave A.
The sharp fall on 23 Jan 2025, following news related to US SEC proceedings, aligns with this ongoing Wave C decline. From a structural standpoint, further downside remains open unless the wave count is invalidated.
Strategy: Sell on rallies, keeping the broader corrective structure in mind.

Dabur India Ltd: A Double Zigzag Within DistributionThe rally into the 577 high marked the completion of a mature advance, with momentum clearly fading near the top. Since then, price action has transitioned into a corrective phase.
The decline from 577 is unfolding as a higher-degree W–X–Y correction . Within this structure, the bounce from 479.15 has been overlapping and choppy, lacking impulsive strength. Structurally, this recovery is shaping into a double zigzag , reinforcing that the move is corrective.
This is a distribution phase, not accumulation.
The market is rotating out, not building fresh long exposure.
If this interpretation holds, the entire correction from 577 is expected to complete as a W–X–Y double zigzag , effectively forming a double zigzag within a higher-degree double zigzag — a structure typically seen during extended distribution phases.
From a Fibonacci perspective, the final leg of the correction is projected to terminate near the 0.786 retracement around the 464 zone , where price, structure, and retracement align. This zone becomes the most logical area for the correction to fully mature.
Until price shows clear impulsive behavior and breaks above key resistance, rallies should be treated as corrective bounces within distribution , not trend continuation.
Disclaimer: This analysis is for educational purposes only and does not constitute investment advice. Please do your own research (DYOR) before making any trading decisions.

Leading Diagonal to Double Zigzag – Jio Financial’s Full CycleFrom the lows of ₹198.65 , the stock kicked off with a classic leading diagonal — an overlapping structure, exactly how impulsive moves often begin when sentiment is still uncertain. This marked the start of a larger impulsive advance.
Post the Wave 2 low at ₹203.10 , price surged into a powerful Wave 3 rally toward ₹338.30 . Momentum confirmed the strength of this move, with RSI overshooting well into the overbought zone , validating the impulsive nature of the advance.
The rally ended with Wave 5 topping marginally above Wave 3 , but momentum failed to confirm the new high. A clear bearish RSI divergence signaled exhaustion near the top.
Since then, price has transitioned into a W–X–Y double zigzag correction , unfolding neatly within a well-aligned descending channel . Typically, such structures resolve with an upside breakout, but markets don’t always follow the textbook.
Instead, price has broken below the channel and is now sitting exactly at the 0.618 Fibonacci retracement of the entire impulse near ₹252 .
From a momentum perspective, RSI is deeply stretched and hints at a possible relief bounce . If that bounce materializes, it is likely to be corrective in nature — potentially a retest of the broken channel — before one final leg lower.
The ideal structural path would be:
A short-term bounce to cool off RSI
Followed by a final Wave (v) decline below ₹252.25
Ideally accompanied by bullish RSI divergence or a clear bullish reversal candlestick
Such a move would complete Wave (c) of Y , thereby finishing the broader W–X–Y corrective structure . The correction is expected to terminate near the major pivot support zone between ₹236 and ₹228 , just above the 0.786 Fibonacci retracement .
For now, this remains a wait-and-watch setup .
Patience is key rather than bottom fishing . Let price action confirm strength — meaningful reversals usually come with clear signals, not guesses.
Disclaimer:
This analysis is for educational purposes only and does not constitute investment advice. Please do your own research (DYOR) before making any trading decisions.

BEL in a Contracting Triangle — Wave 5 Loading?From the ₹240.25 low , Bharat Electronics Limited delivered a powerful upside rally , completing a higher-degree Wave 3 near ₹436 . The advance was strong, extended, and impulsive , clearly establishing the larger bullish trend.
Post the Wave 3 peak, price did not reverse impulsively . Instead, it shifted into sideways consolidation , suggesting a time-wise correction rather than price-wise damage . This behavior fits well with a Wave 4 contracting triangle , a common pause before the final leg of an impulse.
Structurally, the consolidation aligns with an A–B–C–D–E triangle , with price now appearing to be in the final leg — Wave (E) . This leg is expected to unfold as a 3-wave corrective decline (A–B–C) , terminating near the rising A–C–E trendline . A brief throw-under below this trendline remains structurally acceptable and should not be mistaken for a breakdown.
Trade Structure (Execution Focus)
The preferred entry lies near the A–C–E trendline , only if price prints a bullish candlestick pattern , indicating completion of Wave (E).
Invalidation is clearly defined below the low of Wave (C) .
If the triangle resolves as expected, a breakout would signal the start of a higher-degree Wave 5 , with upside potential beyond the Wave 3 high near ₹436 .
Fundamentally, recent order inflows support the broader bullish context , but this remains a structure-led setup , where price confirmation matters more than headlines .
In summary , Wave 3 is complete , Wave 4 is maturing , and Wave (E) completion is the final checkpoint before the next directional move.
Disclaimer: This analysis is for educational purposes only and does not constitute investment advice. Please do your own research (DYOR) before making any trading decisions.
