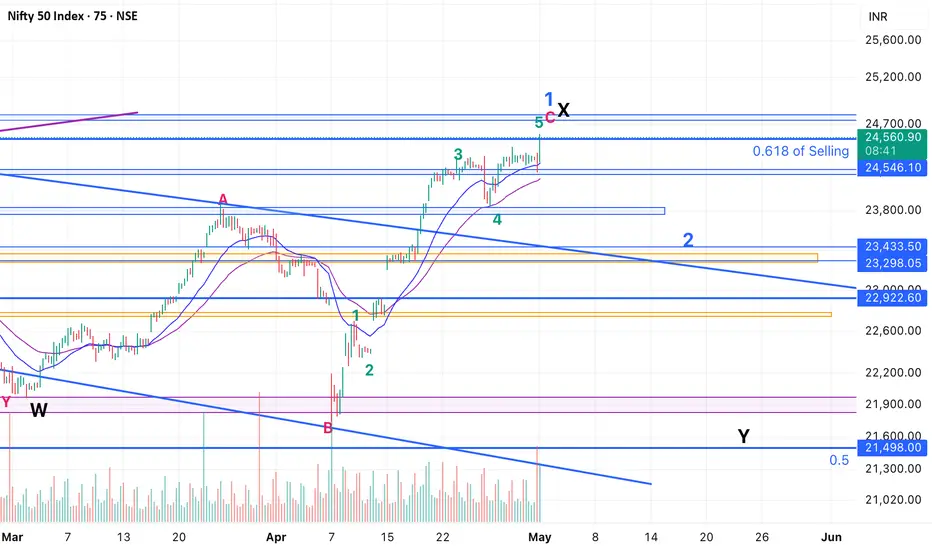
Nifty - Elliot Wave Update So, thankfully we have been aligning are views with the market and reviewing counts at the right time. Lucky much? :)
On May 2nd - We caught the top, when the breakout didn't look convincing
We got a good correction (Correction was even better in stocks) and booked out at around 24k on May 9th, and changed views, again as the fall wasn't as bad as it was expected after the end of 5th. Hence, it made sense to expect a 5th up.
This change in view helped us ride a good move of +1000 points in Nifty and multiple +10% moves in stocks (crazy moves there).
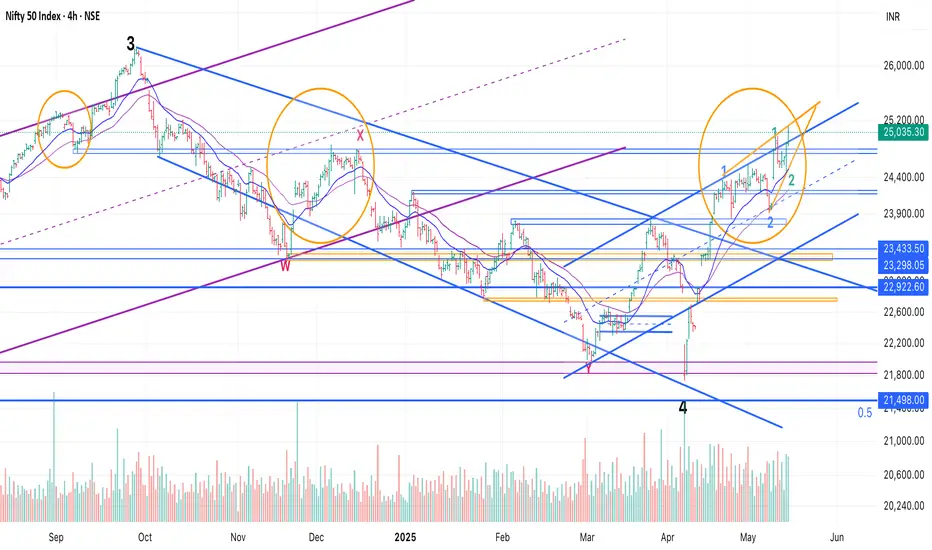
Now, while the view shared on May 9th still remains valid, there's an even more bullish view possible.
Ideally, I should have waited for more clarity, but thought that someone shouldn't book out of positions, if it's actually that.
So, there are two scenarios:
1. We are in 5th up/ which got done, is about to be done. In this case we head down to 23500 or so and then we review if this bounce was corrective or we are going to ATH.
2. We did 1 and 2 and have started 3 up. Within 3 we started the 3rd up today. If this is true, the run up should continue for next few days.
How to decide, I am keeping 61.8% of today's move as a deciding factor. So, if we come back to 24700, I'll be out of longs - will even book cash trades and wait for clarity to re-enter.
P.S.: You must be wondering, what the two Orange circles denote - Well they are for reminding me that this price action can be a trap, as it has happened in past. :D
Though looking at set-ups in stocks and the way they are moving after clearly defining a base - I am quite confident that the low has been made for this correction.
As usual, important to track closely and be nimble to change the view and humble to accept mistakes :)
All the best!
Elliotwaveanalysis
NIFTY ITHello & welcome to this analysis
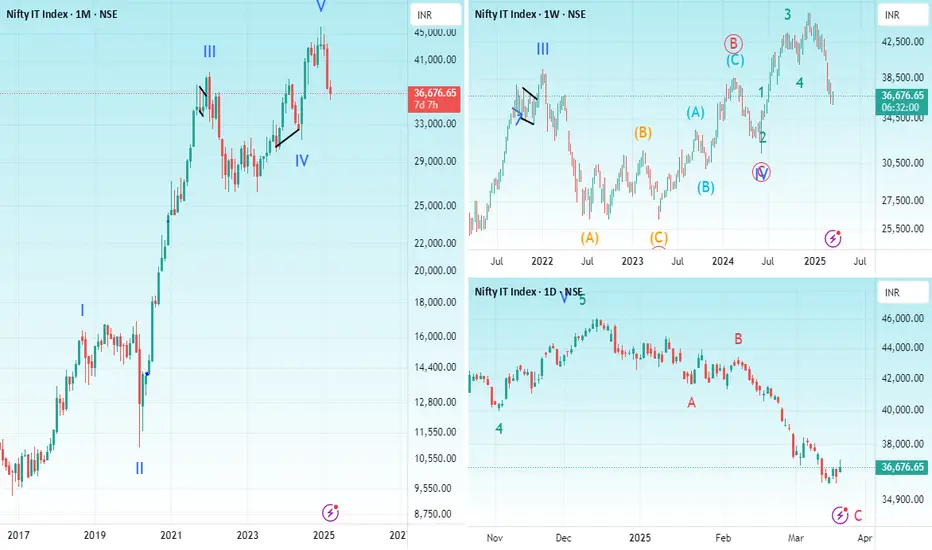
NIFTY IT (CNXIT) appears to have completed in
Monthly from 2016 lows an impulse 5 waves up
Weekly shows a running flat wave 4 followed by sub waves of the terminal 5th wave
Daily indicates post the impulse an ABC corrective ended (ending)
is this A of abc down after a monthly 5 up or is it wave 2 complete with this ABC?
It is too early to say the latter. Normally the corrective tends to retest the start of the preceding sub wave 4 that is around 31000 but that is not mandatory as per Elliott Wave rules.
An early indication of which wave is unfolding will depend on how the sub waves come out now, either they will be corrective, then it would be B of abc or they will be impulse then wave 2 has ended and index is into Wave 3.
Interesting days ahead for IT index
All the best
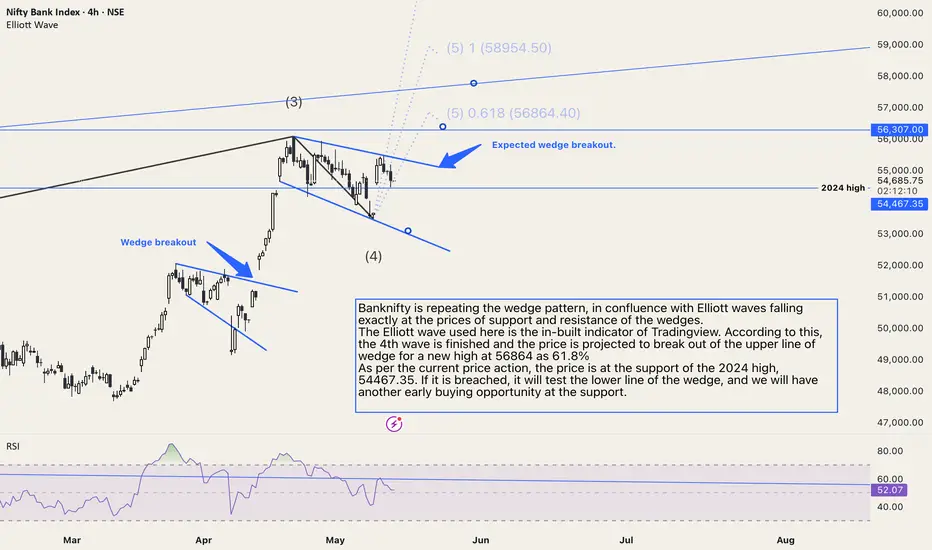
Banknifty combining Elliott and wedge theoryBanknifty is repeating the wedge pattern, in confluence with Elliott waves falling exactly at the prices of support and resistance of the wedges.
The Elliott wave used here is the in-built indicator of Tradingview. According to this, the 4th wave is finished and the price is projected to break out of the upper line of the wedge for a new high at 56864 as 61.8%
As per the current price action, the price is at the support of the 2024 high, 54467.35. If it is breached, it will test the lower line of the wedge, and we will have another early buying opportunity at the support.
The RSI is still above 50; therefore, the 2024 high level is proving to be good support. No selling is suggested unless the price is trading above this support level of 54467.35.
Silver MCX - Elliot Wave Counts - Long TradeSilver lagged Gold in the entire run up through the year
However, in last week Silver held quite well, while Gold has been correcting.
It seems like weekly Wave 4 is done and 1,2 of Wave 5 are done.
Wave 3 - targets 1.1L, 1.15L. Wave 5 targets + 1.2L
All the best!

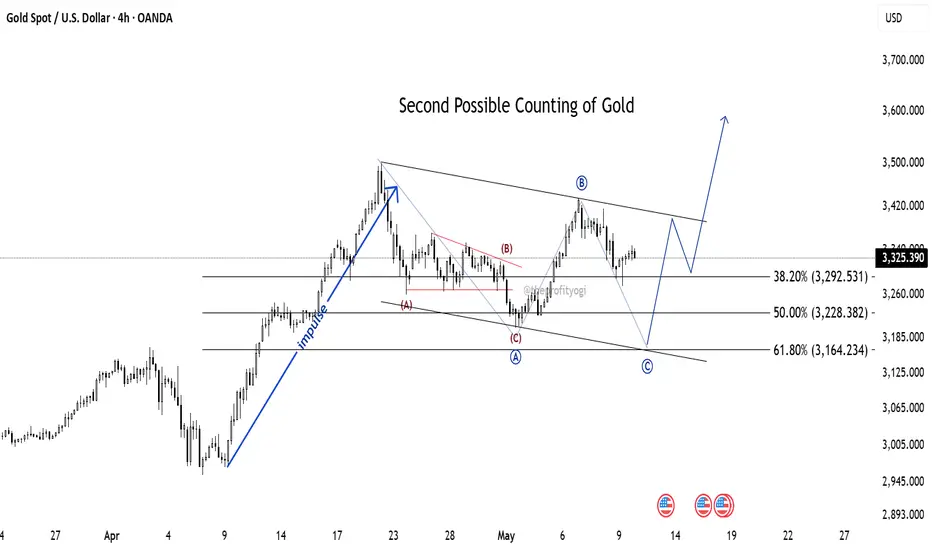
Another Possible Elliott Wave counting of GoldCounting 2:
Here, after an impulse, a Zig-zag correction is formed (marked in red ABC)
Here, I have assumed that this is just point (A) of further correction (in blue colour).
Then the price has gone to form wave (B), and currently the market is in wave (C).
This correction will complete near 61.8% (near 3164 level). And from here, a new impulse will start.
This analysis is based on Elliott Wave theory and Fibonacci study.
This analysis is for educational purposes only.
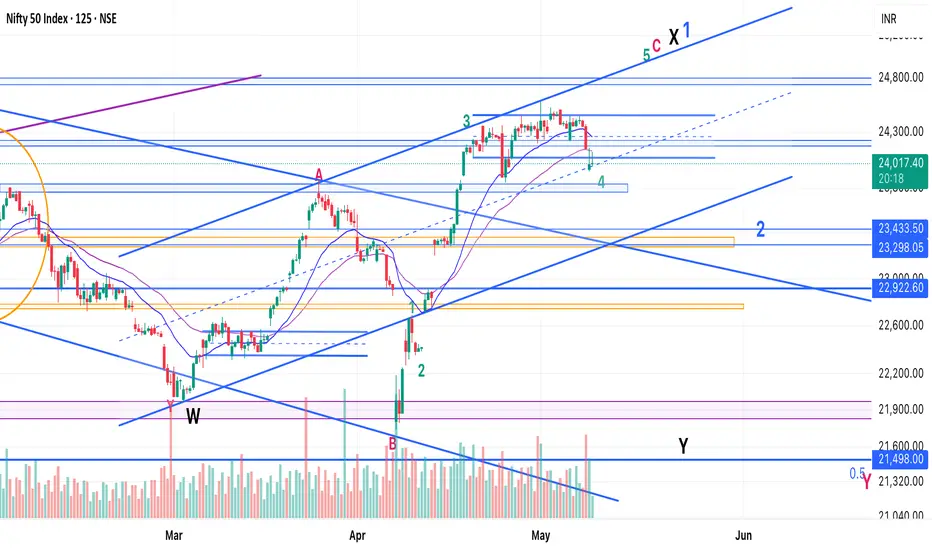
Nifty - Elliot Wave - Alternate counts - Bullish ScenarioI called a top on May 2nd as the buying looked like a trap - which usually acts as a good end of a trend move.
It worked out quite well, but we didn't get a selling momentum, that I expected.
So, contemplating if we are still in 4th and there's another leg up pending, which should be:
1. Bearish scenario - C of X - Y down should take us to new lows
2. Bullish Scenario - 1 of 5 (weekly) - We should have a 2 and then head up in waves 3 and 5 to 27-30k.
It's a tricky position to be in.
Plan: Keep position light and let the 5th up complete. In both bullish and bearish scenarios, we'll get a good retracement from there - Min 23500 (in 2) and can go till 21500 - 20500 in Y.
Ride the leg down and then take a call if it's bottoming out earlier or we are heading down?
For the time being, I have booked all of my shorts and awaiting clarity.
Cheers - All the best!
Bitcoin - Elliot Waves - Minor Counts (Last leg up)Here are the counts of the 5th of 5th that's going on. 108-110 should be max it goes.
Target after this is 60k.

BTC - Elliot Wave - Last Leg - 60k Coming AgainBTC completing the pending 5th of 5th of 5th.
God - this is going to be a painful correction.
P.S.: There could still be some steam left, but once done we are looking for 60k again!
All the best!

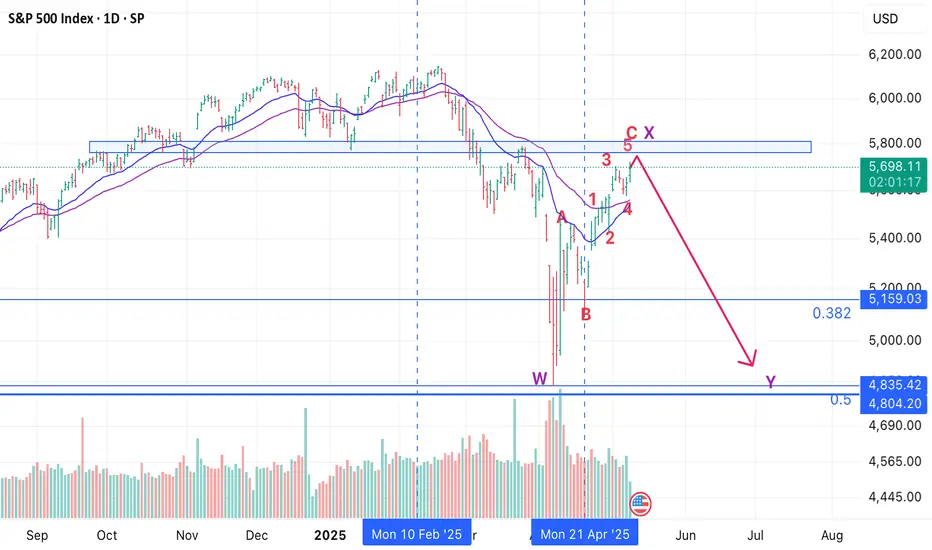
SPX - Elliot Wave Update -PullBack Over - Time for next leg downSPX has pulled back in an ABC with 5th of C going on today.
Good time to short and ride at least 10%, if lucky 15-20% :)
All the best!
Nifty - Elliot Wave Analysis - Short Opportunity!We have had a good run-up from April lows. Today's buying seems like the last leg up which should end 5th up.
Now there are two possibilities:
1. Bullish Scenario: Nifty has completed correction in April first week and we have done Wave 1 in an impulse of 5 waves up. In this case we should retrace 38-50% of the move from April lows. So, expect 500-1000 points in Wave 2.
2. Bearish Scenario: The entire move up from April lows was corrective and part of larger X. X is formed by ABC where C is 5 waves up - i.e. the move from April first week lows.
If this is the case, then we head to new low in Y. 21500 or lower.
In both cases this is the time to initiate shorts and ride at least 500 points the move down. All the best!
Nifty CMP at 24335 At this level according to waves it can be preparing for final wave (v) but only if it crosses 24550, till then we should be only observe it as wave 4 correction phase,
No short OR EVEN No long in this range ,

GBP/USD at a Turning Point – Correction Pattern in PlayIt appears that the corrective Wave A in the GBP/USD pair is nearing completion, and the formation of Wave B may be underway. The Wave 1 to 5 structure seems to have been completed, indicating the beginning of an A-B-C corrective phase.
If the correction unfolds as expected, potential upside targets are 1.32918 and 1.33555. However, if the market faces rejection below the trendline, the stop-loss level would be 1.32021.

CHFJPY triangle formed big rally ahead#CHFJPY
Sharing a perfect trade, please take a look at below Image,
As per EWT wave 4 Triangle is formed, is near a demand area
wait for price to react .
and the trade starts boom 💥🚀🚀 wave 5 - approx. 400 pips move.

#Nifty Investors who missed post covid Rally - Time is Now !!!Nifty set for a massive rally as per wave theory.
Chartical representation of my morning market view.
It formed triple correction pattern,
W,XY,Z
As index failed to close above 23800 (Wave X) in last rise started from 21964 levels, wave z is last phase of correction.
Watchout for trend change on daily charts in coming days which would leqd to a strong counter trend rally equal to the intensity of this fall.
🤞🤞🤞

EUR/NZD Wave Structure Shift: 4th Wave Correction in ProgressThe 3rd wave in EUR/NZD appears to have been completed, and the market seems to be entering the 4th wave. There is a possibility that the 4th wave could take support near the Fibonacci 0.5 level (1.19164). After that, the 5th wave of the impulse phase may move upward.
If the market falls below 1.98303, it would confirm the beginning of the 4th wave. In that scenario, the first target could be around 1.95907 .

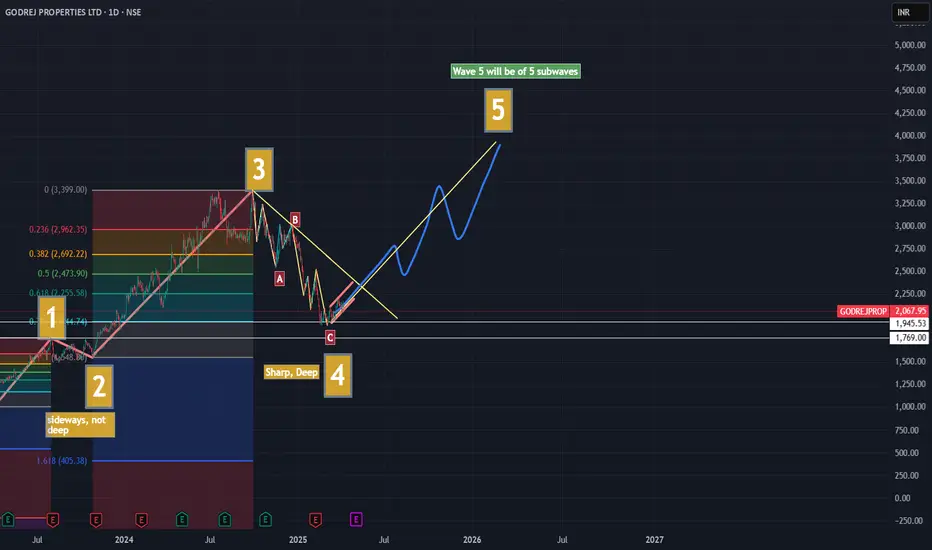
Godrej Properties is About to Start UptrendElliot Wave analysis of the stock shows following important things:
1. We are currently at the end of Wave 4 (Correction Wave)
2. Wave 2 was sideways and not deep. Thus as per the rule of alternation, the wave 4 was going to be sharp (zigzag) and deep. It has turned out to be so. It retraced as much as 78% of the Fibonacci levels.
3. Wave 4 - ABC had following waves -
- A - 3 Waves
- B - 3 Waves
- C - 5 Waves
Thus, the 3-3-5 Waves pattern has been established and verified.
What is current situation?
Currently, if analysis is correct, it is in the beginning of 5th Wave. It is ahead of Nifty 50 which is yet to start the 5th wave.
If it is not in beginning of 5th Wave, it still doesn't have much room anyway left to fall before it begins to reach into 1st Wave territory at 1769 Levels.
That is extremely unlikely event. If it happens so, then the wave count will change and entire 1st and 3rd wave will become 1st Wave.
This is my understanding. Open for the community views.
note: Personal Views only. No buy/sell recommendation.
XAU/USD: 5th Wave Rally After CorrectionOn the 1-hour timeframe, XAU/USD has formed an Elliott Wave corrective structure. This is an expanded flat correction, typically seen in the 4th wave. The correction seems to have been completed at 3,054, suggesting that the 5th wave may be in progress.
For bullish traders, a potential long position can be considered around the 0.236 retracement level as a pullback entry point.
The 5th wave has the potential to reach the following upside targets: 3,110, 3,145, 3,165
However, this bullish outlook remains valid only if the low of Wave IV holds. A breakdown below this level would invalidate the bullish scenario.

GBP/USD Technical Outlook: Elliott Wave Mapping the Next MoveThis GBP/USD 4H chart presents an Elliott Wave analysis.
Wave (1) and (2): The market had an impulsive bullish movement in Wave 1, followed by a corrective Wave 2.
Wave (3): A strong bullish move with momentum.
Wave (4): A corrective phase, forming a triangle pattern (a-b-c-d-e), which suggests the market is preparing for another impulsive leg.
Entry Confirmation: A breakout above the triangle pattern.
First Target: 1.31457 (Fibonacci 0.382)
Second Target: 1.32105 (Fibonacci 0.5)

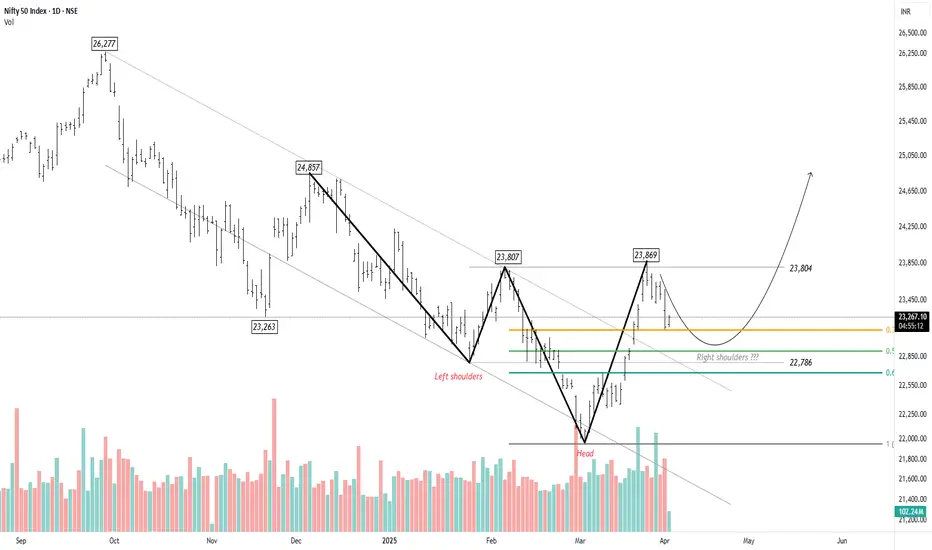
Nifty - Awaiting the Fifth Wave for a BreakoutNifty recently hit a low of 21,905 , marking a key reversal point in the trend. A well-defined Head and Shoulders pattern is emerging, with the right shoulder currently forming. The ongoing pullback has retraced to the 38.2% level, but there is potential for it to extend towards the 50% mark at 22,906 . However, the upward move appears to be losing momentum, with buying interest remaining subdued.
Based on the chart, the head of the pattern signifies the beginning of a new impulse wave. This appears to be the fourth wave within the larger first wave. Once Nifty completes this corrective phase, the fifth wave is expected to present a trading opportunity. If wave equality holds, Nifty could potentially rise to 24,857 .
Zomato is showing weakness it may test 170 soon.Zomato is weak on monthly and weakly chart. It forms Fake breakout with double top pattern on monthly chart.
As per chart showing weakness on daily chart also as RSI drag below 40. It can short on any rise or here for target 170 soon.

NIFTY Elliott Wave Analysis - Long Term targetAfter taking a strong run-up from COVID swing low, Nifty corrected 18% from Oct 2021 till June 22. The correction also followed Elliott Wave principles of the 5 main waves.
From June 2022, a larger Elliott Wave is in progress with Wave 3 lasting almost 1.5 years, from March 2023 till Sep 2024.
Wave 5 targets can take Nifty above 30k, before we see another major correction that can bring it down to 20k levels.
This timeline coincides with the famous Samuel Benner's Market Cycle theory, which states 2026 as a "year of good times, high prices and right time to sell stocks".
medium.com

AUDUSD - SELL - Wave 5 - Elliott wave AUD/USD (Australian Dollar/US Dollar) is a major currency pair in the Forex market, representing the exchange rate between the Australian Dollar (AUD) and the US Dollar (USD). It is influenced by factors such as:
Commodity Prices: Australia is a major exporter of commodities like iron ore and gold, so AUD/USD is highly correlated with commodity price movements.
Interest Rate Differentials: The Reserve Bank of Australia (RBA) and the US Federal Reserve's interest rate decisions impact the pair significantly.
Market Sentiment: AUD is often seen as a risk-on currency, meaning it strengthens during times of global economic optimism and weakens during uncertainty.
US Economic Data: Since USD is the world's reserve currency, US economic indicators like inflation, employment, and GDP growth influence AUD/USD.
This pair is popular among traders due to its liquidity and volatility, making it a favorite for both short-term and long-term strategies. Are you currently trading AUD/USD, or just analyzing it?

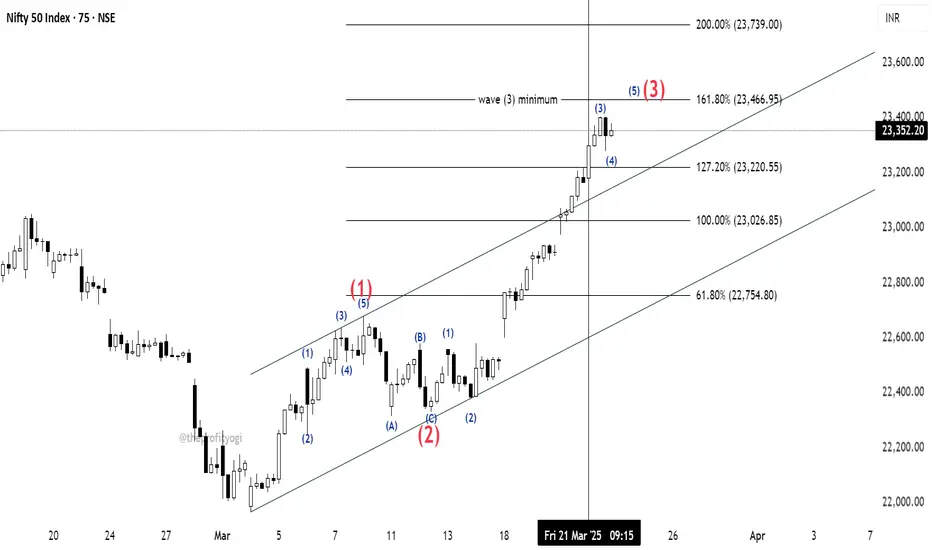
NIFTY detailed countingAs discussed in the last post, NIFTY's price has crossed over 23026.85 before 21st March so we can count the current move as wave (3). We can also see that price has broken the base channel, which is an important sign of wave (3) progression.
The detailed counting is given in the chart.
As we can see, the price is in subordinate wave 3 of the bigger wave (3).
The minimum target of Trending Impulse is 161.8% as per the rule.
We can expect the price to touch that level in the upcoming session.
I have marked, for now, a bigger wave (3) (in red) at 161.8% but as mentioned earlier, it is just the minimum target of it and the price may go beyond this level too.
This analysis is based on Elliott Wave theory and Fibonacci.
This is not any buying recommendation.
This analysis is for educational purposes only.