DrReddy - What A Fall 5400 to 4400- What Next?As per last update suggested an hour back on previous idea mentioned below (DrReddy- Dramatic Selling from 5400)- avoid selling if stock holds or crosses back above 4400
--------------------------------------------------------------------------------------------------------------------------
Trade active: 12:06 Hrs / 2nd Feb2021
Last @ 4406
Avoid sell if it holds or crosses above 4400 as later crossing above 4470 - upside Reddy will get ready for 4650-4700 target zone
Sell only below 4400 as suggested earlier.
Thanks
---------------------------------------------------------------------------------------------------------------------------
Next Buy
Only Above 4670 (For Safe Traders) - Next Up move may start for targets 4650-4700 zone
----------------------------------------------------------------------------------------------------------------------------
Last Idea - DrReddy- Dramatic Selling From The Tops 5400
----------------------------------------------------------------------------------------------------------------------------
Ending Diagonal

GBPUSD: The Big Sell off - Case of Ending DiagonalSELL GBPUSD for the target of 1.34500 & 1.3200 with SL of 1.37250

Nifty Ending Diagonal About to Complete 11-Jan-2020Keep watch on level 14380-14428-14472 for reversal point
Depending on above levels possible downside levels 14060-14080-14096
These targets are of 0.618 Fibonacci levels of length of Ending Diagonal Wave 5(4-5 orange colour).
Below 0.618 move will trigger further fall next levels will be updated once top is formed
DISCLAIMER:
There is no guarantee of profits or no exceptions from losses.
The stock and its levels discussed are solely the personal views of my research.
You are advised to rely on your judgement while investing/Trading decisions.
Seek help of your financial advisor before investing/trading.
Investment Warnings:
We would like to draw your attention to the following important investment warnings.
-Investment is subject to market risks.
-The value of shares and investments and the income derived from them can go down as well as up.
-Investors may not get back the amount they invested - losing one's shirt is a real risk.
-Past performance is not a guide to future performance.
-I may or may not trade this analysis
--------------------------(((((LIKE)))))-------------------------------


Bank Nifty- Next Waves (Upside + Downside)- 1st Jan2021Happy, Healthy & Prosperous New Year2021
Last - 31235 / 15:23 Hrs/ 1st Jan2021
---------------------------------------
Trading Strategies
---------------------------------------
Plan A
Buy Close to 31200 (Stops - 31142)- Target 31400+
Plan B
Sell Later - Below 31500 (Strict Stops - 31500 & Above) Target 31000 / 30500
-------------------------------------------
Last Bank Nifty Video - Connecting Idea
-------------------------------------------

Banknifty Ending Diagonal Final up-move towards 30700DISCLAIMER:There is no guarantee of profits or no exceptions from losses. The investment advice provided is solely the personal views of my research. You are advised to rely on your judgement while investing/Trading decisions. Past performance is not an indicator of future returns. Investment is subject to market risks. Seek help of your financial advisor before investing/trading.
I may or may not trade this analysis
--------------------------(((((LIKE)))))-------------------------------
Banknifty upside getting exahusted and trading in parallel channel making ending diagonal.
On Friday before close made bullish candles and closed above major resistance 30000 suggesting upside still pending.
Banknifty in impulse up-move and in wave(3) which usually goes Fibonacci level 1.618=30760 of wave 1.
Then after that we can expect deep correction which should go
0.5 Fibonacci level 27186 or 0.618 level 26342 in wave 4
In Wave 5 expect to go near life time high.

Nifty ready to Crash for November end!Reasons to go Short on Nifty:
- Rising Channel/ Rising Wedge/ Ending Diagonal Pattern (call it whatever) has formed on Nifty 4Hr Chart
- Triple RSI Bearish Divergence + MACD Divergence
- Today we saw a Steep Sell off (Wide Range Bear Candles)
- Market breadth has shifted in favour of declines to 1:2; it was at 6:1 during the opening today
- On Nifty's Daily Chart, we got an RSI breakdown below 70 too today, Weekly RSI has not yet managed to cross 70
- FIIs had been buying vigorously since November start but today they barely bought 24.2 Cr, once they start selling we would have not only DIIs who have been selling recently but also FIIs putting that selling pressure
- Thanksgiving is on Thursday and US markets are shut on that day, the following Black Friday US markets will operate half day. And then the coming Monday is Guru Nanak Jayanti so Indian markets are shut on Monday. Hence, Long weekend ahead likely to see Long Unwinding
- Sentiment has been Extremely Positively recently and the Markets are short term overheated along with many individual stock names especially in Banking & Financials, this all calls for a Short term Correction
- If you look at individual Stock Charts of Nifty 50 Heavyweights, then you will see Weakness there too for the short term, hence the Heavyweights can drag the Index down steeply
- Remember Markets Top out on Good News and Bottom out on Bad News. With the recent Vaccine news, it seems that now all Good news has been discounted by the Markets so what's left to push it higher?
"The best trades are the ones in which you have all three things going for you: fundamentals, technicals, and market tone" - Michael Marcus, Market Wizard
Our Short Thesis for Nifty checks quite a good number of Criteria. So there you have a recipe for a High Probability Trade !
Downside Risk Open to 12,475 as per the Pattern
View Negates above today's High
Happy Trading :)

Elliot waves from Oct 29 Great ExampleWe see:
0-1 Impulsive wave
1-2 Triangle correction wave
2-3 Impulsive wave
3-4 Correction
4-5 Ending Diagonal wave
And the immediate fall

EURCHF: Ending diagonal spottedCompletion of ending diagonal. Target should be the origin of the wave pattern.

#CRUDEOIL #OIL #MCXCRUDE - set for a wave C downThe upward to sideways moves over the last few weeks seem to have ended with wave Y. If prices trade below 3005, below the diagonal triangle we should be set for a large downmove. This could be a move larger than the one that started in Sep and lead to 2600 levels. Will track as it progresses
Crudeoil in USD has the same pattern and should be headed the same way

#SBIN heading to ₹100 on longer term chartsState Bank of India at ₹100 ? This is a very real possibility if the elliottwave pattern on the long term SBI charts indicated above are right. As can be seen, the 2015 - mid 2019 overlapping but upward titled move can be charted to indicate a long term ending diagonal. The subsequent downmove is clearly impulsive and has now just completed the 4th wave upward correction. This means we are headed to ₹103 if wave 5 of this move equals wave 1.
Short term charts will be published soon with details on the internal wave counts of the current impulse.

Nifty Ending Diagonal 5th WaveNifty looks to be forming ending diagonal
Long near 11900, SL 11860 or intrady can go with SL 11880
Target 1 11960 which 0.5 Fibonacci then 12k again can be seen
DISCLAIMER:There is no guarantee of profits nor exceptions from losses.
Technical analysis provided on the chart is solely the personal views of my research.
You are advised to rely on your own judgments while taking any investing/Trading decisions.
Past performance is not an indicator of future returns. Investment/trading is subject to market risks.
Seek help of your financial advisors before investing/trading.
I may or may not trade this analysis.
-------(((((Please LIKE & Donate Coins to support my analysis)))))-------

ICICI BANK Trading idea and analysisDisclaimer: Don't just blindly Trade or Invest, learn and then trade. Manage your risks properly.
This analysis is purely for EDUCATIONAL purpose, just to give an idea on the price movements!!
DO NOT FORGET to put your own STOPLOSS!!
If the price is unable to take out the red zone in 1hr & 4hr time frame then it will consolidate in between the red and green zones.
If overall market sentiments are negative & do not sustain the green zone then it will fall to the redline.
ICICI Bank is a portfolio stock and investor can buy it on every dip, in every fall of price to invest in it for the long term.
If you earn from my ideas, kindly consider donating small part of your profits to those in need.
ThankYou!

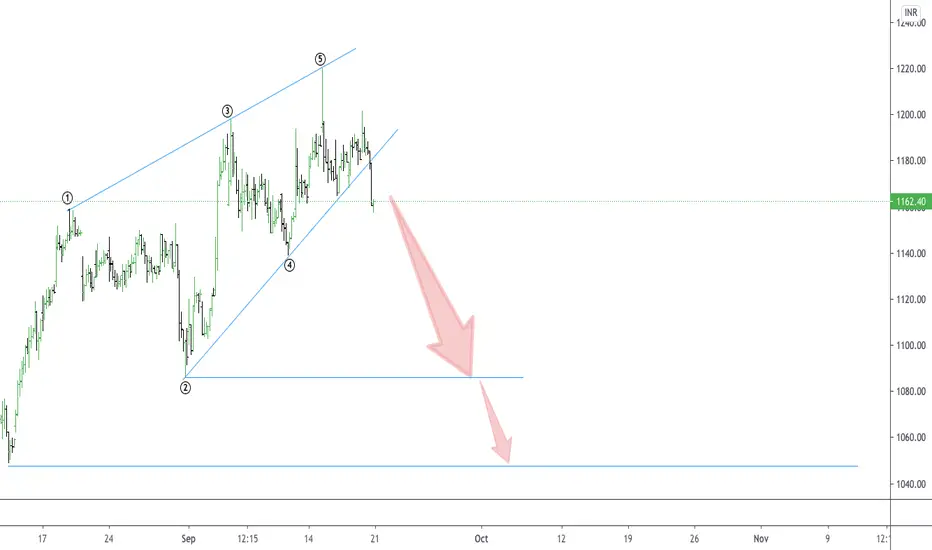
Indigo- Important Resistance-1355If Resistance 1355 holds as the top then we expect 1180 ( 1st Target) & falling below 1180 more on the downside
Last Price- 1322 / 13:03 Hrs / 5th Oct 2020
Strict Stops Above - 1355
1st Target Downside - 1180

Gold- Triangle Scenario Evolving As Ending Diagonal- Wave YNot a trading call
Disclaimer
-----------------------------
All investments involve risk, and the past performance of a security, industry, sector, market, financial product, trading strategy, or individual’s trading does not guarantee future results or returns. Investors are fully responsible for any investment decisions they make. Such decisions should be based solely on an evaluation of their financial circumstances, investment objectives, risk tolerance, and liquidity needs.
------------------------------------------------------------------------------------------------------------------------------
Note - For Educational purpose only
------------------------------------------------------------------------------------------------------------------------------
Market Commentary
Last Idea - Suggested It could be a triangle unfolding - Gold did best holding 50500 levels (approx) with +/- 250 points & attempting 52000 levels. "if gold holded 50500 levels then triangle scenario was still open but breaking below 50500 level- triangle scenario was negated"
Later breaking 50500 levels after making high @ 52182 - now it can possibly unfold as an ending diagonal which again suggest that making a new low below 49250 - it can attempt all-time new high or similar high @ 56191
Short Term - Downside Trend - one more fall expected below 49250 holding below 50350
Long Term - Upside Bias & One more high cannot be negated. Once New low is achieved as per short term trend- close to 49000- we can expect new all times or similar high @ 56191

SBI CARD Wave 1 Complete. Time for Wave 2 Decline!Chart Data as of 25th Sept, 2020
A Classic Ending Diagonal/ Rising Wedge structure has marked the Completion of a 5 Wave Impulse
Elliot Wave suggests we are now in a Wave 2 Decline that can retrace this Wave 1 advance that just got completed
I have a Minimum Target of ~ 725 for this Decline.
Key Levels to Note:
T1= 725
700 psychological level
T2= 685
T3= 640
Where this Wave 2 Decline will Stop, I do not know but there is a High Probability that we will at Least meet Target 1 for this Downfall.
My Bearish View Negates if we make a New High above 868
Studies apart from EW such as:
Price Volume Action
RSI
MACD
ADX
......Are ALSO Confirming my Bearish Thesis, SO if you do not want Short at least I Will not be a Buyer till SBI CARD makes a new High.
Provide me Feedback and Support if you liked this Bearish Setup
Happy Trading :)

TITAN : CASE OF ENDING DIAGONALThis is the most common diagonal that can be found out at the ending of a main trend or main correction. It consists of all the waves 1-2-3-4-5 in a single or multiple zigzags. They can be found placed at 5th wave of an impulse wave or can been seen as a wave ‘C’ of a corrective waves zigzags or flat. After the termination of the ending diagonal, a swift & a sharp reversal takes place which bring the prices back to the level from where the diagonal began.
Here in the stock of TITAN, this ending diagonal is placed as a wave-C of a corrective move.
As you can see in the chart, this pattern looks like an ending diagonal having wave-1 wave-2 wave-3 wave-4 & wave-5 . Each of these five waves are having an internal structure of three waves. So as per the wave analysis we can say the stock price of TITAN are going to fall . It has been seen that the target level of ending diagonal wave is the origin of the diagonal or the wave 2. So one should see a selling opportunity in this stock & look for the target zone as mentioned in the chart.
Bajaj Finance Wave 5 Ending Diagonal Final leg of UpmoveDISCLAIMER:There is no guarantee of profits or no exceptions from losses.
Technical analysis provided on the chart is solely the personal views of my research.
You are advised to rely on your own judgments while investing/Trading decisions.
Past performance is not an indicator of future returns. Investment is subject to market risks.
Seek help of your financial advisors before investing/trading.
--------------------------(((((LIKE)))))-------------------------------
Bajaj Finance gave breakout from Ending diagonal in Wave C and since then moved up now in final 5th wave formed Ending Diagonal in Wave five (5).
Confirmation: We see (iv) right now completed since 3 up side candles and started wave (v). It also moved nearly 0.5 fib level 3570.
Next possible Wave 5 target 3670 which is 0.786 fib level.
If wave (v) not truncated then possible to touch 3770,3820,3870 levels.
Once wave (v) ENDs downside will start.

MGL: case of ending diagonalAs per the current structure it seems the prior correction is going to be completed in 1 0r 2 days. There is a formation of ending diagonal. One should buy the stock in the range of 860-65 keeping the stop loss at 845 for the target of 950 & if it hold then 995.

USDCAD- case of Ending diagonalVery soon there will be a trend reversal in the pair USDCAD. The current price structure is forming an ending diagonal which is going to complete the long term corrective wave A-B-C started in the month of march. The another reason for expecting a trend reversal is the bottom formation of dollar index, which clearly suggests that major reversal going to take place. Important levels are 1.30800 as the last & Above: 1.32400 reversal confirmation.

Tata Motors Ending Diagonal (THE END OF CORRECTION)DISCLAIMER:There is no guarantee of profits or no exceptions from losses. The investment advice provided is solely the personal views of my research. You are advised to rely on your judgment while investing/Trading decisions. Past performance is not an indicator of future returns. Investment is subject to market risks. Seek help of your financial advisors before investing/trading.
--------------------------(((((LIKE)))))-------------------------------
Chart Scale Monthly and we see Ending Diagonal appeared in Wave five V.
We are in Wave (4) right now probably going towards major resistance 165-67.
Wave V or (5) should end at least 50% of wave (4) which is 112 Next big support 105.
The calculation of Wave 5 End depends on wave 4 end and also whether it will correct 50% fib levels or more/less will be another mystery.
But we can definitely say Ending Diagonal Brings THE END.
See you soon XD.


Nifty is trading in ending diagonal Expecting fall Nifty is trading in ending diagonal pattern if nifty fall below the level of D of ending diagonal then we can expect a large down fall
We can put stop loss above the level of E of ending diagonal
