CRUDE OIL By KRS ChartsDate: 2nd July 2025 / 19:35
Why Crude Oil ?
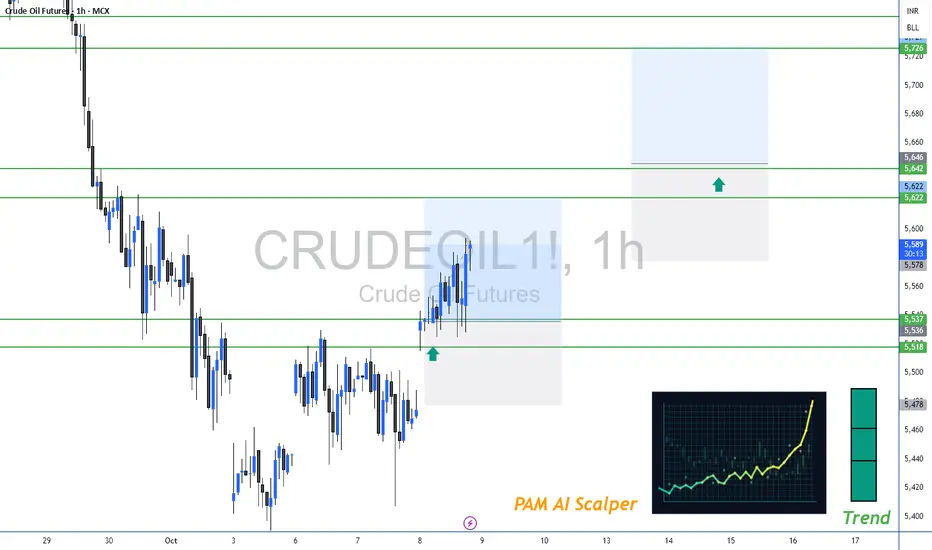
1. Starting with 1H Tf. Accumulation is visible with LLs to Sideways and now HHs & HLs
2. Crude oil Price is currently in Buy Zone with strong support.
3. Recent Gap Dow is likely to be Shakeout for Buyers.
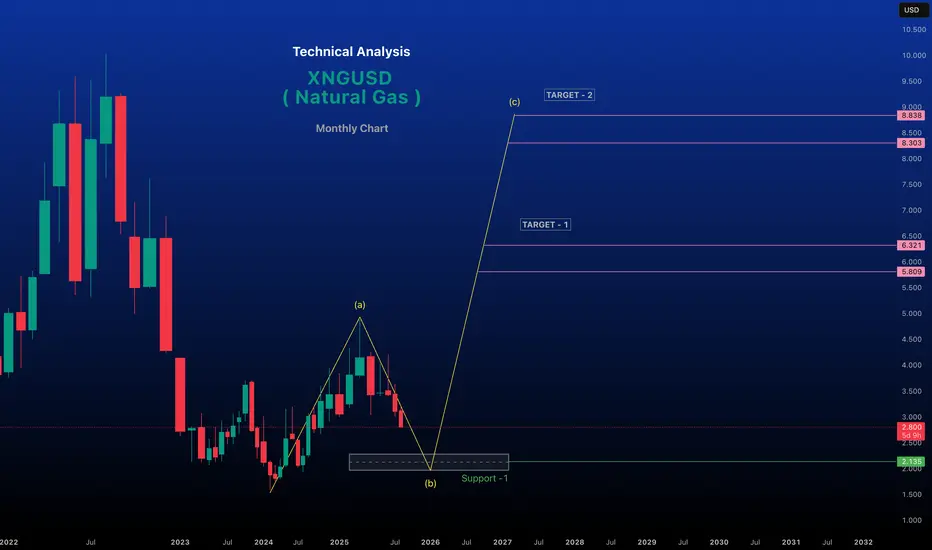
4. In Bigger Timeframe price has made Low in March is likely to be the bottom as per Wave thoery.
5. After that bottom price on Higher low side price accumulating.
6. From Here it seems like bullish side trades will be better option for Crude Oil for Targets which are mentioned in Chart. (Medium Term View).
Energy Commodities

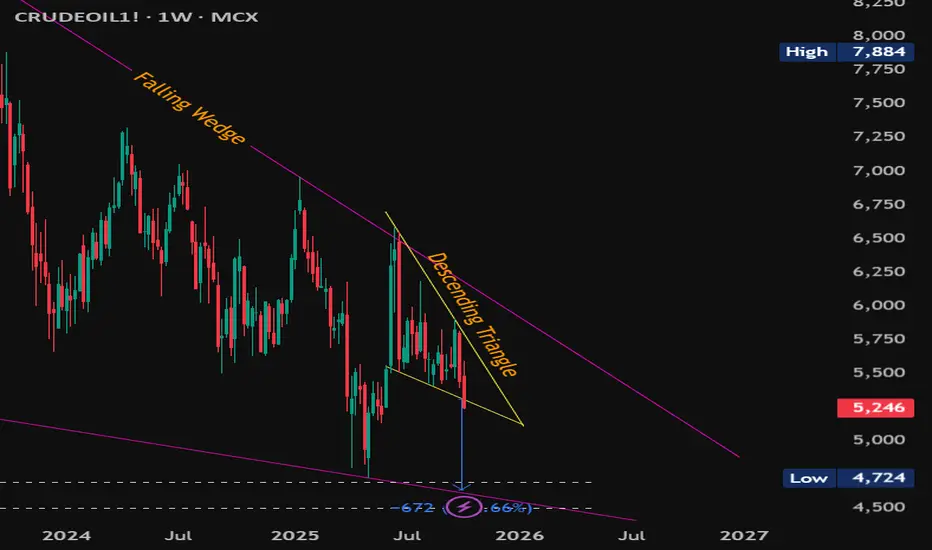
#MCXCrudeOil Weekly – Breakdown into Major Support Zone#MCXCrudeOil Weekly – Breakdown into Major Support Zone
CMP: 5,246
Crude Oil has broken down from a descending triangle with a confirmed weekly close below 5,308 , triggering target of 4,636 . This move unfolds within a larger falling wedge pattern , adding confluence and signaling potential volatility ahead.
This breakdown aligns with two key confluences :
📉 The falling wedge lower trendline.
🟠 A major historical demand zone at 4,692 – 4,499 , which was previous resistance turned strong support on multiple occasions.
This make-or-break support zone could act as:
🔄 A reversal zone , potentially triggering a bullish breakout from the wedge.
📉 Or, if breached, it may invalidate the wedge and lead to extended downside.
Key Levels:
Resistance: 5,903 & 6,184 (price action + wedge top)
Support: 4,692 – 4,499 (confluence zone)
Breakdown Target: 4,636 (descending triangle pattern)
Watch weekly candle behavior near this zone closely for signs of either rejection or continuation .
#CrudeOil #MCXCrude #ChartPatterns #FallingWedge #DescendingTriangle #PriceAction #BreakdownAlert #SwingTrading #CommodityTrading
📌 Disclaimer: This analysis is shared for educational purposes only. It is not a buy/sell recommendation. Please do your own research before making any trading decisions.
Crude Oil Levels For October 2025Important support and Resistance Levels For Crude Oil.
When Market touches the level, the price action plays important roles.
For More Learning Reach out to us.
Natural Gas Levels For October 2025Important support and Resistance Levels For Natural Gas.
When Market touches the level, the price action plays important roles.
For More Learning Reach out to us.
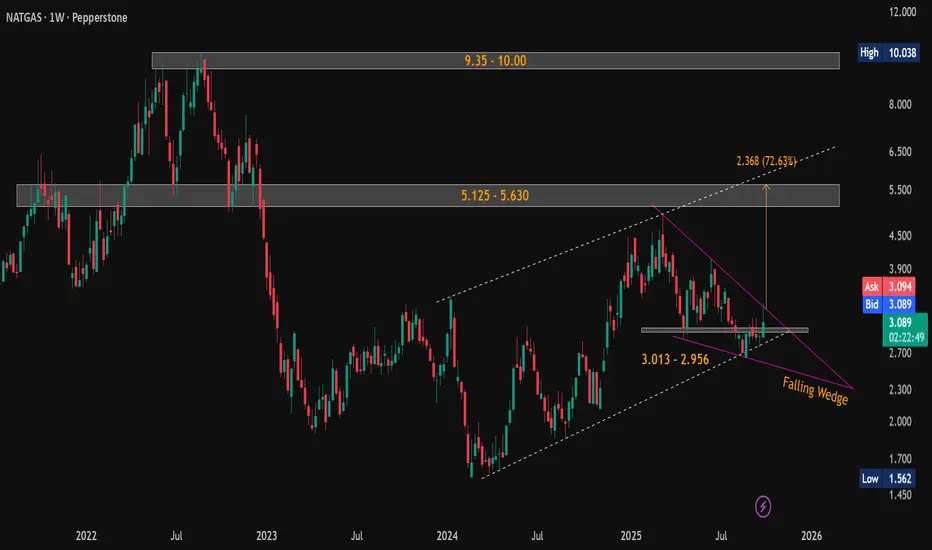
Natural Gas (NG) Weekly Breakout Brewing — 80% Upside Potential!Current Price: $3.090
Technical View (Weekly Timeframe):
Natural Gas has formed a classic falling wedge pattern on the weekly chart - a strong bullish reversal setup. Price action is currently on the verge of breakout , with increasing volume and narrowing range suggesting imminent movement.
🟢 Strong Support Zones:
$3.013 – $2.956
$2.692 – $2.643
🔺 Key Resistance / Upside Targets:
Short-term: $5.125 – $5.630 (Pattern target: $5.625 )
Long-term: $9.35 – $10.00
📈 The pattern breakout target of $5.625 aligns closely with the major resistance zone of $5.125 – $5.630, representing a potential ~80% upside from current levels.
Look for confirmed breakout above the wedge resistance with strong volume for trend continuation.
#NaturalGas | #NG | #FallingWedge | #ChartPatterns | #TechnicalAnalysis | #PriceAction
📌 Disclaimer: This analysis is shared for educational purposes only. It is not a buy/sell recommendation. Please do your own research before making any trading decisions.
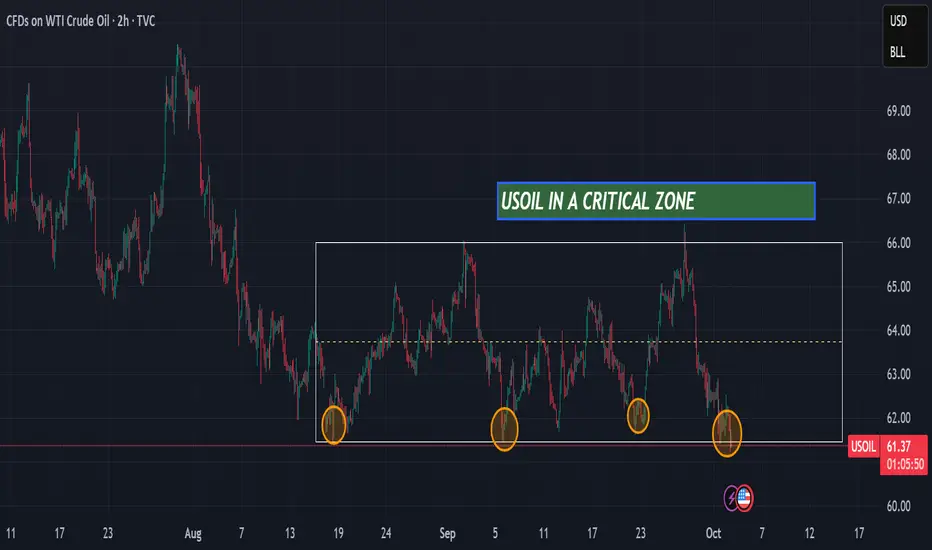
USOIL is in a critical zoneHello,
USOIL is currently at a major support level that has held for the past 2 months. There are two possible scenarios: either the support holds and USOIL bounces back toward the resistance at $66, or the support breaks and the price moves down to the next level at $60,
Ibrouri Abdessamad
Will crude drop to $61.70?hello,
according to my analysis on 2h time frame there is high probability that crude oil futures could drop to 61.7 IN FEW HOURS,

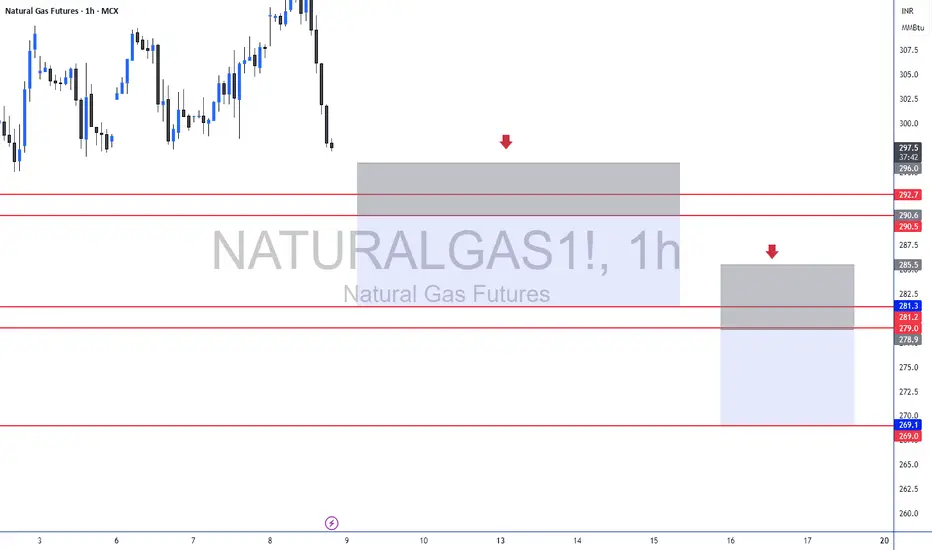
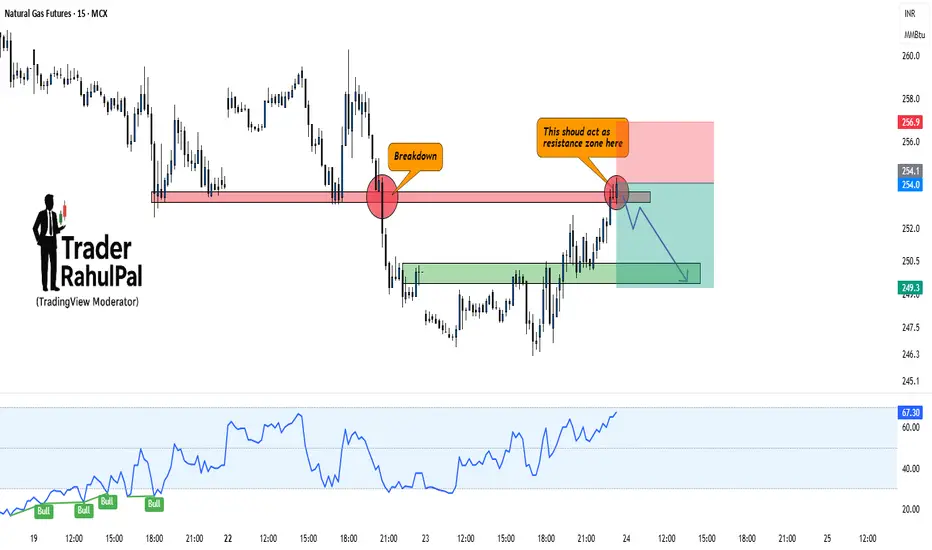
Natural Gas – Breakdown Retest Could Trigger Fresh FallHello everyone, Let's analyse Natural Gas and it has recently broken down from a key support level, turning it into resistance. The price is now retesting that zone, and unless bulls manage to reclaim it strongly, the downside remains the higher probability.
Current Setup:
Previous support around 254–256 has turned into a resistance zone.
Breakdown already confirmed with strong bearish candles.
RSI is still holding higher, but momentum may fade if resistance rejects.
Fresh downside targets can open toward 249–247 zone if rejection plays out.
Only a strong close above 257 will negate this bearish view.
Disclaimer: This analysis is for educational purposes only and should not be taken as financial advice. Please do your own research or consult your financial advisor before investing.
Analysis By @TraderRahulPal (TradingView Moderator) | More analysis & educational content on my profile
👉 If you found this helpful, don’t forget to like and follow for regular updates.
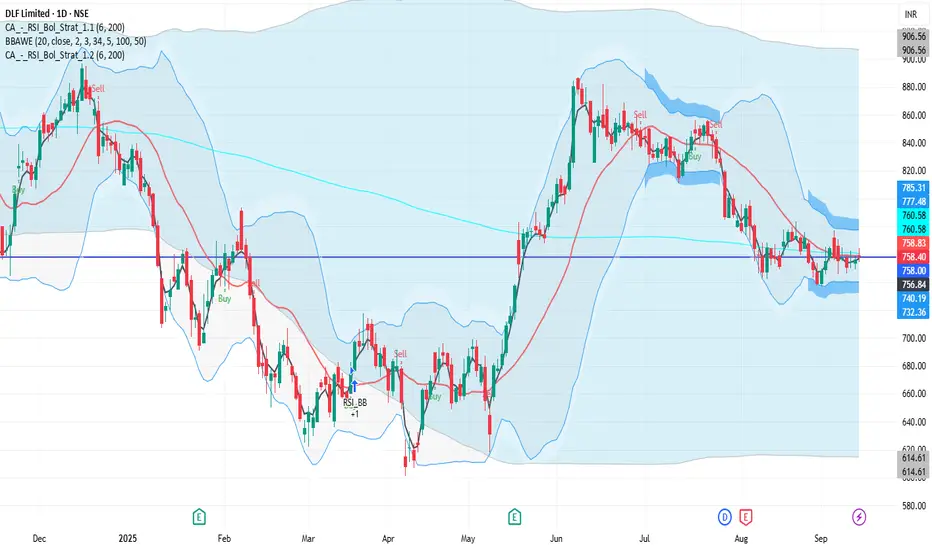
DLF 1D Time frame📉 Current Market Snapshot
Current Price: ₹758.40
Previous Close: ₹756.35
Day's Range: ₹754.20 – ₹764.40
52-Week High: ₹929.00
52-Week Low: ₹601.20
Market Cap: ₹1.87 lakh crore
P/E Ratio: 41.85
Dividend Yield: 0.79%
ROE: 10.76%
Debt-to-Equity Ratio: 0.10
Beta: 1.78
EPS (TTM): ₹18.12
Book Value: ₹172.51
Face Value: ₹2.00
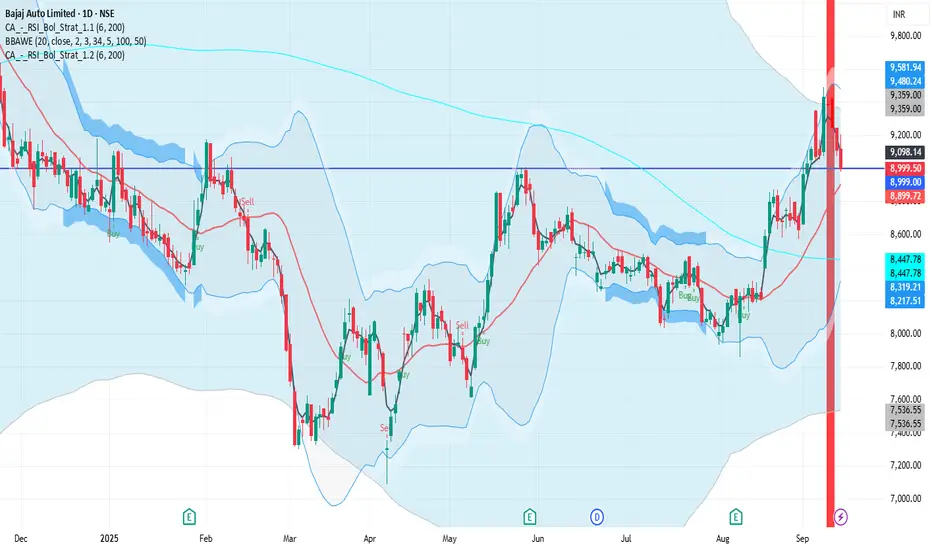
BAJAJ_AUTO 1D Time frame📉 Current Market Snapshot
Previous Close: ₹9,113.50
Today's Range: ₹8,979.50 – ₹9,205.00
Current Price: ₹8,999.50
Market Cap: ₹2,51,318 crore
P/E Ratio: 33.1
Dividend Yield: 2.33%
52-Week High: ₹12,774
52-Week Low: ₹7,089.35
SBIN 1D Time frame📍 Current Price
₹823.30 (down 0.06% from previous close)
Short-Term Outlook
Bullish Scenario: A sustained move above ₹836 could lead to a test of the 52-week high around ₹875.50.
Bearish Scenario: A drop below ₹785.10 may signal a potential pullback toward ₹794.00.

Crude oil - Sell around 65.00, target 62.00-60.00Crude Oil Market Analysis:
Crude oil closed with a small positive candlestick yesterday, rebounding for three consecutive trading days. It appears that the 60.00 support level remains very strong and difficult to break in the short term. If it rebounds near 65.00, continue selling. Crude oil remains bearish. Today's strategy remains unchanged. Yesterday's positive close is somewhat related to the EIA crude oil inventory data.
Fundamental Analysis:
The most important data this week, the CPI, will be released today. The recent surge in gold prices is due to increased market expectations of a September rate cut by the Federal Reserve. This CPI may be the last data the Fed will use as a reference.
Trading Recommendation:
Crude oil - Sell around 65.00, target 62.00-60.00.

Crude oil - Sell around 63.30, target 62.00-60.00Crude Oil Market Analysis:
The strategy for crude oil is simple: a rebound is a selling opportunity. Don't dwell on the details. Crude oil has been fluctuating for a long time. If it breaks through, we will adjust our strategy. Today, sell crude oil around 64.30. The key resistance level for crude oil is around 65.60. A break of this level will trigger a strong trend. Sell crude oil in the short term during short-term fluctuations. A break of 60.00 will open up new room for significant declines.
Fundamental Analysis:
Today, focus on the EIA crude oil inventory data. The CPI will be released tomorrow, and this week's major action will also be tomorrow.
Trading Recommendations:
Crude oil - Sell around 63.30, target 62.00-60.00

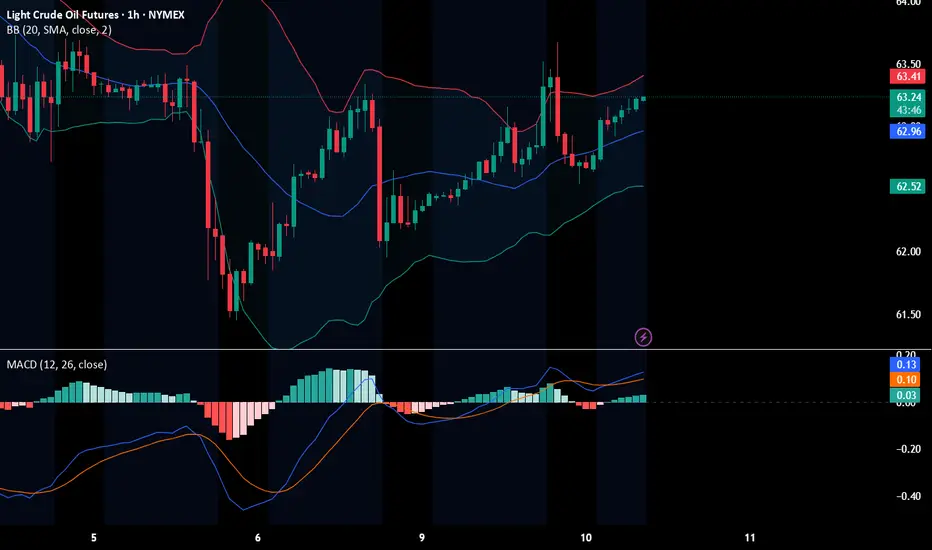
WTI(20250910)Today's AnalysisMarket News:
U.S. employment data was significantly revised downward, with jobs for the 12 months ending in March revised down by 911,000.
Technical Analysis:
Today's buy/sell levels:
62.62
Support and resistance levels:
63.88
63.41
63.10
62.14
61.83
61.36
Trading Strategy:
On a breakout above 63.10, consider a buy entry, with the first target at 63.41.
On a breakout below 62.62, consider a sell entry, with the first target at 62.14
Crude oil - Sell near 63.50, target 62.00-60.00Crude Oil Market Analysis:
Crude oil has recently been recovering on the daily chart, with the focus of the recovery shifting downward. Weak inventory data is also the primary reason for the continued decline in crude oil prices. Today, we maintain a bearish outlook and focus on sell orders near 63.50. Don't chase crude oil today; wait for a small rebound before selling. It's been volatile, and the buying and selling game has been going on for a long time.
Fundamental Analysis:
The previous sharp drop in non-farm payroll data led to a surge in gold prices. This week, we will monitor CPI data.
Trading Recommendations:
Crude oil - Sell near 63.50, target 62.00-60.00

Crude oil - Sell around 64.00, with a target range of 62.00-60.0Crude Oil Market Analysis:
Crude oil has recently begun to move slowly, with the daily chart beginning to decline. This week, we will focus on gains and losses around 60.00. If this level is broken, further downside is possible. We remain bearish on crude oil and continue to sell on rebounds. Every rebound presents an opportunity to sell again. Today, we are focusing on sell opportunities near 64.00. The recently released crude oil inventories are essentially flat, with no significant gap to support buying.
Fundamental Analysis:
Last week's non-farm payroll data showed a figure of 22,000, compared to expectations of 75,000 and a previous estimate of 79,000. This result is quite disappointing. In short, fewer US jobs, a weaker economy, and therefore a stronger gold price. This week, we will monitor the CPI.
Trading Recommendations:
Crude oil - Sell around 64.00, with a target range of 62.00-60.00.

Crude oil - Sell around 64.00, target 62.00-60.00Crude Oil Market Analysis:
Crude oil is still experiencing a recent correction in daily price action. We should consider continuing to sell on any rebounds. Previous crude oil contracts and inventories haven't changed the trend, and recent data doesn't support it. I predict it will be difficult to reverse the weak selling trend in the short term. Today, we're considering selling around 64.00.
Fundamental Analysis:
Recent fundamentals haven't significantly stimulated the market. Today, we'll focus on the US non-farm payroll data.
Trading Recommendations:
Crude oil - Sell around 64.00, target 62.00-60.00

Crude oil - Sell around 64.50, target 63.00-60.00Crude Oil Market Analysis:
The recent daily chart of crude oil has been a fluctuating pattern of rising and falling prices, making us question our own future. Today, we maintain a bearish outlook. Every rebound presents a selling opportunity. We've been selling crude oil for months, and it's been fluctuating for months now, with no signs of a rebound or upward movement. Unless the weekly hurdle of 75 is broken, a significant rally is unlikely. Consider selling if it rebounds to 64.50 today.
Fundamental Analysis:
Today we will have ADP employment and unemployment benefits data.
Trading Recommendation:
Crude oil - Sell around 64.50, target 63.00-60.00

Natural gas - Matches the exact moves, posted on 24th AugNatural gas - Matches the exact moves, posted on 24th. August
Points gained- 229.5 to 264.8 = 35.3 points
1 Point = ₹1000 (35.3*1000= ₹35300.0)
Holding it, next is 300 & 320 target🎯
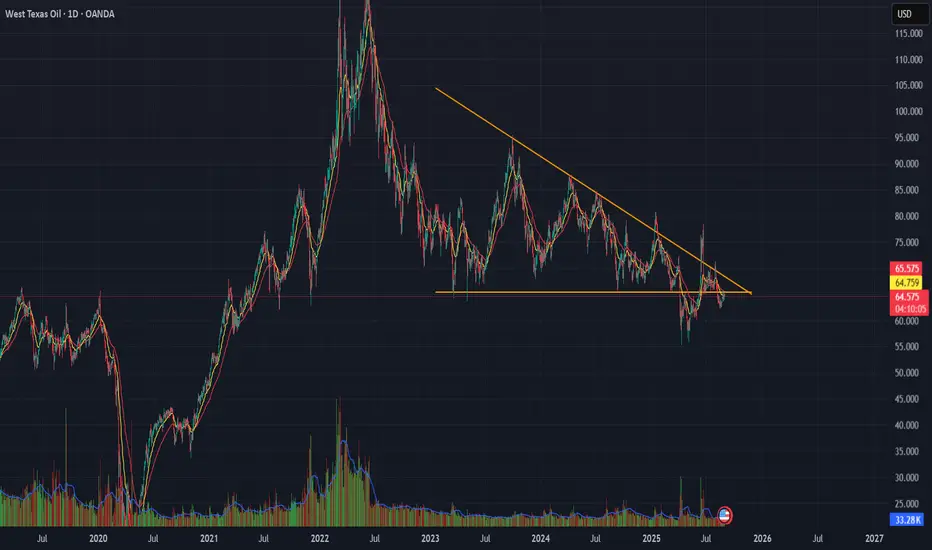
WTI Crude Oil Descending Triangle Pattern
WTI is forming a Descending Triangle pattern near recent support.
📊 Technicals : Flat base with lower highs compressing price action.
🔎 Key Levels: Breakdown below support 65 Leads To bearish continuation;
bounce above resistance 71 Leads To reversal setup.
⚠ Risk View: Energy fundamentals remain mixed — confirmation with volume is essential.
👉 Tactical takeaway: Wait for a breakout from the triangle before committing directionally.
USOIL Bearish Reversal & Selling OpportunityUSOIL (WTI Crude Oil) – Bearish Setup Analysis
The chart shows a clear bearish structure with multiple confirmations:
Trendline Rejection & Break: Price rejected from the upper rejection line and later broke the rising trendline, confirming bearish momentum.
FVG (Fair Value Gap) Selling Zone: Price retested the imbalance zone (63.53–63.94), creating a strong selling opportunity.
EMA Confluence: Both the 70 EMA and 200 EMA are above the price, acting as dynamic resistance, supporting bearish bias.
Market Structure Shift (MSS): Breakdown of higher lows signals shift to bearish structure.
Target: Downside continuation expected towards 61.65, the next liquidity and support zone.
Stop Loss: Above 63.94 (selling zone invalidation).
📉 Strategy: Look for sell entries around 63.53–63.94 zone, with target at 61.65 and stop loss above 63.94.

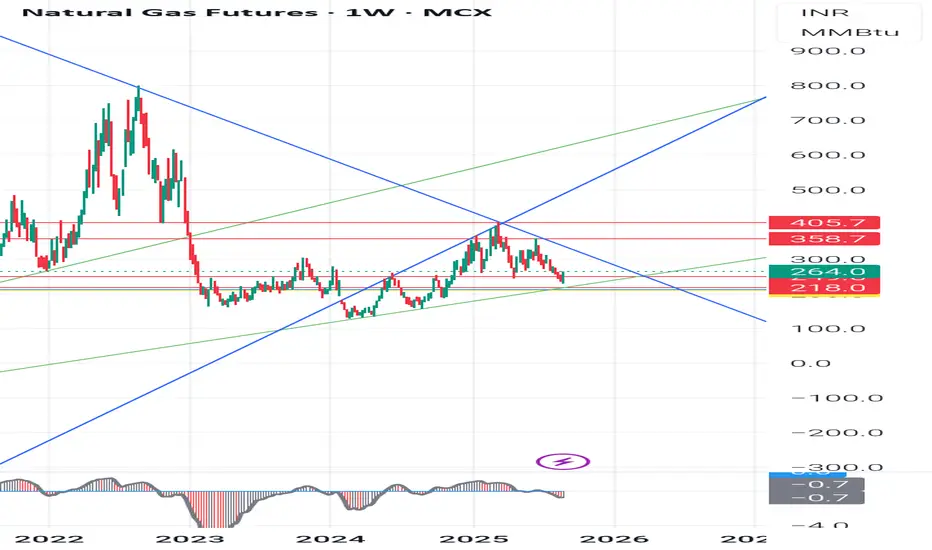
Natural gas analysis Monthly Time frameNatural gas markets are influenced by a complex interplay of supply, demand, weather, geopolitical events, and technical factors. Below is a concise analysis based on recent trends and data as of August 24, 2025, covering key aspects of the natural gas market
Price Trends and Market Dynamics
Spot and Futures Prices: The Henry Hub spot price recently fell from $2.92/MMBtu to $2.81/MMBtu, and the September 2025 NYMEX futures contract dropped from $2.828/MMBtu to $2.752/MMBtu. The 12-month futures strip (September 2025–August 2026) averaged $3.501/MMBtu, reflecting a bearish near-term outlook but expectations of tighter balances later.
Supply and DemandSupply: U.S. natural gas production has risen, with a 3% increase in marketed production in 2025, particularly from the Permian (2 Bcf/d), Haynesville, and Appalachia (0.9 Bcf/d each). However, production is expected to stabilize in 2026 as associated gas from oil declines.
Storage: U.S. storage inventories are projected to reach 3,927 Bcf by October 31, 2025, 174 Bcf above the five-year average, due to higher-than-average injections (20% above the five-year average). This surplus is pressuring prices downward.
Demand: Cool weather forecasts for August 2025, potentially the coolest in 50 years, have reduced demand, contributing to bearish price sentiment. However, LNG exports are rebounding, with Freeport LNG operations resuming, providing some support.
LNG Exports: Maintenance at U.S. LNG terminals earlier in 2025 reduced exports, but recovery and new contracts (e.g., ConocoPhillips’ 4 Mt/y from Port Arthur LNG Phase 2) signal growing export potential.
Technical AnalysisBearish Signals: Technical indicators suggest a "strong sell" for Natural Gas Futures across multiple timeframes (daily, weekly, monthly), driven by a head-and-shoulders pattern with prices breaking below the $3.050 neckline, targeting $2.220–$2.000.
Indicators: RSI, MACD, and stochastic oscillators indicate oversold conditions, but negative momentum persists below key resistance levels like $3.100–$3.320. Pivot points and moving averages reinforce bearish trends, with potential support at $2.200.
Geopolitical and Structural FactorsEurope: The 2022–2023 Russian supply shock shifted Europe to rely on LNG, increasing price volatility. Market reforms have boosted trading volumes (7,300 bcm in 2024, 15x demand), but derivatives trading by physical players dominates, limiting speculative impacts.
Weather Impact: Cooling in the Midwest and Northeast (highs of 60s–80s°F) contrasts with hotter conditions elsewhere (80s–100s°F), driving regional demand differences. Weather models (ECMWF, GFS) forecast continued impacts on heating and cooling degree days, affecting prices.
Energy Transition: Natural gas is increasingly vital for electricity generation as coal phases out, linking gas and power markets and amplifying price sensitivity to weather and demand.
Forecast and OutlookShort-Term (1–6 Weeks): Bearish due to high storage, weak demand from cool weather, and technical indicators. Prices may test support at $2.220–$2.080,
Long-Term: Growing U.S. electricity demand (31% over 15 years) and constrained global supply (e.g., limited OPEC spare capacity) suggest bullish prospects for natural gas as a reliable fuel.
Trading ConsiderationsRisks: High volatility, weather-driven demand shifts, and geopolitical uncertainties (e.g., Russia-Ukraine tensions) pose risks.
Strategies: Traders may consider short positions targeting $2.80, but oversold conditions suggest caution for potential reversals. Long-term investors might accumulate near support zones ($2.220–$2.080) for 2026 upside.
Data Tools: Monitor EIA storage reports, weather forecasts (NatGasWeather.com), and technical indicators (RSI, MACD) for real-time insights.
Note: Trading involves high risks, and past performance does not guarantee future results. Always conduct your own research.
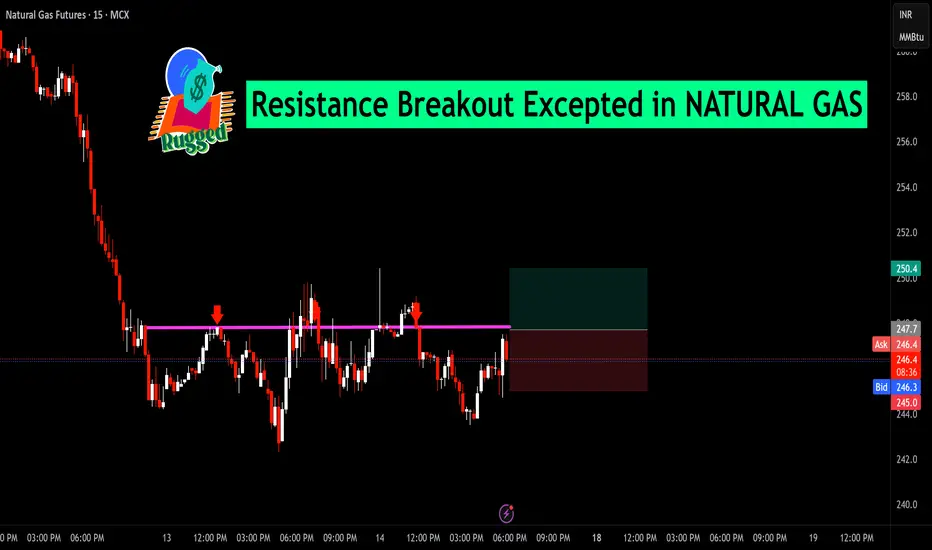
Resistance Breakout Excepted in NATURAL GASNatural Gas has been consolidating just below a key resistance level around ₹247–₹248, with multiple rejection points in recent sessions (marked by red arrows). The current price action shows renewed buying pressure, with candles testing the resistance zone once again.
Technical View:
The horizontal resistance has acted as a strong supply zone multiple times.
A decisive breakout and close above ₹248 could open the path for further upside momentum.
Immediate support is placed near ₹244.20, which serves as a stop-loss reference for breakout traders.
Trading Perspective:
If price sustains above the resistance level with volume confirmation, the breakout could trigger a short-term bullish move toward higher targets. However, failure to hold above this zone may lead to another pullback within the range.