Shriram Finance Ltd- Swing1. Trend analysis
- the stock was in a downtrend from October to late January, forming lower highs and lower lows.
- however, in February, the stock started recovering and has now moved above the 200-day moving average (blue line), which is a bullish sign.
2. Moving averages
- The chart shows two short-term moving averages (red and green lines), which could be the 9-day and 21-day ema.
- The stock is currently trading above these moving averages, suggesting short-term momentum is in favor of buyers.
3. Volume analysis
- There is a significant increase in volume on the latest green candle, indicating strong buying interest.
- Higher volume during an upward move confirms that the breakout could be sustainable.
4. Support and Resistance levels
- Support: the 580-590 zone is an important support level as the price has broken out from this area.
- Resistance: the next potential resistance is around 630-650, where selling pressure might come in.
5. Swing trade plan
- Entry: if the stock holds above 580-590, consider entering.
- Stop loss: place a stop-loss below 565, as a break below this level could signal weakness.
- Target: the first target can be 630, and if momentum continues, it can move towards 650.
This setup looks good for a bullish swing trade, as the stock has broken key resistance with strong volume. however, it is always wise to watch the overall market conditions before entering the trade.
Fallingwedgepattern

WTI Crude Oil – Dual Falling Wedges in Play!🛢️ #WTICrudeOil
CMP: $58.25
🟡 S maller Falling Wedge (Yellow)
• Breakdown candle formed
• Breakdown confirmation on weekly close below $58.22 (low of breakdown candle)
• Target: $52.71
• Converges with key price action support zone at $52.48–50.55
• Also aligns with long-term wedge trendline support
🟣 Larger Falling Wedge (Purple)
• Still intact
• Bullish Breakout confirmation: Weekly close above $77.57
🔽 Support Levels
• Immediate: $55.15
• Zones: $52.48–50.55, $45.04–42.93
🔼 Resistance Levels
• Immediate: $58.35
• Zones: $60.68, $61.45–61.96, $63.98–66.42
⚠️ Outlook
Short-term bias remains bearish , watching for a weekly close below $58.22 to confirm breakdown.
Long-term bullish reversal possible only above $77.57 (WCB) .
#CrudeOil | #WTI | #OilChart | #ChartPatterns | #FallingWedge | #PriceAction | #Commodities
📌 Disclaimer: This analysis is shared for educational purposes only. It is not a buy/sell recommendation. Please do your own research before making any trading decisions.

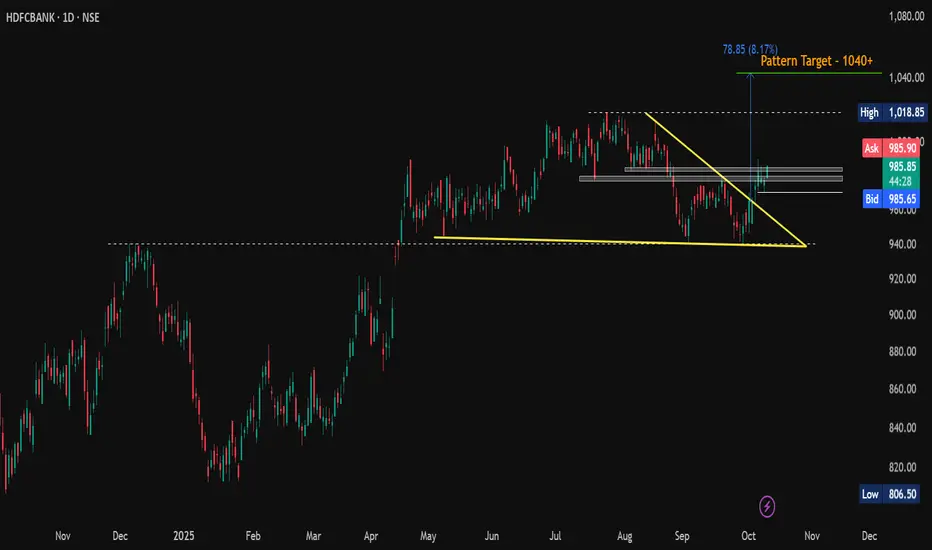
HDFCBANK | Falling Wedge BreakoutCMP: 985
HDFCBANK has broken out of a falling wedge on the daily chart - a classic bullish reversal setup!
🔹 Chart Pattern: Falling Wedge Breakout
🔹 Breakout Confirmation: Price has decisively broken above the upper trendline
🔹 Retest Zone: Price is consolidating near the breakout zone (977 – 980), showing strength
🔹 Pattern Target: 1040+
🔹 Immediate Resistance: 985
🔹 Support Zones: 977 & 970
📈 A Daily Close Above 985 (DCB) can fuel momentum towards the wedge breakout target of 1040+ .
#HDFCBANK | #BreakoutStocks | #FallingWedge | #ChartPatterns | #TechnicalAnalysis | #SwingTrading | #BullishBreakout
📌 Disclaimer: This analysis is shared for educational purposes only. It is not a buy/sell recommendation. Please do your own research before making any trading decisions.
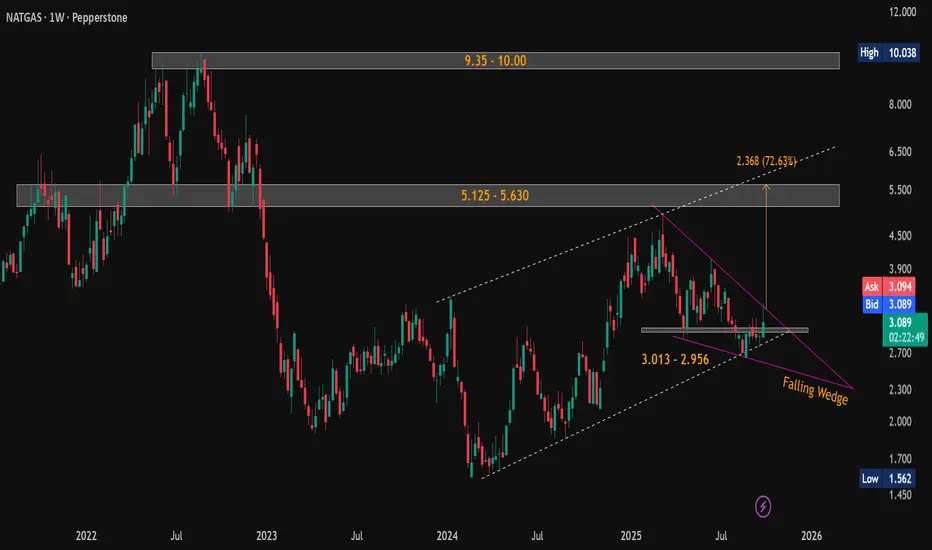
Natural Gas (NG) Weekly Breakout Brewing — 80% Upside Potential!Current Price: $3.090
Technical View (Weekly Timeframe):
Natural Gas has formed a classic falling wedge pattern on the weekly chart - a strong bullish reversal setup. Price action is currently on the verge of breakout , with increasing volume and narrowing range suggesting imminent movement.
🟢 Strong Support Zones:
$3.013 – $2.956
$2.692 – $2.643
🔺 Key Resistance / Upside Targets:
Short-term: $5.125 – $5.630 (Pattern target: $5.625 )
Long-term: $9.35 – $10.00
📈 The pattern breakout target of $5.625 aligns closely with the major resistance zone of $5.125 – $5.630, representing a potential ~80% upside from current levels.
Look for confirmed breakout above the wedge resistance with strong volume for trend continuation.
#NaturalGas | #NG | #FallingWedge | #ChartPatterns | #TechnicalAnalysis | #PriceAction
📌 Disclaimer: This analysis is shared for educational purposes only. It is not a buy/sell recommendation. Please do your own research before making any trading decisions.
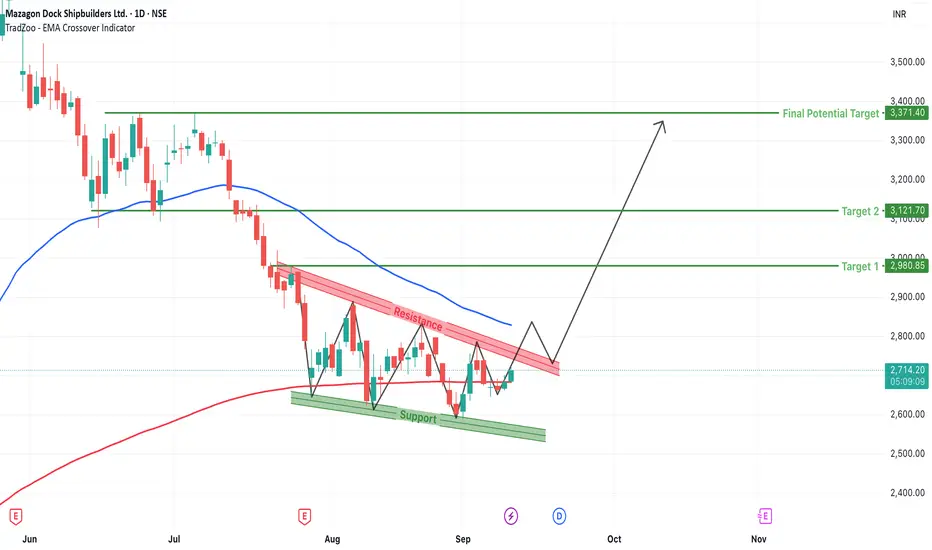
Mazagon Dock (MAZDOCK) Breakout Watch: Falling Wedge FormationMazagon Dock Shipbuilders Ltd., one of India’s premier shipbuilding companies, has recently shown signs of a technical breakout after months of downtrend. The stock had been consolidating within a falling wedge structure—a well-known bullish reversal pattern—and is now approaching a critical breakout zone that traders should closely watch.
Let’s analyze the technical setup in detail.
1. Formation of the Falling Wedge Pattern
The chart clearly highlights a falling wedge, which is formed by drawing two converging trendlines: one descending across the highs (resistance) and the other descending across the lows (support). The falling wedge is typically a bullish reversal pattern, especially when it forms after a prolonged downtrend—as is the case here.
From mid-June to early September, MAZDOCK trended lower, respecting the wedge boundaries. However, instead of a complete breakdown, price started finding support near the ₹2,500–2,600 zone, forming higher lows within the wedge—a subtle early sign of a reversal brewing beneath the surface.
2. Key Resistance and EMA Confluence
The immediate overhead resistance is defined by the upper boundary of the wedge, which is also in confluence with the 200-period EMA, currently placed around ₹2,830. This makes the ₹2,820–₹2,840 zone a crucial breakout level.
Once price convincingly breaks and closes above this level with volume confirmation, it could trigger a fresh upside rally. The current price action around ₹2,720 (+1.34%) on the breakout candle indicates building momentum.
3. Projected Targets After Breakout
Upon successful breakout, the measured move (based on wedge height) gives us three major targets:
Target 1: ₹2,980
This level is close to the psychological ₹3,000 mark and would be the first hurdle where partial profit booking may be considered.
Target 2: ₹3,121
A further extension of the breakout move. This level marks previous minor resistance and could act as a midpoint of the rally.
Final Potential Target: ₹3,371
This target is based on the maximum height of the wedge added to the breakout zone and also aligns with a historical resistance zone. A rally to this level would indicate complete bullish validation of the pattern.
4. Trade Setup for Traders
This breakout provides a favorable risk-reward opportunity for swing and positional traders. Here's a sample trade plan:
- Entry: On breakout and close above ₹2,830 (above wedge and EMA)
- Retest Entry: On pullback to ₹2,790–₹2,810 with confirmation candle
- Stop-Loss: Below ₹2,650 (invalidates the breakout structure)
- Targets: ₹2,980 / ₹3,121 / ₹3,371
- Risk-to-Reward Ratio: Approximately 1:2.5 to 1:3.5
5. Risk Management and Trader Tips
While this setup looks promising, wait for confirmation before jumping into the trade. Many false breakouts can occur, especially around key EMAs. Also, keep an eye on volume: a genuine breakout should be accompanied by higher-than-average volume.
Other tips:
Scale-in your position rather than going full size at entry.
Keep trailing your stop-loss as the price moves in your favor.
Monitor broader market indices for sentiment cues (Nifty, Bank Nifty).
6. Conclusion: A Reversal Candidate Worth Watching
Mazagon Dock has not only respected technical levels within the wedge but is also showing strength around a key resistance–EMA confluence zone. This kind of setup, supported by a classic pattern like the falling wedge, adds more credibility to the potential move.
With clear targets and a defined stop-loss zone, the current price structure offers a high-probability reversal setup. Patience is key—let the breakout confirm itself.
Breaking Out of Falling Wedge and Symmetrical TriangleNSE:SYRMA is breaking out of Falling Wedge and Symmetrical Triangle Breakout on Weekly TF. With 2nd Best Weekly Volumes.
NSE:SYRMA is a Chennai-based engineering and design company engaged in electronics manufacturing services (EMS). The company provides integrated services and solutions to original equipment manufacturers (OEMs) from the initial product concept stage to volume production through concept co-creation and product realization.
Recently it posted good Q2 FY 24-25 Results, posting a 30% Y/Y rise in Q2 consol profit after tax. The auto and healthcare businesses led growth in Q2 and will drive future growth further ahead. Also, expect a recovery in margins fuelled by higher exports and design and manufacturing businesses. NSE:SYRMA faces margin challenges as the consumer segment, which comprises 35%—38% of topline, operates with lower margins, and they are aiming to lower the segment's share further.
One can wait for a retracement or ride the momentum with the current week candle as stop loss.
🙋♀️🙋♂️If you have any questions about this stock, feel free to reach out to me.
📌Thank you for exploring my idea! I hope you found it valuable.
🙏FLLOW for more
👍BOOST if useful
✍️COMMENT Below your views.
Meanwhile, check out my other stock ideas below until this trade is activated. I would love your feedback.
Disclaimer: This analysis is intended solely for informational and educational purposes and should not be interpreted as financial advice. It is advisable to consult a qualified financial advisor or conduct thorough research before making investment decisions.

KAYNES TECHNOLOGY IND LTD – Technical Analysis________________________________________
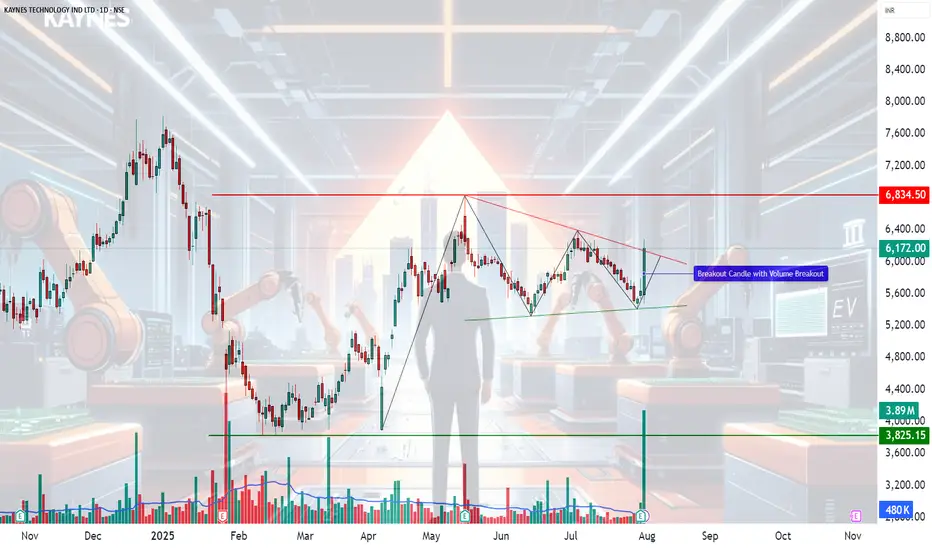
🧠 KAYNES TECHNOLOGY IND LTD – Technical Analysis
Ticker: NSE:KAYNES | Sector: EMS & Semiconductors
Current Price: 6,172.00 ▲ (+9.5% on July 31, 2025)
Technical View: ⭐⭐⭐⭐ | Chart Pattern: Falling Wedge Breakout
________________________________________
📈 Technical Overview
🔹 Chart Pattern Formed: Falling Wedge Breakout with extremely high volume confirmation
🔹 Breakout Zone: 6,000–6,050
🔹 Momentum Signals:
— RSI breakout above 60
— Strong bullish candle with rising volume
— VWAP and SuperTrend aligned bullish
🔹 Support Trendline Held on multiple touchpoints
🔹 Breakout Candle marked by heavy institutional volume
________________________________________
📰 Key Fundamental Developments
✅ Q1 FY26 PAT up ~50% YoY to 74.6 Cr
✅ Gross margin expanded to 41%, EBITDA margin to 16.8%
✅ Strategic acquisitions from Fujitsu (85 Cr domestic + 118 Cr JV with L&T)
✅ Strong order book visibility (~7,400 Cr)
✅ Raised 1,600 Cr via QIP to fund growth
________________________________________
📊 Sentiment Analysis
Sentiment: ✅ Positive
— Strong earnings beat and margin expansion
— Global expansion through Fujitsu JV
— Bullish commentary from major brokerages
— Institutional confidence via QIP and upgrades
________________________________________
🔼 Resistance Levels
6,400 – Immediate breakout target
6,834 – Top of consolidation range
7,285 – Medium-term resistance (historic supply zone)
🔽 Support Levels
5,970 – Breakout retest zone
5,700 – Structure base
5,170 / 4,864 – Deep support for longer-term invalidation
________________________________________
📌 What’s Catching Our Eye
🔹 Volume spike confirms genuine breakout
🔹 RSI, SuperTrend, VWAP – all flashing bullish
🔹 Back-to-back bullish closes after a 10 day contraction breakout
🔹 Volume & price action aligned across multiple timeframes
________________________________________
👀 What We’re Watching For
🔸 Follow-through momentum toward 6,400+
🔸 Whether breakout holds above 5,970 in coming sessions
🔸 Semiconductor line execution progress
🔸 Margin trends in upcoming quarters
________________________________________
⚠️ Risks to Monitor
⚠️ Rich valuations (~130x P/E) – limited room for disappointment
⚠️ Execution risk on new lines and acquisitions
⚠️ Global slowdown in electronics & macro headwinds
⚠️ Any delay in semiconductor segment scale-up
________________________________________
🔮 What to Expect Next
🔹 Retest of breakout zone (~6,000–6,050) possible
🔹 If held, expect momentum toward 6,400–6,800
🔹 Sideways consolidation likely if volumes taper
🔹 Strong close above 6,400 could initiate fresh uptrend leg
________________________________________
📈 Strategy Insight (For Educational Purposes Only)
— Aggressive Traders: Watch level of 6284
— Momentum Traders: Watch 6,050 retest for low-risk entry
— Risk Management: Position sizing + Capital risk – as per individual preference
________________________________________
💬 Why It’s On Our Watchlist
Kaynes blends EMS scale with high-margin ODM design and semiconductor upside. Rare in India’s listed space. Strong revenue visibility, global expansions, and balance sheet strength make it a high-conviction long-term story.
________________________________________
📉 If Price Comes Down…
5,700–5,800 is a critical support zone. Breakdown below this with volume = trend weakness. 5,400 is final demand zone before structural damage.
________________________________________
🪙 Educational Insight for Learners
This chart is a real-world example of a falling wedge breakout confirmed by volume. The key takeaway: price alone is not enough—watch volume, RSI, and structure. Never chase momentum without a plan. Always pair conviction with discipline.
________________________________________
🚨 Reminder: No stock is a “sure thing.” Use proper risk management. Stay rational when others get emotional.
________________________________________
⚠️ Disclaimer (Please Read Carefully):
This content is shared strictly for educational and research purposes only.
I am not a SEBI-registered investment advisor, and no buy or sell recommendations are being made.
All views expressed are based on personal market analysis and experience. They are not intended as financial advice.
Trading — especially in derivatives like options — involves significant financial risk. Losses can exceed your initial investment.
👉 Always do your own research and consult a certified SEBI-registered advisor before making any investment or trading decisions.
👉 Use proper risk management and only trade with capital you can afford to lose.
The author assumes no responsibility or liability for any trading losses incurred from acting on this content.
By engaging with this material, you agree to these terms.
________________________________________
💬 Found this helpful?
Drop your thoughts, questions, or insights in the comments below ⬇️ — let’s learn together!
🔁 Share this post with your trading friends and community — help them discover clean charts, structured setups, and zone-based learning.
✅ Follow simpletradewithpatience for clear setups, educational content, and a no-nonsense approach to price action, supply-demand zones, and risk-managed trades.
🚀 Trade with patience. Trust your charts. Stay clear-headed.
Because the goal is not just to trade — it's to trade better.
Be Self-Reliant | Trade with Patience | Learn with Charts & Zones 📊
NAZARA TECHNOLOGIES LTD | Monthly Chart Breakout📊 NAZARA TECHNOLOGIES LTD (NSE: NAZARA) | Monthly Chart Breakout
📅 Date: June 1, 2025
📈 CMP: ₹1,295.10 (+28.04%)
📌 Ticker: NSE:NAZARA
📉 Chart Pattern Insight
🔥 Cup & Handle + Falling Wedge Breakout
Nazara Tech has broken out of a strong Cup & Handle pattern, reinforced by a Falling Wedge breakout — a powerful confluence suggesting a major trend reversal.
🎯 Breakout is confirmed with high volume and a clean monthly candle close above key resistances.
📐 Fibonacci Retracement Levels (From High ₹1678 to Low ₹477)
🔸 38.2% – ₹935.85 (was resistance, now flipped to support)
🔸 50% – ₹1,077.55
🔸 61.8% – ₹1,219.25 (just surpassed – strong bullish confirmation)
🧭 100% – ₹1,678 (All-Time High)
📊 Indicator: RSI + Moving Average Cross (Icon shown)
🔍 RSI is at 71.63 and rising sharply, indicating strong momentum
🔺 RSI crossover above MA confirms bullish strength and trend continuation
🧱 Volume Spike
📈 Volume this month is multi-month high, validating the breakout
🔑 Key Levels
Support: ₹935 (prior resistance, now retest zone)
Immediate Resistance: ₹1,300 (psychological), ₹1,400
Target Zones:
Short-Term: ₹1,450
Medium-Term: ₹1,600+
Long-Term: Retest of All-Time High ₹1,678+
🛡️ SL: ₹935 (monthly close basis)
📌 Trading Plan
Entry: Pullback near ₹1,220–₹1,250 or breakout retest
SL: ₹935 (below 38.2%)
Target: ₹1,450 / ₹1,600+
Time Frame: Positional – Multi-week to multi-month
⚠️ Disclaimer
This analysis is for educational purposes only. Please do your own research or consult a SEBI-registered advisor before investing.

Aether Industries has been consolidating?Aether has been consolidating for almost a year within a falling wedge pattern, a structure that often signals the end of a downtrend. Recently, the stock has shown signs of bottoming out near the ₹740–750 zone, where it found strong demand in the past as well.
• This base has now formed two key bottoms, which indicate potential accumulation by long-term investors. The volume is gradually increasing near the lower end of the wedge, which may suggest silent buying.
• From a fundamental perspective, Aether operates in the specialty chemicals sector with a focus on niche products and R&D capabilities. The sector has long-term tailwinds due to India's growing role as a global chemical supplier. Aether's consistent revenue growth and expansion into new chemistries make it a structural story rather than just a trading bet.
• A breakout if close above ₹757 could trigger a strong uptrend, with potential targets around ₹1,150 and even ₹1,400 in the longer term. The price would then be aligning with the company's growth potential, as the fundamentals begin to reflect in the stock price.
• The risk-reward here favors patient investors willing to sit through volatility, especially if the company continues to deliver on execution.
Like, comment your thoughts, and share this post
Explore more stock ideas on the right hand side your feedback means a lot to me!
Disclaimer: This post is for educational purposes only and should not be considered a buy/sell recommendation.

Reliance forming a bullish patternReliance is making a falling wedge pattern, a bullish reversal setup that typically breaks to the upside.
A breakout above the upper wedge line confirms the wedge breakout.
The immediate target will be the top of the pattern zone — ~1300–1320.
Extended target (measured move): Adding the wedge height (~200 points) to the breakout level → Can aim for 1450–1500 range on long term.
Buying on the breakout and retest of wedge as support will be a valid entry.

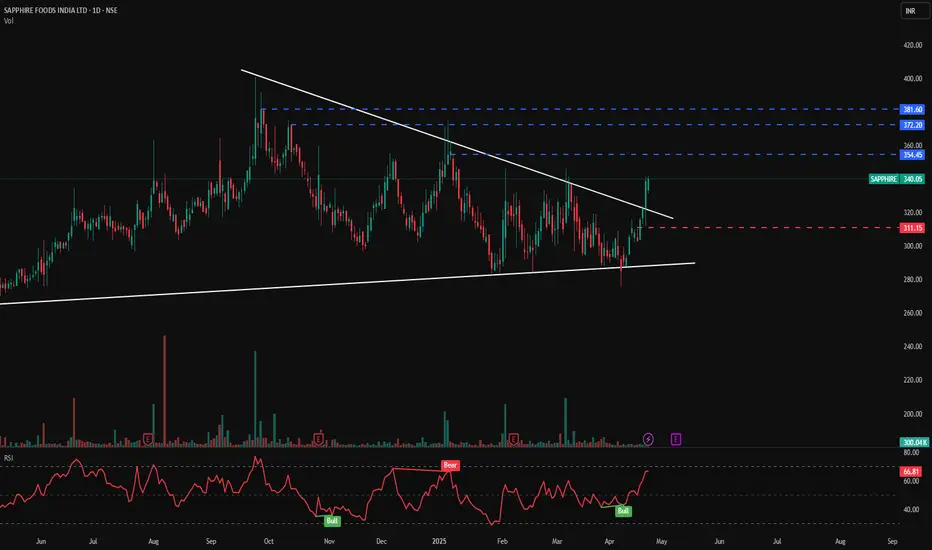
SAPPHIRE FOODS - Bullish Breakout From Falling Wedge📊 SAPPHIRE FOODS – Bullish Breakout from Falling Wedge
🕰️ Timeframe: 1D | 📉 Pattern: Falling Wedge Breakout
🔍 Technical Breakdown:
SAPPHIRE has broken out of a well-defined falling wedge pattern — a bullish reversal signal — backed by a sharp move on increased volume.
This wedge has been forming since early February, and the recent breakout above the upper trendline suggests renewed momentum and buying interest.
🔑 Key Technical Levels:
🔵 Resistance Zones (Upside Targets):
₹354.45
₹372.20
₹381.60
🔴 Support Zone:
₹311.15 (previous resistance turned support post-breakout)
⚪ Wedge Support Line: Well-held and now acting as a base for this breakout rally
📊 Volume & Indicator Insights:
🔺 Breakout is supported by a volume surge (300K), indicating institutional or smart money participation.
🔄 RSI at 66.81, nearing overbought territory but still in healthy uptrend range — confirming strength.
📉 RSI signals:
Bullish crossover (around ₹300) confirmed breakout
Prior “Bear” signal in Feb has now reversed to “Bull” (label shown)
🧠 Bias: Strongly Bullish
📍 Retest of ₹311–₹320 zone could offer re-entry opportunity with favorable risk-reward.
⚠️ Disclaimer: This chart is for educational purposes only. Please conduct your own due diligence or consult a professional before investing.
📈 Follow for more breakout pattern setups | PriceAction_Pulse
💬 Share your views on this wedge breakout in the comments!
Watch This Wedge! AUDNZD Primed for Upside PushThe AUDNZD pair forms a falling wedge pattern, a bullish reversal formation that typically occurs after a downtrend. The price action is being squeezed between a descending resistance line and a descending support line, creating a narrowing range. The market is now attempting to break out of the wedge, with the current price testing the resistance line. A breakout and close above this trendline would signal bullish strength and could lead to a reversal of the recent downtrend.
Targets:
TP1: 1.07605
TP2: 1.07922
Stop Loss: Below the recent low at 1.06542

Tata Consumer Prod. - Chart of the WeekNSE:TATACONSUM has a beautiful structure in the Weekly Timeframe that qualifies for my Chart of the Week idea. It saw Decent Volumes this week and closed above its recent swing high, with RSI and MACD Trending Upwards and Closing Above all Major Moving Averages.
About:
NSE:TATACONSUM is one of the leading companies of the Tata Group, with presence in the food and beverages business in India and internationally. It is the second-largest tea company globally and has significant market presence and leadership in many markets. In addition to South Asia (mainly India), it has presence in various other geographies including Canada, the UK, North America, Australia, Europe, the Middle East and Africa.
F&O Activity:
Significant Shorts are getting covered with 1050 PE OI Increasing Significantly.
Trade Setup:
It is Forming Like a Falling Wedge, it can test the upper edge and can give a good swing towards
1186-1190 Levels. So buy on Dips Until it closes below the Swing Low, ideally around the Marked Green Levels.
Target(Take Profit):
Around the Upper Edge of the Falling Wedge.
Stop Loss:
Swing Low Levels around 950-930.
📌Thank you for exploring my idea! I hope you found it valuable.
🙏FLLOW for more
👍BOOST if useful
✍️COMMENT below with your views.
Meanwhile, check out my other stock ideas on the right side until this trade is activated. I would love your feedback.
Disclaimer: "I am not SEBI REGISTERED RESEARCH ANALYST AND INVESTMENT ADVISER."
This analysis is intended solely for informational and educational purposes and should not be interpreted as financial advice. It is advisable to consult a qualified financial advisor or conduct thorough research before making investment decisions.

Hindustan UnileverHello & welcome to this analysis
FMCG sector appears to be doing better then other sectors after a very long time with Hindustan Unilever having a large weightage in the sector
Strength signal -
Since 2008 it has never violated the Quarterly Ichimoku Base line nor the Monthly Ichimoku Cloud. Near these support levels it becomes a very attractive value buy. This time also in 2024 it did the same.
After giving a Cup & Handle breakout in the weekly time frame its seen a pullback since October 2024 along with the rest of the market. In the last 3 weeks its gone sideways whereas we have seen other sectors continue to see sharp selling. Once again highlighting that current level is seeing consistent buying support. The pullback appears to have been completed as it bounced back from its rising trend line.
A daily falling wedge breakout has also witnessed a pullback now. As long as it now holds the rising trendline at 2350 it has good potential for upside suggesting a decent low risk high reward set up from short to medium term.
Upside levels one can look out for above 2400 are at 2700 / 3100 / 3300 / 3600
All the best for your trading and investing
My last video on the stock link is shared

BALKRISIND - Breakout in Falling WedgeView : Bullish
Entry Zone- 2860- 2800 (Trend line breakout)
Exit Zone - Based on Trader mindset. Exit 1 - 2935
Exit 2- 3050
Exit 3 - 3300
Stoploss : Close below 2750
Timeframe: Daily
Notes: Trednline break out the Falling wedge pattern. Price consolidates since May 2024.

MTARTECH - Breakout and price at support line1500 range act as good support line for this stock since 2021 and it reaches the same range in October. Solid green candle formed inside red candle at the end of October in Weekly Timeframe and the price is breakout the falling wedge pattern by today.

HAPPSTMNDS - Falling Wedge Pattern Formation🔊 HAPPSTMNDS - Falling Wedge Pattern Formation
HAPPSTMNDS - HAPPIEST MINDS TECHNO LTD
⌛Duration - Long Term (1 year to 2 years)
📊📈 Trade Logic - Falling Wedge Pattern Formation
CMP - ₹ 813
Time Frame - Weekly
🎯Target 1 : ₹940
🎯Target 2 : ₹1050
🎯Target 3 : ₹1160
🎯Target 4 : ₹1260
🛑 Stop : ₹735
🏆 Risk/Reward Ratio (1: 7)
* Stock hit ATH of ₹1580 on 12th July 2021
* After sharp fall from july 2021 to June 2022,
stock goes into consolidation mode without
any significant price change.
* Stock recently bounced back from support
line and this time there is high chance to
break the resistance and start upward journey
* Trade reason - IT sector in momentum,this stock
is already beaten down and is at good support
level.
* FII and DII have increased their stake in June
qtr vs March qtr.
Disclaimer: The stock information shared above is not a recommendation to buy, sell, or hold. It reflects my own analysis and is intended solely for educational purposes. Any actions you take based on this information are your responsibility, and the admin of this channel is not liable for any financial gains or losses. Please consult a financial advisor before making any investment decisions. I am not a SEBI-registered advisor.

MOL - TURNAROUND POTENTIAL WITH A FALLING WEDGE BREAKOUTHi All,
The idea is about Meghmani Organics
ABOUT THE COMPANY
Founded in 1986 as M/s Gujarat Industries, the company was incorporated in 1995 as Meghmani Organics Limited. The company manufactures Pigments and Agrochemicals through its 6 manufacturing facilities located in Gujarat. The company is amongst the top 3 Phthalocyanine based pigment players in the world and amongst the top 10 producers of pesticides in India. Meghmani Organics Ltd (MOL) manufactures green and blue pigment products, which are used to manufacture printing ink, plastic, paints, textiles, leather, and rubber.
TECHNICALS
The stock has been in a falling wedge pattern & has given a breakout. The breakout was sustained & has been testing first level of resistance at 88.65 multiple times.
Once it breaks it can move to 93 where next resistance lies
Fundamentals
Not a good last year but sales/profit showing symptoms of turnaround which is evident in price action
Thanks,
Stock-n-Shine

ANTONY WASTE - RISING WEDGE FOLLOWED BY FALLING WEDGE (BO)Hi All,
This idea is about Antony Waste Handling Cell Ltd
Fundamentals
Market Cap - 1419 Cr
Stock PE - 16.5
ROE - 16.3
ROCE - 13.9
Promoter Stake - 46.1
Quick Ratio - 1.3
D/E - 0.78
Antony Waste Handling Cell Ltd is engaged in the business of mechanical power sweeping of roads, collection and transportation of waste, waste to energy project and undertake the designing, construction, operation and maintenance of the integrated waste management facility in Kanjurmarg, Mumbai.
Technicals
Since June 23, the price action followed a rising wedge & then the pattern changed to falling wedge since Feb 24. With the Daily price action it seems to be coming out of falling wedge formation & developing a new pattern
Immediate targets are marked as T1 and T2. Would suggest the price to rise atleast 3% post closing to confirm the continuation.
Happy Trading,
Thanks,
Stock-n-Shine

MRF - FALIING WEDGE BREAKOUTHi All,
This idea is about MRF Limited
Market Cap - 54 891 Cr
Mcap/Sales - 2.18
P/E - 26.4
ROE - 13.2%
ROCE - 16.9%
Promoter Holding - 27.8%
EPS - 4907
Quick Ratio - 0.79
D/E - 0.17
Technicals
Price reversal breakout is seen on daily chart of MRF.
It continued in falling wedge pattern & then price broke out of the upper channel with heavy volume. This could signal a price reversal at this point Price has corrected almost 15% from its peak
Happy Trading,
Thanks,
Stock-n-Shine

Banknifty - Leading Diagonal Scenario (Fall 51800 to 51000)As we discussed in the Sunday Video... This is the alternate scenario of waves unfolding & if Index faces resistance in 51800-51900 zone, it can slip & complete the proposed 5th wave of an unfolding leading diagonal downside.
Strictly ------No Sell ---------Above 51800 ---------------------------------------------------
Downside Target - 51000 Approx.
From WaveTalks
Abhishek

Bandhan Bank -Potential Breakout in Progress (Upside Target-430)
I suggested somewhere that market participants should start looking at this stock and hold it in their portfolio with an upside trigger of 265 and a final target of 430, to be reviewed later.
No surprise – the stock has started moving from our desired zone of 155-175. What a low 169 . Will it cross 265 and later 430? Only time will tell.
Pattern: Falling Wedge (Similar to Adani Wilmar as discussed earlier)
Such patterns swiftly move towards its starting point. In this case it is 430
From WaveTalks
Abhishek

ASHAPURA MINECHEM - NEW IMPULSE - BULLISHHi Folks,
Stock has seen a major breakout on weekly charts from falling wedge pattern. RSI has broken out to confirm the upmove. Closing above 30 WEMA also provide more indications at the change of trend for coming months.
Elliott Wave Analysis
1. Completed an ongoing impulse with a divergent 3-5 wave.
2. Correction of the impulse seems to be completed wherein RSI cooled off.
3. Outbreak in RSI, price and volume support indicates towards shift of trend.
4. Halt weekly candle or a follow up move shall confirm the upmove for mid term.
5. Larger structure remains bullish.
6. Targets of larger 5 wave are already marked with fic projections.
Disclaimer - Please trade at your own risk, just for educational purposes.
