Reliance Industries – Short-Term Bounce, Bigger Zigzag UnfoldingWave Structure
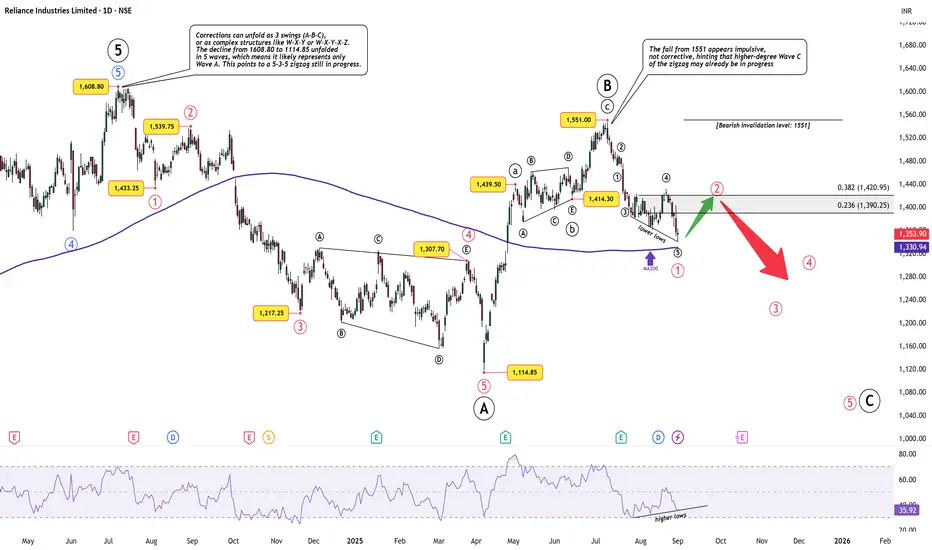
The decline from the all-time high at 1608.80 to 1114.85 unfolded in a clean 5-wave impulse. Rather than a completed W–X–Y correction, this is best viewed as Wave A of a higher-degree zigzag (5-3-5).
The subsequent rally into 1551 was a clear 3-wave move, marking Wave B . With this structure, the larger Wave C is now favored to be unfolding to the downside.
Current Setup
The drop from 1551 is impulsive, not corrective, which supports the case that Wave C is already in progress.
Price is testing the MA200 and printed bullish RSI divergence (higher lows on RSI vs. lower lows on price), suggesting near-term exhaustion.
This favors a short-term Wave 2 bounce before further downside unfolds.
Outlook
Short-term (bullish): Relief rally toward 1390–1420 possible as Wave 2 plays out.
Medium-to-long term (bearish): Once Wave 2 completes, downside is expected in Wave 3–4–5 of C, with potential targets revisiting 1100 or lower.
Invalidation: A sustained break above 1551 negates the bearish outlook and would suggest the correction has already ended.
Summary
Short-term: Bounce likely.
Big picture: Bearish zigzag not yet complete.
Disclaimer: This analysis is for educational purposes only and does not constitute investment advice. Please do your own research (DYOR) before making any trading decisions.
Fibonacci
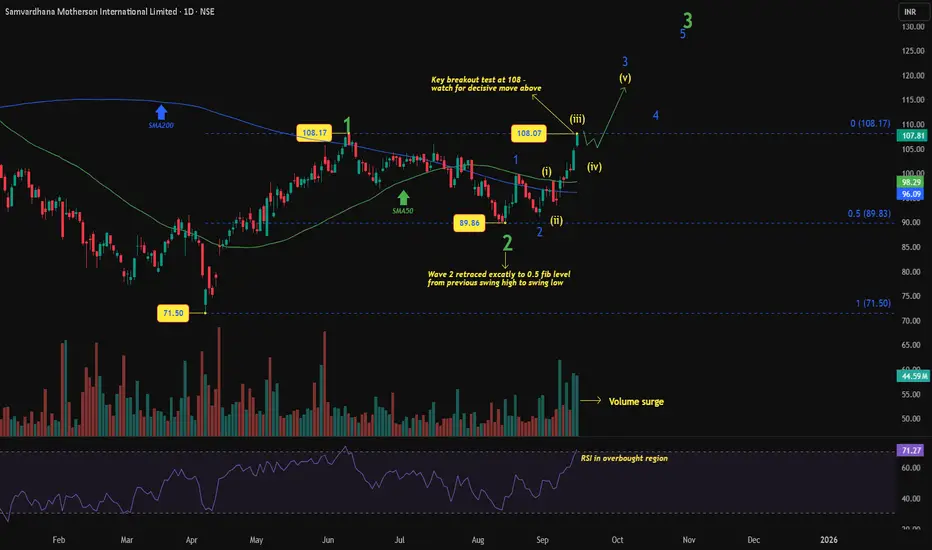
Samvardhana Motherson: Breakout or Double Top?Samvardhana Motherson has been carving a clean Elliott Wave structure since bottoming at ₹71.50.
Wave count : Wave 1 peaked at 108.17, followed by a textbook Wave 2 retracement to ₹89.86 (near the 0.5 Fib).
Current leg : Price has surged from Wave (ii) into 108, likely completing Wave (iii) of 3. A short Wave (iv) pullback would be natural before an eventual breakout in Wave (v) of 3.
Momentum factors : Strong volume surge supports the impulsive setup, while RSI in the overbought region suggests cooling off in the near term.
Moving averages : Price is now above both SMA50 and SMA200, the trend bias has turned positive, and moving averages may act as support on any pullback.
Summary : 108 is the make-or-break level. A brief consolidation is possible, but a sustained breakout above this zone in Wave (v) would confirm the Wave 3 extension.
Disclaimer: This analysis is for educational purposes only and does not constitute investment advice. Please do your own research (DYOR) before making any trading decisions.
ETH Setup You Can't Ignore:4k FVG to 5k Seller Zone ⚠️ ETH Setup You Can’t Ignore: 4K FVG to 5K SELLER ZONE!
ETHUSD – Fair Value Gap & Liquidity Sweep Setup
Ethereum is trading within a critical range, presenting a potential ICT-style setup:
Fair Value Gap (4000–4200) – Key demand zone with a “Golden Line” midpoint; price may dip to fill this imbalance before reversing.
Seller Zone (~5000) – Major supply zone where profit-taking or distribution could trigger.
Bias – Expect a sweep of downside liquidity, a reaction within the FVG, and a possible rally toward the 5000 zone if higher timeframe confluence supports it.
⚠️ Always wait for confirmation and manage risk before execution.

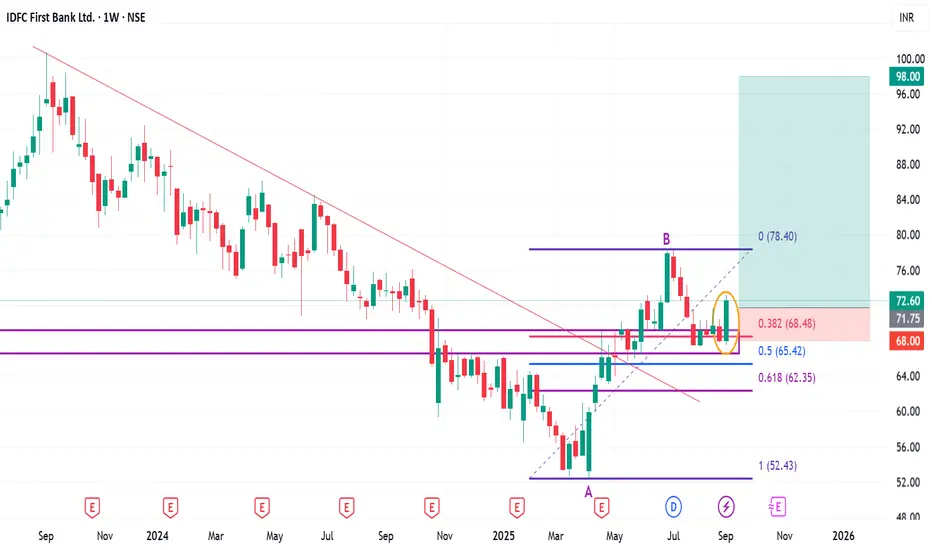
Positional or Long-term opportunity in IDFC First BankGo Long @ 71.75 for Targets of 82, 90.5, and 98 with SL 68
Reasons to go Long :
1. On Weekly timeframe If we draw Fibonacci retracement from the recent swing low (A) to the swing high (B) then the stock took support from the 0.382 Fibonacci level.
2. In addition to this, the stock formed a Bullish Engulfing Pattern (marked with a orange color) around 0.382 Fibonacci level.
3. Also there is a strong demand zone (marked with a purple color) from which the stock is taking support.
4. Besides the stock formed a Double Bottom (W) pattern at 0.382 Fibonacci level.
5. Also the stock gave a Trendline breakout (marked with a red color).
Trading Analysis for Gold Spot / U.S. Dollar (15-Minute Chart)Buy XAU/USD now at 3644.00 level and hold at 3631.00 and target will be specific.
Entry Range 3642.00 to 3644.00
Take Profit 1 = 3646.00
Take Profit 2 = 3650.00
Take Profit 3 = 3654.00
Take Profit 4 = 3658.00
Stock Loss 3631.00
Key News Timings Chart Per.
i will try to update continue.

BOMBAY BUMRAH TRADINGBombay Burmah Trading Corp Ltd
1. forming support near the opening gap/discount zone and reversing with a bullish engulfing candle.
2. Price has broken the downtrend channel and confirmed a market structure shift (MSS) above ₹1900.
3. If sustained, momentum can carry it towards ₹2100+, while a close back below ₹1850 would weaken the setup

Gold faces early selling pressure | Main trend still Buy🟡 XAU/USD – 15/09 | Captain Vincent ⚓
🔎 Captain’s Log – News Context
FED rate cut probabilities this week :
-25bps : 96.4% (up from 89.1%).
-50bps : only 3.0% (down sharply from 10.9%).
Trump : Announced more sanctions on Russia, urged NATO to stop buying Russian oil; also emphasized “the possibility of significant FED rate cuts.”
Key event today : New York Manufacturing Index at 1:30 (US time).
⏩ Captain’s Summary : The sharp drop in -50bps expectations caused early selling pressure on Gold this morning. But overall, FED is still certain to cut rates and inflation is cooling → the bigger trend continues to favor Buy .
📈 Captain’s Chart – Technical Analysis
Storm Breaker (Resistance / Sell Zone) : 3665 – 3670 (Weak High & upper cap).
Golden Harbor (Support / Buy Zone) : 3623 – 3603 – 3587.
Market Structure :
On H1, Gold is moving within a tightening triangle with EqH and EqL .
Main trend stays bullish, but needs a retest of support before rallying toward 3665 – 3670.
🎯 Captain’s Map – Trade Plan
✅ Buy (priority)
Buy Zone 1
Entry: 3623 – 3625
SL: 3612
TP: 3640 – 3650 – 3660 – 3665+
Buy Zone 2 (FVG)
Entry: 3603 – 3605
SL: 3592
TP: 3620 – 3640 – 3655 – 3665
Deep Buy Zone
Entry: 3587 – 3590
SL: 3575
TP: 3610 – 3630 – 3650
⚡ Sell (short scalp at resistance)
Sell Zone
Entry: 3665 – 3670
SL: 3678
TP: 3655 – 3645 – 3635 – 36xx
⚓ Captain’s Note
“The Golden ship faces headwinds this morning as sailors reduce expectations for a -50bps cut. But the larger sail remains filled with dovish FED winds, steering the voyage north. Golden Harbor 🏝️ (3623 – 3603 – 3587) is the safe dock to gather strength. Storm Breaker 🌊 (3665 – 3670) may raise waves, suitable for short Quick Boarding 🚤 . The main journey still favors Buy , waiting for the FED to blow more tailwind into the Golden sails.”

Inverse Cup and Handle for Bearish indicationAfter strong Bullish Engulfing formation on 5th September 2025, the OANDA:NZDCAD price is rocketing towards higher highs, aiming for 0.8624 resistance.
Now it needs some breath after forming a bearish Harami on 12th September 2025.
Looking at the Hourly timeframe, it made an inversed Cup and Handle which indicates for bearish signal.
Yet we need another confirmation for breaking its lower high at 0.8229 which is our entry price
I am bearish from Monday onwards waiting for that cup's handle breakout. Once its done my orders must be triggered and left for bearish.
I will place a sell stop order 0.8229 with my SL at the handle of cup at 0.8256.
I will take two positions both at the breakout of Handle at 0.8229. Both position has 2% risk in total
Note: The Sell stop order is a must. If its not triggered then we are not aiming for any other trade.
Position 1 with 1 % Risk
Buy Stop: 0.8229
Stop Loss: 0.8256
TP: 0.8197
Position 1 with 1 % Risk
Buy Stop: 0.8229
Stop Loss: 0.8256
TP: 0.8160

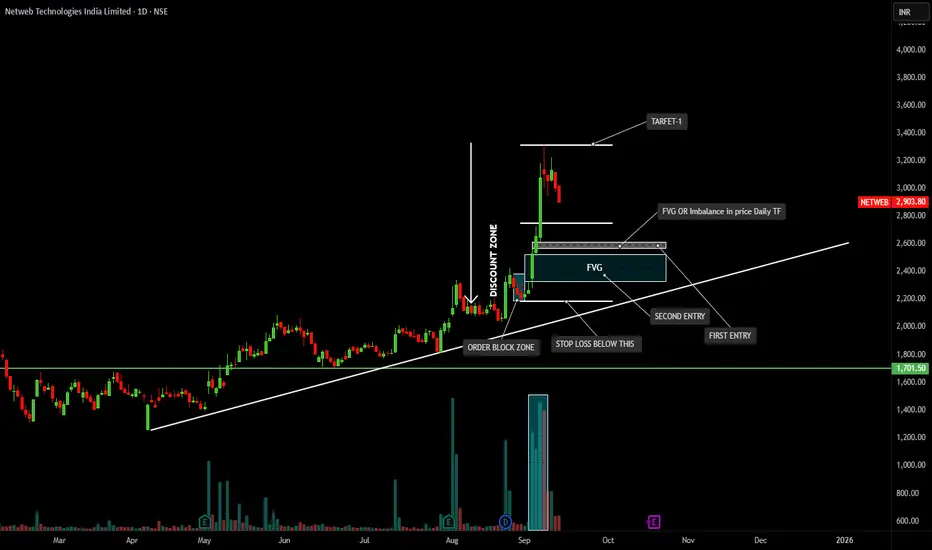
NETWEB TECHNOLOGIES INDIA LIMITEDPrice Action View
Stock had a strong breakout rally recently with heavy volume, creating an imbalance (FVG – Fair Value Gap) in the daily chart.
After the sharp move, price is now retracing downwards into the discount zone & order block area.
🟢 Bullish Points
Clear uptrend structure – higher highs and higher lows.
Strong volume spike confirms institutional interest.
Price is approaching the FVG zone (₹2,200–₹2,400) which can act as a demand zone for a bounce.
🔴 Risk / Bearish Signs
Current correction is sharp (–3.2% today) → showing sellers still active.
If price breaks below ₹2,000, structure weakens and downside towards ₹1,700 support is possible.
🎯 Trading Plan (As per Chart Markings)
First Entry: around ₹2,200–₹2,300 (inside FVG).
Second Entry: if deeper retracement near ₹2,000.
Stop Loss: below order block (~₹1,850–₹1,900).
Target 1: around ₹3,300 (previous high / resistance).
✅ Summary
Stock is in a strong uptrend but currently cooling off after a big rally. Best approach is to wait for retracement into the FVG/Order Block zone and then look for buying opportunities with a stop loss below ₹1,900. If the setup works, upside target remains ₹3,200–₹3,300
BAJAJ AUTOLiquidity Sweeps (Highlighted Circles)
Multiple highs were created earlier, which acted as liquidity pools. These were swept before price reversed lower, showing institutional activity.
This suggests smart money collected liquidity before pushing the price down.
Monthly FVG (Fair Value Gap) Discount Zone
Around ₹6,800 – ₹7,600, this is a major higher-timeframe support zone.
Price previously reacted strongly from this area (sharp bullish move after March-April 2025), confirming demand.
Weekly FVG (Fair Value Gap)
Around ₹11,000 – ₹11,400, this is a strong supply zone where price may eventually gravitate if bullish momentum sustains.
But currently, price is still far below this zoneTrading View
Bullish Case
If price holds above ₹8,200 – ₹8,400, buyers could step in again.
Upside targets:
Short-term: ₹9,600 (previous swing high).
Medium-term: ₹10,122 (marked resistance level).
Long-term: Potential move towards weekly FVG zone ~₹11,000+.
Bearish Case
If price breaks below ₹8,200, weakness may extend.
Downside targets:
First: ₹8,000 – ₹7,800.
Stronger support: Monthly FVG discount zone ₹7,600 – ₹6,800.

XAUUSD | FED leaning toward 50bps cut? | Buy strategy at support🟡 XAU/USD – 12/09 | Captain Vincent ⚓
🔎 Captain’s Log – Market Context
The probability of a FED -50bps cut next week has risen to 10.9% (from 8%), while a -25bps scenario is almost certain.
US jobless claims rose sharply → reflecting a weakening labor market, reinforcing expectations of FED easing.
Tonight (21:00): release of Consumer Sentiment & 1Y–5Y Inflation Outlook (University of Michigan) – data that could further impact the Dollar.
⏩ Captain’s Summary: Dollar weakness + falling bond yields = Gold remains supported to rise. However, short-term pullbacks may appear before breaking higher levels.
📈 Captain’s Chart – Technical Analysis
Storm Breaker (Resistance / Sell Zone):
Weak High: 3675 – 3677 (psychological barrier)
Peak Zone: 3676 – 3680 (high test, short-term reversal risk)
Golden Harbor (Support / Buy Zone):
FVG: 3603 – 3601
Deep Harbor: 3621 – 3623
Price Structure:
On H1, Gold has repeatedly formed BoS and Equal High (EqH) around 3645 – 3650.
An FVG appears → sign that price may need to fill the liquidity gap before continuing.
Priority scenario: Pullback to 3636 or deeper 3621, then rebound towards 3675 – 3680.
If 3680 breaks successfully → opens the way for new ATH above 3700.
🎯 Captain’s Map – Trading Plan
✅ Buy (trend-follow priority)
Buy FVG: 3601 – 3603 | SL: 3591 | TP: 3605 – 3610 – 3615 – 3620 – 36xx
Buy Zone: 3621 – 3623 | SL: 3612 | TP: 3640 – 3655 – 3665 – 3675 – 368x
⚡ Sell (short-term scalp at resistance)
Sell Zone: 3675 – 3680 | SL: 3684 | TP: 3665 – 3655 – 3645 – 36xx
⚓ Captain’s Note
“The dovish wind from the FED continues to push the golden sails forward. Golden Harbor 🏝️ (3636 – 3621) is the safe docking zone for sailors to gather strength before the new voyage. Storm Breaker 🌊 (3675 – 3680) may create big waves for short Quick Boarding 🚤 , but the main course is still heading North. If the 3680 wave breaks, the golden ship will extend its journey to new peaks above 3700.”

Trading Analysis for Gold Spot / U.S. Dollar (15-Minute Chart)Sorry I am late in giving the signal but I will say that manipulation in XAU/USD is at extreme level. Keep portfolio at least $1000.
Take buy position in XAU/USD as much as possible.
Not more than $3630.00.
Target 1 3353.00
Target 2 3358.00
Target 3 3365.00
Target 4 3372.00
SL 3630.00
Based on the provided 15-minute chart for Gold Spot / U.S. Dollar (XAU/USD), published by NaviPips on TradingView.com on June 30, 2025, at 17:53 UTC, here’s a suggested trading setup for a buy position:
Current Price and Trend: The current price is 3,241.875, with a slight increase of +0.250 (+0.01%). The chart shows a recent downtrend that appears to be stabilizing near the current level, suggesting a potential reversal point.
Buy Entry: Enter a buy position at 3,312.875 (current price), as it aligns with a support zone where the price has found a base, indicated by the horizontal dashed line and recent consolidation.
Stop Loss: Place a stop loss at 3,295.250, below the recent low, to protect against further downside. This level is approximately 10.625 points below the entry, defining the risk.
Take Profit Levels:
Take Profit 1: 3,317.875, a conservative target about 20.000 points above the entry, aligning with a minor resistance zone.
Take Profit 2: 3,324.750, a mid-range target approximately 31.875 points above the entry.
Take Profit 3: 3,332.500, a deeper target about 45.625 points above the entry, indicating a potential trend reversal.
Price Action: The chart indicates a downtrend with a possible bottoming pattern near the current level. The support zone and upward candlestick suggest a buy opportunity if the price holds.
Risk-Reward Ratio: The distance to the stop loss (10.625 points) compared to the take profit levels (20.000 to 45.625 points) offers a favorable risk-reward ratio, ranging from approximately 1:1.9 to 1:4.3.
Conclusion
Enter a buy at 3,241.875, with a stop loss at 3,295.250 and take profit levels at 3,317.875, 3,324.750, and 3,332.500. Monitor the price action for confirmation of an upward move, and be cautious of a potential continued downtrend if the price breaks below the stop loss level. (Note: I assume "take profot" was a typo for "take profit" and have corrected it accordingly.)

Waiting for CPI & FED rate cut | Priority Buy at support🟡 XAU/USD – 11/09 | Captain Vincent ⚓
🔎 Captain’s Log – News Context
US PPI yesterday : Wholesale prices dropped sharply, below forecasts → strengthening expectations of a FED rate cut.
FED probabilities : 100% odds for a -25bps cut next week, and even 16% of investors bet on -50bps.
Today : US CPI & Jobless Claims – key data to assess inflation & labor, determining the specific cut.
⏩ Captain’s Summary : FED will certainly cut rates, so Gold remains supported in its bullish trend. Short-term fluctuations may occur due to sentiment or surprises (e.g., tariff news from Trump).
📈 Captain’s Chart – Technical Analysis
Storm Breaker (Resistance) :
Bearish OB: 3645 – 3650 (near-term resistance)
Weak High: 3674 (target if breakout succeeds)
Golden Harbor (Support) :
Near support: 3622
FVG Dock: 3603
Bullish OB: 3581 – 3585 (strong mid-term support)
Market Structure :
H1 shows a short-term bearish BoS, retesting support.
Main trend remains bullish → possible pullback to 3622 or 3603 before rallying toward 3670+.
🎯 Captain’s Map – Trade Plan
✅ Buy (priority with trend)
Entry 1 (FVG): 3603 – 3605
SL: 3592
TP: 3610 – 3615 – 3625 – 365x
Entry 2 (Bullish OB): 3581 – 3585
SL: 3572
TP: 3600 – 3620 – 3640
⚡ Sell (only short scalp at resistance)
Sell Zone: 3645 – 3650
SL: 3658
TP: 3635 – 3628 – 3622
⚓ Captain’s Note
“The Golden sails remain full of wind as the FED is almost certain to cut rates. Golden Harbor 🏝️ (3622 – 3603) and the deeper OB 3581 – 3585 are safe havens to follow the bullish tide. If the ship touches Storm Breaker 🌊 (3645 – 3650) , only Quick Boarding 🚤 short scalps are recommended. The larger voyage still heads north, steering Gold toward new highs at 367x.”

Caution ahead of US PPI report | Priority on Sell setups🟡 XAU/USD – 10/09 | Captain Vincent ⚓
🔎 Captain’s Log – Market Context
US 10-year bond yields rebound, signaling the market is awaiting key inflation data.
At 07:30, US PPI report will be released – a crucial figure that could strongly influence FED rate expectations.
Investors are also eyeing US CPI in the coming days to assess the inflation outlook.
The US Supreme Court accepted Trump’s appeal, but this news has not yet had a notable impact on Gold.
⏩ Captain’s Summary: Ahead of inflation data, Gold often tends to correct lower due to cautious sentiment.
📈 Captain’s Chart – Technical Analysis
Storm Breaker (Key Resistance):
Bearish OB: 3654 – 3660 (short-term upper cap)
ATH Watchtower: 3700 – 3702 (Sell Zone – possible new ATH test)
Golden Harbor (Strong Support):
Buy Zone: 3601 – 3602
OB Dock: 3582 – 3585
Currently, price is around 3640 – 3645, after a technical rebound from support. High probability that Gold will retest nearby resistance before a downward correction.
🎯 Captain’s Map – Trade Scenarios
⚡ Quick Boarding (SELL – Daily Priority)
Entry 1: 3654 – 3660
SL: 3668
TP: 3654 → 3650 → 3618 → 3610
Entry 2 – ATH Test: 3701 – 3703
SL: 3711
TP: 3688 → 3675 → 3665 → 365x
✅ Golden Harbor (BUY – Only at deep support)
Buy Zone: 3601 – 3603
SL: 3592
TP: 3610 → 3620 → 3630
⚓ Captain’s Note
“The golden ship faces turbulent seas today as it sails near Storm Breaker 🌊 (3654 – 3660) . Before the fierce winds called US PPI , sailors should prioritize dropping anchor with short-term SELL positions at resistance. Golden Harbor 🏝️ (3601 – 3603) remains a safe haven below, but only when the ship corrects deeply should it dock. On this voyage, Quick Boarding 🚤 is for scalp maneuvers, while the main current is still steered by the stormy waves of inflation.”

XAU/USD – Captain Vincent Update | 15m Outlook🔎 Captain’s Log – Market Structure
On the 15-minute timeframe (M15) , price just formed a Break of Structure (BoS) above the previous accumulation zone → confirming temporary control by the Buy side.
However, the Bearish Order Block (H1 Zone) around 3655 is being tested, marking a key resistance area.
📈 Captain’s Chart – Bullish Scenario
If price holds above the OB zone 3644 – 3655 , buying pressure may continue to push the ship toward the Weak High 3674 .
Further ahead, the next destination is Storm Breaker Peak (3701 – 3708) – where strong selling reactions are expected.
📉 Captain’s Chart – Bearish Scenario
After sweeping liquidity and touching the Storm Breaker (Sell Zone) , Gold may reverse lower.
Key level to monitor: OB 3644 . If this area breaks, the market could open a deeper bearish leg.
🎯 Captain’s Map – Key Levels
Golden Harbor (Support) : 3644 – 3655 (OB retest zone)
Target (Bullish) : 3674 → 3701 – 3708
Storm Breaker (Sell Zone) : 3701 – 3708
Invalidation : Break below 3644 opens a new bearish journey
⚓ Captain’s Note
“The Golden sails have just caught new wind after a BoS , showing that the captain and crew still hold a short-term advantage. Golden Harbor 🏝️ (3644 – 3655) is the key dock to sustain the bullish trend. If Gold clears the Weak High 3674 , the ship may head straight to Storm Breaker 🌊 (3701 – 3708) , where reversal waves are likely to rise. While the short-term tide remains bullish, Storm Breaker still hides major risks – sailors must sail with strict risk management discipline.”

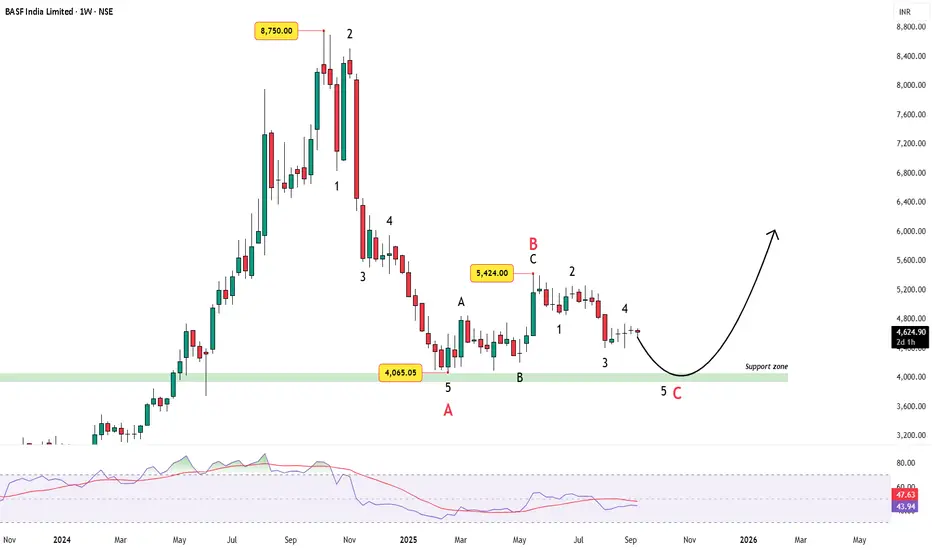
BASF India – 53% Correction Nearing Wave 5 SupportBASF India, a leading chemicals producer, has witnessed a sharp correction from its euphoric highs of ₹8,750. In just a few months, the stock retraced nearly 53%, wiping out more than half its gains.
Wave count
From the ATH, price unfolded into a 5-wave impulse decline, bottoming near ₹4,065. This completed the Wave A of the zigzag.
The subsequent recovery to ₹5,424 shaped up as a clear A-B-C corrective rally.
Since then, the stock has been carving out another 5-wave decline, now progressing towards its final leg (Wave 5 and eventually Wave C of the zigzag).
The support zone around ₹4,000 remains crucial — a likely area for Wave 5 to bottom.
Momentum Check
RSI sits near 43, showing weakness.
No strong bullish divergence yet, which hints at the possibility of one last dip before a reversal attempt.
Outlook
If Wave 5 completes around the ₹4,000 zone, this could complete the ABC zigzag and BASF India could set the stage for a larger rebound sequence into 2026. If price breaks below 4000 convincingly and continues the downtrend, then we are in for a further deep correction.
⚠️ Disclaimer: This analysis is for educational purposes only and does not constitute investment advice. Please do your own research (DYOR) before making any trading decisions.
Ola electric : Re entry opportunity Taking support.
Can re enter .
S loss can be 10% ..Long term stock .
Can generate generational wealth

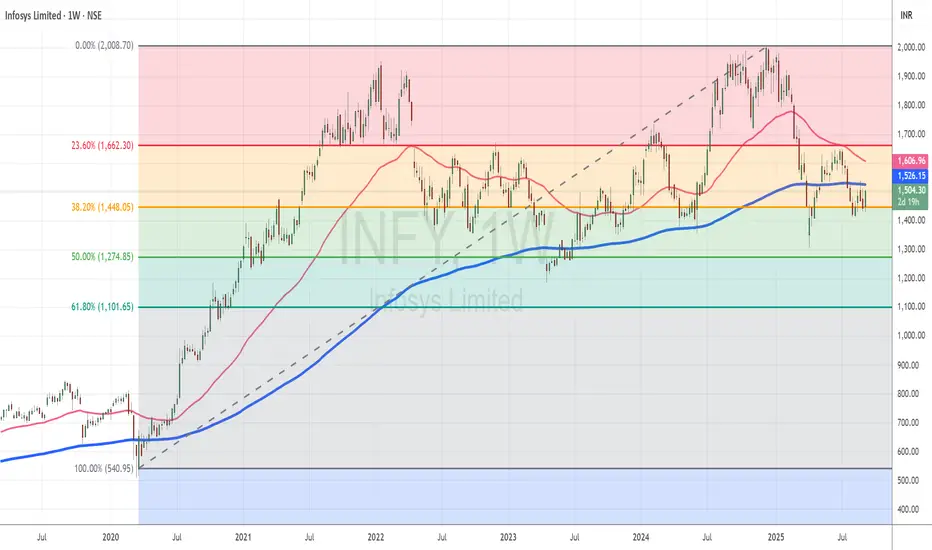
Infy Trades Sideways Since 2022, Offering Support-Driven Entry OTopic Statement:
Infosys has remained stuck in a broad sideways zone since 2022, with strong support levels offering promising long-term accumulation signals.
Key Points:
1. The stock has been range-bound between 1400 and 2000, repeatedly failing to break above the upper resistance
2. It currently stands on the 38.2% Fibonacci retracement level, where it is receiving strong support
3. Price is below the 200-day EMA, making the stock technically oversold and presenting an attractive investment opportunity
Gold Plan - Waiting for a pullback to Buy safely | New ATH ahead🟡 XAU/USD – 09/09 | Captain Vincent ⚓
🔎 Captain’s Log – News Context
FED : The probability of a September rate cut is now almost certain, reinforcing confidence that flows will continue moving into Gold.
Dollar : Dropped to a 7-week low due to FED rate cut expectations, adding further support for Gold.
US Economic Data : No major news today, the market focus remains on interest rates.
⏩ Captain’s Summary: Gold remains in a strong uptrend. However, Vincent advises waiting for a pullback into support to Buy safely , avoiding chasing price at higher levels.
📈 Captain’s Chart – Technical Analysis
Storm Breaker (Resistance / Sell Zone) :
Quick Boarding: 3654 – 3656 (Short-term Sell scalp)
Storm Breaker Peak: 3673 – 3675 (Sell zone – potential new ATH)
Golden Harbor (Support / Buy Zone) :
Buy Scalp Dock: 3615 – 3617
Main Golden Harbor: 3597 – 3599 (Strong support)
Price structure remains bullish after multiple BOS – Break of Structure. Current highs may trigger short-term profit-taking waves before Gold pulls back to Golden Harbor and then rallies toward ATH 367x .
🎯 Captain’s Map – Trade Scenarios
✅ Golden Harbor (BUY – Priority with trend)
Buy Scalp: 3615 – 3617 | SL: 3598 | TP: 3620 → 3623 → 3626 → 3630 → 36xx
Main Buy Zone: 3597 – 3599 | SL: 3589 | TP: 3660 → 3663 → 3666 → 3670 → 36xx
⚡ Quick Boarding (SELL Scalp – Only at resistance)
Sell Zone 1: 3654 – 3656 | SL: 3662 | TP: 3650 → 3647 → 3644 → 3640 → 36xx
Sell Zone 2 – Storm Breaker Peak (ATH test): 3673 – 3675 | SL: 3682 | TP: 3670 → 3667 → 3664 → 3660 → 36xx
⚓ Captain’s Note
“The interest rate winds from the FED continue to power the Golden sails. Golden Harbor 🏝️ (3597 – 3599) is the safe haven for sailors trusting the bullish tide. Quick Boarding 🚤 (3615 – 3617) is just a short ride before the voyage resumes. Storm Breaker 🌊 (3654 – 3675) may bring big waves, but it’s only suitable for technical scalps – as the main current still carries Gold toward new highs.”

Zydus Life Science Breakout Zydus Life Science has given decisive breakout above 1035. Price action is favourably bullish and Targets mentioned in chart. Fibonacci levels correlating perfectly.
Note : Not a recommendation

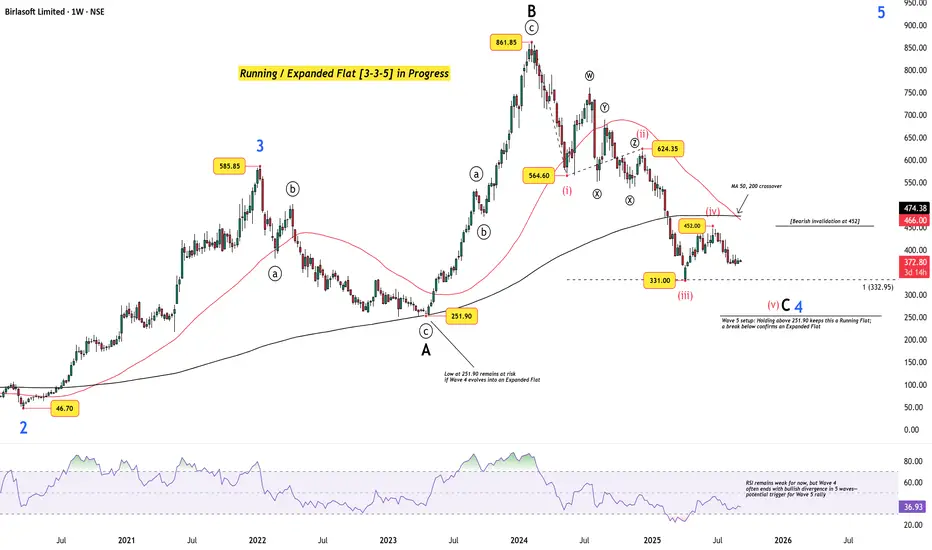
Birlasoft: Running or Expanded Flat Correction [3-3-5] in PlayAfter completing a strong rally to ₹861.85(identified as Wave B), Birlasoft has been locked in a corrective structure that is shaping up as a flat . At this stage, it remains open whether this develops as a Running Flat or an Expanded Flat .
The Structure So Far
Wave A bottomed at ₹251.90, setting the first leg of the correction.
Wave B extended sharply to ₹861.85, exceeding the prior Wave 3 peak.
Wave C has unfolded in five waves, with Wave (iii) bottoming at ₹331 — exactly the 100% Fibonacci extension of Wave (i) projected from Wave (ii).
Key Levels to Watch
₹251.90 → If price holds above, Wave 4 qualifies as a Running Flat .
If broken below , Wave 4 shifts into an Expanded Flat .
₹452 → The Wave (iv) high acts as the bearish invalidation level .
RSI Context
The RSI remains weak , Wave 4 often ends with bullish divergence in its fifth wave , which could trigger the start of the next impulse — Wave 5.
Moving Averages
A weekly 50/200 MA crossover confirms broader weakness, but such crossovers often come late in the cycle, which might suggest that Wave 4 may be nearing exhaustion.
Outlook
Birlasoft’s correction is in its final stages. A bullish divergence on RSI, combined with price stability above ₹251.90, could set the stage for Wave 5 rally to new highs . Conversely, a break below this critical level confirms an Expanded Flat and delays the bullish sequence.
Disclaimer: This analysis is for educational purposes only and does not constitute investment advice. Please do your own research (DYOR) before making any trading decisions.
XAU/USD – GOLD 08/09 | Captain VincentObserving JPY & USD | Buy still holds dominance
🔎 Captain’s Log – News Context
This morning there were no major new updates.
The US session tonight (08/09) will also not release big data.
The latest impact on the market is Japanese PM S. Ishiba’s resignation , which pressured JPY downward and slightly lifted the Dollar.
However, Gold only made a small correction and maintained strong stability.
➡️ Captain’s Summary: Dollar and JPY currently only have indirect influence, not enough to push Gold deeply lower. The main trend is still supported for a bullish rebound.
📈 Captain’s Chart – Technical Analysis
Captain’s Shield (Main Support):
Golden Harbor OB: 3542 – 3549
Main Buy Zone: 3549 – 3551
Liquidity Dock: 3573 – 3575
Storm Breaker (Resistance):
Quick Boarding: 3602 – 3604 (Short-term Sell scalp)
Storm Breaker Peak: 3632 – 3634 (Sell zone – may form a new ATH)
⏩ Price structure remains bullish (continuous BOS). Corrections are mainly liquidity grabs before pushing up to higher resistance zones.
🎯 Captain’s Map – Trade Scenarios
✅ Golden Harbor (BUY – Priority)
Buy Zone: 3549 – 3551 | SL: 3542 | TP: 3553 → 3557 → 3560 → 3563 → 35xx
Liquidity Dock: 3573 – 3575 | SL: 3565 | TP: 3578 → 3581 → 3583 → 35xx
⚡ Quick Boarding (SELL Scalp – Short-term)
Entry: 3602 – 3604
SL: 3610
TP: 3600 → 3597 → 3594 → 3591 → 3588 → 35xx
🌊 Storm Breaker (SELL Zone – New ATH)
Entry: 3632 – 3634
SL: 3640
TP: 3629 → 3625 → 3623 → 3619 → 361x
⚓ Captain’s Note
“The golden ship sails steadily as the seas remain calm this morning, with no big news waves. Golden Harbor 🏝️ (3549 – 3551) together with OB near 3542 is the safe anchorage for sailors riding the bullish trend. Liquidity Dock ⚓ (3573 – 3575) is just a temporary anchor before the bullish winds carry the ship further. Quick Boarding 🚤 (3602 – 3604) is for those who want to ride short-term waves. And if the ship touches Storm Breaker 🌊 (3632 – 3634) , it may be a new wave peak – but the grand journey is still headed North with the bullish sails full of wind.”

Reliance Moves Steadily in Mild Bullish Channel, Approaches Key Topic Statement:
Reliance is trading within a wide, mildly bullish uptrend, offering clear accumulation opportunities as it nears key moving average levels.
Key Points:
1. The stock is moving in a broad and mildly bullish up-trending channel, making it suitable for structured channel trading
2. A recent double top candlestick pattern has formed, indicating potential near-term resistance
3. The price is currently above the 50-day EMA, and dips below it has historically offered good investment entries
4. The stock is approaching the 200-day EMA, a level that often marks oversold territory and presents strong long-term buying opportunities
