Havells: Testing Key Support Levels Amid Market CorrectionTopic Statement:
Havells has corrected along with the broader market and is now approaching critical support levels that may determine its next move.
Key points:
1. The price is taking heavy support at the 38.2% retracement level at 1,476.
2. The stock is trading close to the 180-day moving average.
3. Weekly RSI is at 40, indicating the stock is nearing oversold territory.
4. If the support at 1,476 fails, the price may decline further to the 50% retracement level at 1,280.
Fibonacci

Nifty Levels of supportCurrently i am seeing 3 levels of support.
1. Current retracement level is at 50% (22600), and just on the top of resistance levels of Q3 2024.
2. next support possibly at 61% retracement (21600-21700), which also falls on the trend line which passes through peaks of Oct'21 and Sep'23 interestingly cuts through the gap-up in Dec'23
3. final level of support is 78% retracement (20400-20500), which finally fills the Gap-up in Dec'23.
Hopefully it should reverse from the current levels, but it should not go beyond 20500 level which is 78% retracement.

discounted stock HINDALCOTechnical Analysis Summary:
Trend Analysis: HINDALCO INDUSTRIES LTD is currently exhibiting a bullish trend, characterized by higher lows and higher highs. The stock has shown strong upward momentum.
Breakout Level of 2021: Significant interaction with this level, indicating its importance.
Candlestick Pattern & Price Action: Bullish Engulfing and Doji patterns suggest potential bullish reversals and strong buying interest.
Conclusion:
The stock is currently in a potential buy zone within the green reversal area.
Monitor key support and reversal levels for potential price movements.
The RSI and volume indicate a neutral position with significant trading activity, supporting a potential reversal if buying pressure increases.
Key Levels:
Support Zone (Yellow): Between ₹556-₹603 . This is the range where the stock has shown buying interest and potential support.
Reversal Zone (Green): ₹608-₹639 This zone indicates a potential area for price reversal and is likely where buyers might step in.
Target Levels: ₹728.35 (Target 1), ₹774.75 (Target 2), ₹833.90 (Target 3)
RSI (Relative Strength Index) and Volume:
RSI: The Relative Strength Index (RSI) is currently at 47.02, indicating a neutral position. It suggests that the stock is neither overbought nor oversold.
Volume: The recent volume is 9.01M, showing significant trading activity around key levels.

NIFTY: Trend Shift Signals Deeper Correction PotentialTopic Statement:
NIFTY has broken below its long-term up trendline, indicating a shift in trend with potential for further downside.
Key points:
1. The price has breached the long-term up trendline, suggesting a bearish or sideways trend.
2. Immediate support may be found at the 23.6% retracement level at 21,851.
3. Further correction to the 38.2% retracement level at 19,100 is possible.
4. The trend will remain bearish or sideways until a breakout above the down-trendline occurs.

24-02 Nifty key levelsDear traders, here are the key levels for nifty 24-02-2025, important support and resistance for intraday based on previous day movement and market trend.
Note: Intraday view only

BankNIFTY: Holding Strength Amid Market CorrectionTopic Statement:
BankNIFTY is undergoing a correction but remains more resilient than NIFTY, with key retracement levels acting as support.
Key points:
1. The price has breached the weekly up-trendline, signaling an end to the bullish trend.
2. BankNIFTY may see further correction, shifting its trend to sideways or bearish.
3. Retracement levels will serve as key support zones during the correction.

Positional or Long term Opportunity in Shipping Corp Of IndiaGo Long @ 205.7 for Targets of 241.1 and 276.5 with SL 188
Reasons to go Long :
1. On a Weekly timeframe if we draw the Fibonacci retracement tool from the recent swing low (point A) to the recent swing high (point B) then we see stock took support from the 0.618 Fibonacci level.
2. Besides, a bullish candlestick pattern Bullish Hammer (marked with orange) is formed around the 0.618 Fibonacci level.
3. Also there is a strong Trendline (marked with green color) which supports the stock.
4. In addition to this there is a strong support zone (marked with purple) from which the stock is taking support.

FIN-NIFTY analysis for the weekKey Observations:
Current Price: 23,174.35 INR
Price Change: +2.85 INR (0.46%)
Volume: 1,887,686 shares
Timeframe: Daily
Conclusion:
Short-Term Traders: Monitor the reversal zone closely for potential entry points. Use the target levels as potential profit-taking zones.
Long-Term Investors: Keep an eye on the key support levels to gauge market strength and make decisions accordingly.
Risk Management: Maintain a stop-loss slightly below the lowest support level (22,878.40) to minimize potential losses.
This technical analysis suggests a balanced market sentiment with potential for upward movement if the reversal zone is respected. The multiple target levels offer opportunities for traders to capitalize on price momentum shifts.
Technical Analysis Summary:
Price Action: The current price is within a well-defined trading range. The highlighted reversal zone suggests a potential area where price momentum could shift.
Support and Resistance: Multiple support and resistance levels provide a comprehensive framework for potential price movements. The key support level at 22,878.40 might act as a strong defense against further price decline, while the target levels indicate potential upward price movement if the reversal is confirmed.

Short side Idea for XAUUSDas we can see after finishing 5 wave Gold enter in corrective wave in bigger time frame where A and B wave is completed and now B to C wave is left where as per trend base FIB provide me possible downside area next week i am looking forward to catch this B to C wave.

Angel One: Finding Support Amid Market Correction Topic Statement:
Angel One has declined along with the broad market correction but is receiving strong support at key technical levels, suggesting a potential stabilization.
Key points:
1. The price is receiving crucial support at the 50% retracement level, as it had previously.
2. The 2000 level aligns with the 50% retracement level, acting as a strong support zone.
3. The stock is currently trading below the 45-day moving average making the price oversold.

21-02 Nifty Key levelsDear traders, here are the key levels for nifty 21-02-2025, most important support and resistance for intraday, based on previous day movement and market trend.
Note: Intraday view only

POONAWALLA Analysis!On this chart, there are special lines called "Fibonacci levels," which help guess where the price might stop or change direction.
Here's the easy part:
Fibonacci Levels: Think of these as road signs on the chart. They show where the price might find support (like a safety net) or resistance (like a ceiling).
Blue Arrow: This arrow suggests that the price might go up.
Price Increase Note: The chart says that the price could increase around 20%.
feel free to ask! 😊

RBLBANK!Simple explanation:
Candlesticks: Each candlestick shows the price of the stock for one day. A green candlestick means the price went up that day, and a red one means the price went down.
Fibonacci Retrenchment Levels: These horizontal lines are like checkpoints, showing important price levels where the stock might stop and change direction. Think of them as guideposts on a trail.
Price Targets: These are the expected price levels the stock might reach. For example, if the stock moves up, it could hit the price target marked by an arrow.
Volume: This shows how many stocks were traded. A high volume means lots of people were buying or selling that day.
Current Price: The current price of the stock is ₹152.79, which is down by 7.02%.
So, traders use this chart to understand past price movements and predict future changes, helping them make decisions on buying or selling the stock. 📈📉
Hope this helps! If you have questions, just let me know.

MAHARASTRA SEAML - Aggressive Reversal Bet!Price Analysis & Overview:
1. EMA support taken.
2. Strong Fib support zone.
3. Blast above 900
4. 100%+ Potential
5. Need good volumes
6. Entry above 710 post confirmations
7. Strong buying candle formation is needed.
- Stay tuned for further insights, updates and trade safely!
- These are my personal views.
- If you liked the analysis, don't forget to leave a comment and boost the post. Happy trading!
Disclaimer: This is NOT a buy/sell recommendation. This post is meant for learning purposes only. Please, do your due diligence before investing.
Thanks & Regards,
Anubrata Ray

SWING (KEEP WATCH) - TATA INVESTScript showing high intraday momentum cleared trendline resistance now trading around 0.38 fib levels can head to next major swings resistance zone around 6500

BPCL: Stabilizing After Market Correction Topic Statement:
BPCL has declined in line with the broad market correction but is finding support at key retracement levels, offering an accumulation opportunity for investors.
Key points:
1. The 50% retracement level is acting as a strong support.
2. The price is currently just above the 180-day moving average.
3. While the price may fall to the 61.8% level, investors can consider accumulating at the current 50% retracement level.

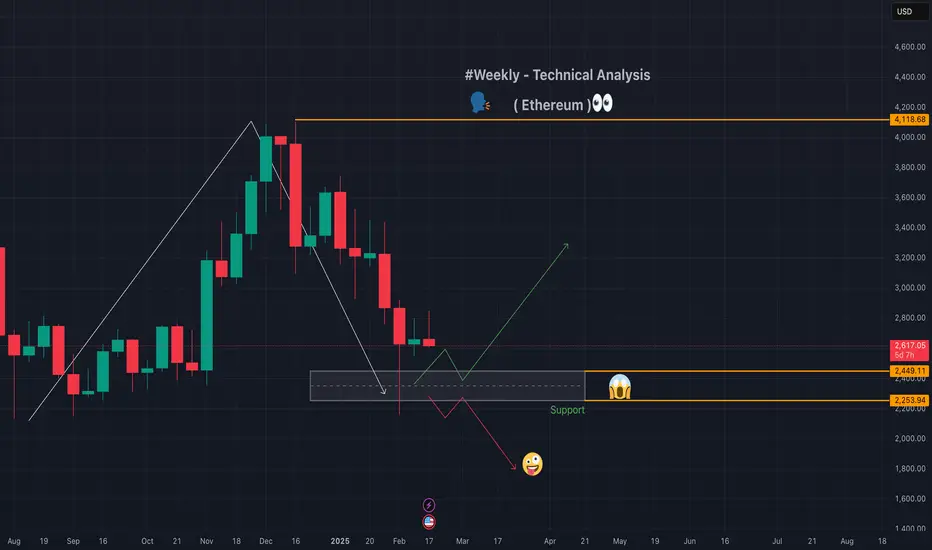
Ethereum - Technical - Weekly❣️#Ethereum has been experiencing a downward trend with lower highs and lower lows, suggesting a bearish outlook in the short term. However, there are signs of a potential sideways movement in the very short term.
sharing a 📉chart for your reference so any body can learn and make decision.💟
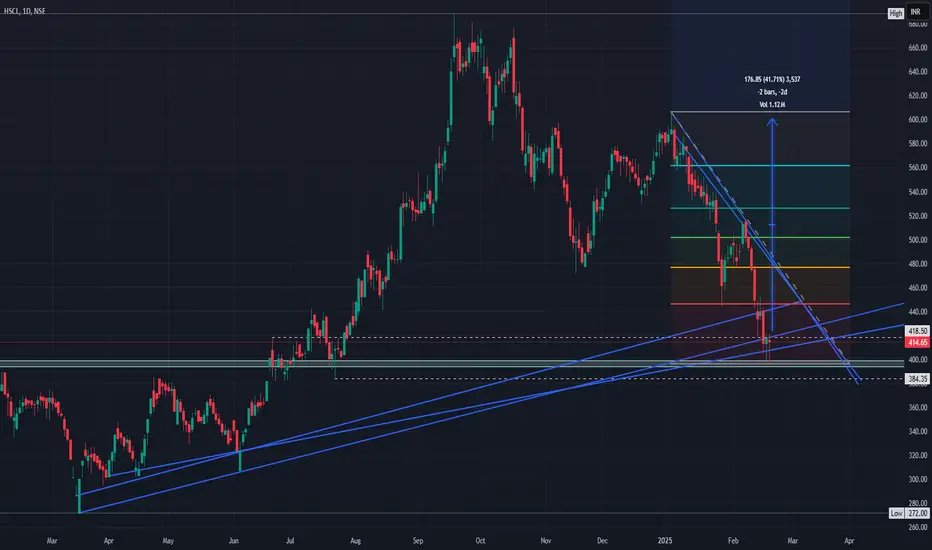
HSCL (NSE) – Technical Analysis (Explanation)Downtrend Correction : The stock has been falling from recent highs but is near key support (~₹412).
Descending Trendline : Price is trying to break above the downward sloping line; a breakout could signal a bullish reversal.
Fibonacci Targets : Potential upside targets are around ₹485, ₹506, and ₹557 if the breakout holds.
Risk Level: A break below ₹412 support may lead to further downside.
Redington: Swing Trade OpportunityRedington has demonstrated a significant recovery after a rebound from the demand zone, which is identified between the price levels of 158 to 161. The stock has successfully breached the previously established resistance range of 186 to 189, closing above this critical level, which is a positive indicator for potential further upward movement.
The price movement from lower lows to higher highs illustrates a robust bullish trend. Notably, the stock has encountered the 61.8% Fibonacci retracement level multiple times, reinforcing the notion of a strong upward trajectory in the near term. This recurring interaction with the Fibonacci level suggests that the market participants view this area as a strong point of support and resistance, which is crucial for traders to consider.
Further corroborating the positive outlook, both the Relative Strength Index and the Moving Average Convergence Divergence indicators on the daily and weekly time frames reflect strong buying momentum. An RSI value above 70 may indicate an overbought condition; however, current readings suggest that the stock is not yet in that territory, leaving room for potential upward movement. Meanwhile, the MACD crossing above its signal line indicates a bullish trend.
The stock currently appears poised for accumulation at the current market price. Traders and investors should be aware of a potential resistance range at approximately 225 to 227. It is advisable to consider placing a stop-loss order below the demand zone, ideally around the 158 level, to mitigate potential losses in the event of an unfavourable market movement.
Disclaimer:
The information contained in this technical analysis report is for informational and educational purposes only and should not be construed as financial advice. It is recommended that individuals conduct their own research or consult a qualified financial advisor and consider their financial situation and risk tolerance before making any investment decisions.

Manhindara & Mahindra strong down zoneNSE:M&M
mahindra & Mahindra break trendline
Disclaimer: This analysis is for educational purposes only.
Please assess your own risk tolerance and conslut with a financial advisor before trading.

SWING (KEEP WATCH) Script broke down major support trendline in hourly time frame , now below 0.5 fib around support area 172 trying to take support , but further fall below 0.38 fib-166 level can lead to testing of major support swings around 155

17-02 Nifty key levelsDear traders, here are the key levels for nifty, most important support and resistance for intraday, based on previous day movement and market trend.
Note: Intraday view only(17-02-2025)

TATA Power again down scenarioNSE:TATAPOWER
Tata Power make again down scenario
price halt pivote point between 38% to 50%
Disclaimer: This analysis is for educational purposes only.
Please assess your own risk tolerance and conslut with a financial advisor before trading.
