Banknifty In Uptrend 5th Impulse Wave of Leading DiagonalAs explained in previous chart we were able to pin point Banknifty's down move.
Downward wave four 4 was double zig zag correction which completed near 24404.
We are witnessing now final Wave 5 impulse of leading diagonal and currently in wave iii which should extend 2.618=24785 to 25000.
There will be sideways correction next may be till 23500-23300.
Final Wave 5/v should reach 26361 Fibonacci 0.618 retracement from march low or bit higher for 27000.
As it already moved very rapidly Invalidation level is deep and high of wave i viz. 21811
DISCLAIMER:There is no guarantee of profits nor exceptions from losses.
Technical analysis provided on the chart is solely the personal views of my research.
You are advised to rely on your own judgments while taking any investing/Trading decisions.
Past performance is not an indicator of future returns. Investment/trading is subject to market risks.
Seek help of your financial advisors before investing/trading.
I am holding banknifty etf from 21000 levels
Fibonacci Extension

Potential breakout - Channel patternStock moving in a channel pattern. Took 61.8% support & moving up. Now near to a short term trend line breakout. After that, if it breaks next Resistance, only then huge targets.

Fibonacci Retracement - Zig Zag - Swing TradeOn the Chart, the price follows a zig-zag pattern. Using Fibonacci the price touches 1.414 at price 155 with RSI below 30. It bounces back to 0.314 which is up to 196 in short term.

LT Impulse down Wave 5, Pain Still LeftLarson & Toubro about to start Downward 5th Impulse wave which will be truncated.
Stock did retraced 0.382 fib from march lows and looks to have completed Tripple Three Wave at 1025.
Case 1: Upside looks limited as have made Three black crows and move towards 980-1000 is ideal short entry with SL 1025 or 1040. Then going towards 890, 860, 840, 692.
Not expecting to go below march low 661
Case 2: Moves up and touches 1025 then wave count from march low is WRONG.
Disclaimer: For information purpose only, plotted values may differ in actual movement. Not to be used for FnO trades. This investment may not be suitable for all investors or analysis can be wrong so ask your financial advisor before investing/trading.

BULL RUNBAND/USDT
Band get Support at fib level 0.38, if it may withstand above this level.it has to overcome a Resistance a fib level 0.61
Target Price-21 ,33.8
Stoploss Price-13.1
HAPPY TRADING
Follow us for more
Plz do like and support


Bandhan Bank to start fresh Impulse WaveStock post touching 650 broken Consolidation started going south till 152.
From 152 it made retracement fib levels 0.5 completing first 5 wave impulse
Right now stock trading in parallel channel and expected to respect it as Volume dropping and wave C could be coming to end near 270 which is again 0.5 Fib level of impulse.
Long all dips towards 270
Short term STOP LOSS 248, For Long term bigger Stop loss of 195 on daily closing basis.
Expecting impulse 5 waves to start soon with short term targets 368,396,432(possibly wave 3).
Long term positional target 521 (80%+).
Disclaimer: Calculated and plotted values may differ from actual stock movement. Plotted wave count can be wrong. This investment/trade may not be suitable for all investors. Do your own study or ask your financial advisors before investing/trading.
Please hit like button that will motivate me to do more. You can donate Trading view coins as well. Thanks :)

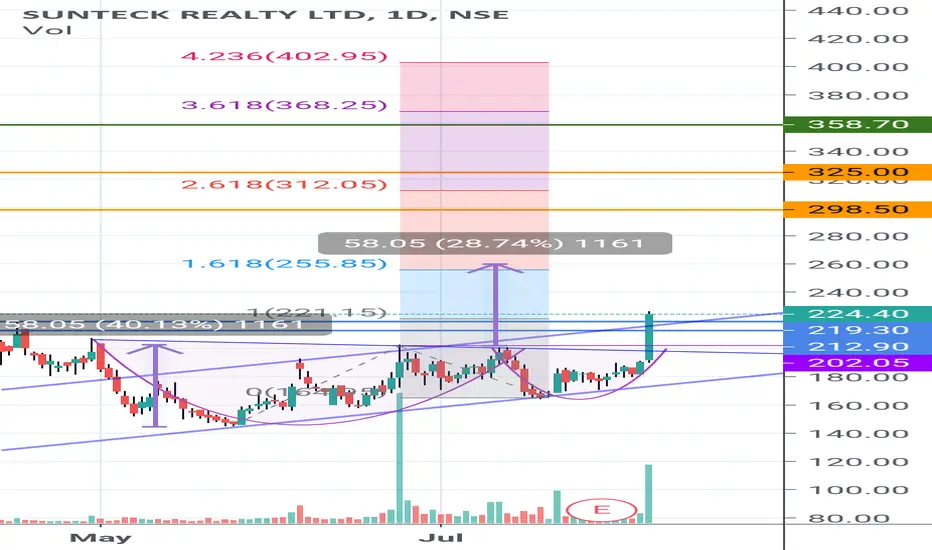
Sunteck Reality Third Wave cup and handle breakout All dips till 200 long opportunity for target 260, 286-300,360. SL 180 on daily basis.
Disclaimer: small cap stock highly risky so consult your financial advisors before investing. Defined values may vary in actual price movements.
Minda Industries Leading Diagonal end Wave 3 StartStock post breaking Leading Diagonal started upside with big volume.
Long all dips towards 330-310
Wave 3 has started which should move towards 400-420 (1.68 Fib level) zones.
STOP LOSS 277
In longer horizon Wave 5 (equal to Wave 1) positional target 475. Wave 4 will be complex and long correction towards 365 (0.382 fib level).
Disclaimer: Calculated and plotted values may differ little with actual stock movement. Plotted wave count can be wrong. This investment/trade may not be suitable for all investors. Do your own study or ask your financial advisors before investing/trading.
Please hit like button that will motivate me to do more. You can donate Trading view coins as well. Thanks :)

RBLBANK - Long TermRbl bank is willing to compete with others. Perfect flag shows its bullishness. Hold for 1-2 Months for targets...

TVS Motors ShortThis is a long term view,
It is in uptrend in Daily TF,
So there is a chance for failure
Downtrend in Monthly TF
Fibonacci Extension reached 1 and showing resistance
Fibonacci Retracement reached 0.618
Earnings results expected on July 22 @-2.85
Probable target
Entry point


Cholafin - Short TermCholafin given breakout with good volume also made pennant. Targets on chart...


ZEEL | 21 JUL 2020FIB LEVELS FOR BUY TARGETS
GREEN ZONE BULLISH REVERSAL POSSIBLE
RED ZONE BEARISH REVERSAL POSSIBLE
ALL THE BEST...!

Mindtree - Rally PendingAs per analysis mindtree gonna fly like rocket in coming days... Most probably it will give all the given targets in a week or two... Targets on chart...

Gail - Short termGail looking for at least 10% upward move.will get resistance 105-106...Targets on chart...

LEVELS AND TREND DECCANCE. [fib levels]Stock making a rising trendline pattern since march. After a sharp upmove it corrected heavily this past week.
Can see the stock take support at trendline where it presents a good buy opportunity.

Copper Buy / Sell Based on FIBO / Gann - INTRADAYAs per my analysis Copper is on Correction ,So wait and sell at 500 - 500.60 Stop loss level at 501.60 Target Expected 497 / 493.70 / 492.30
Gann And Fibonacci Always rocks Follow us and support us and help us to grow tycooninfotek / tycoonstradingsecret

Crude oil Buy / Sell Based on FIBO / Gann - INTRADAYAs per my analysis Crude oil is on Buy Trend correction ,So after correction buy at 3046 Stop loss level at 3014 Target Expected 3101 / 3148
Gann And Fibonacci Always rocks Follow us and support us and help us to grow tycooninfotek / tycoonstradingsecret
