NIFTY 50 – 2H TF ANALYSIS FOR 10.02.26NIFTY currently trading around the 0.7 Fibonacci retracement (~25,838) which is acting as an immediate decision level.
📊 Market Structure:
• Overall structure still corrective (range bound after displacement)
• Sharp rejection candle near highs = possible distribution wick
• Price approaching higher timeframe supply
🧠 Key Levels:
🔼 Strong Supply Zone: 25,993 – 26,173
If price reaches this zone → look for bearish confirmation
🔽 Support Levels:
25,838 – Intraday decision level
25,477 – Major support (0.5 level)
24,573 – Swing low (liquidity pool)
📍 Trading Plan:
Bullish above 25,838 with continuation towards supply zone 25993-26173
Bearish only after rejection inside supply zone
Wait for confirmation (BOS / CHoCH / liquidity grab) — no blind entries.
Note: I am not a SEBI registered research analyst. Hence, this post is for Educational Purpose only.
Regards
Bull Man
Fibonacci Retracement

Chumtrades XAUUSD Has Wave B finished?GOLD – DAILY PLAN
Has Wave B finished?
→ No confirmation yet.
Macro & Market Sentiment
US–Iran negotiations have been cancelled. Geopolitical risks remain, but not strong enough to trigger a new bullish wave.
Gold experienced a relatively calm trading session, failed to break above the key level around 5,100, and saw a moderate pullback during the US session.
The Daily candle formed a Spinning Top, indicating market indecision and consolidation, with a lack of momentum for a breakout.
👉 Macro factors are supporting prices, but not pushing the market into an immediate uptrend.
Technical Structure & Outlook
Price is still moving within a descending price channel.
On the H1 timeframe, price has broken above the 4,888 key level, showing a technical rebound.
However, the higher timeframe structure remains bearish, with no confirmed trend reversal.
→ Therefore, current rebounds are considered pullbacks within a downtrend.
Key Levels
Support: 4,810 | 4,830 | 4,700–4,750 | 4,650–4,624
Resistance: 4,950–5,000 | 5,100
Trading Scenarios
Primary strategy: Sell the rallies within the descending channel.
Look for SELL setups near resistance zones, targeting lower lows.
Momentum SELL may be considered if price clearly breaks below 4,882–4,890, with confirmation on H2 or H4, targeting around 4,810.
No BUY positions while price remains inside the descending channel.
👉 Only if price breaks and holds above 5,100, will we start reassessing a trend-following BUY scenario.
👉 Deeper pullbacks are viewed as potential zones for swing BUY opportunities, not short-term buys at this stage.
Note: The market is in a “confidence-testing” phase. Focus on zone-based trading, trend alignment, reduced position size, and avoid FOMO.

Wave B Has Rebounded 15% Bottom Confirmed at 4,400?Wave B Has Rebounded 15% – Final Bottom or a Trap Before Wave C?
After a strong rally in yesterday’s Asian session, gold moved into consolidation during the European and US sessions, with a failed breakout late in the US session. In today’s Asian session, price broke above the 4,882–4,960 range, confirming it as a new buy-side base.
Gold has rebounded ~15% from the 4,404 area, driven by dip-buying demand and rising US–Iran geopolitical tensions, which remain a key catalyst alongside this week’s economic data.
From an Elliott Wave perspective, 4,400 marks the Wave A bottom. The market is now in a Wave B corrective rebound, with potential upside toward 5,140 – 5,200 – 5,220. Once Wave B completes, Wave C may follow, where signs of weakness and distribution will be watched to identify new swing-buy zones after the correction.
Support: 4,990–4,950 | 4,880–4,890 | 4,780–4,750 | 4,650–4,624
Resistance: 5,140 | 5,200 | 5,220
Note: Volatility remains elevated. Trade cautiously with strict risk and capital management.

Gold ATH after FOMC: Reaction or New Wave?Before the FOMC meeting, the market shared the same question:
would gold rally ahead of the meeting and then face a sharp sell-off afterward, or continue breaking higher and extend the trend?
After the FOMC, the Fed kept interest rates unchanged — which was not a surprise.
What really mattered was the Fed’s tone, and Powell clearly chose a balanced stance:
neither too dovish nor too hawkish.
More importantly, the Fed has effectively ruled out further rate hikes, while still maintaining a high interest-rate environment.
As a result, gold did not experience a heavy sell-off after the FOMC, and continues to hold its structure near the highs.
At this stage, market focus is shifting toward external risk factors:
The risk of a U.S. government shutdown
U.S.–Iran tensions
Ongoing trade war risks with major partners
Questions surrounding the independence of the Fed
👉 The current macro backdrop is not bearish for gold.
👉 SELL setups are reactionary, not the core narrative of the trend.
⏱️ H1 Observation Range
Lower bound: 5,415
Upper bound: 5,600
Price is consolidating near the highs with a wide range and may gradually push toward higher round-number levels.
🟢 Support / BUY zones
5,505 – 5,410 – 5,310 – 5,250 – 5,100
🔴 Resistance / Key observation zones
5,660–5,665 – 5,700 – 5,800 – 6,000
🧠 Primary scenario
Wide volatility → risk management is key.
SELLs are only short-term reactions at resistance.
BUY pullbacks to support to ride the broader move, not to pick the top.
⚠️ Key notes for the current phase
Reading the chart is a skill.
Reading the Fed is a strategy.
Reading Trump’s statements is survival.
Markets don’t reward being right —
they reward discipline and alignment with the trend.
👉 SELL to react — BUY to stay in the game.
📌 Follow me to track macro scenarios, key price levels, and the ongoing journey of finding opportunities in the market.

Gold at ATH before FOMC shakeout first or straight breakout?🧭 Macro Snapshot
Donald Trump maintains a hardline stance, increasing military presence in the Middle East → geopolitical risk remains elevated.
Tonight’s key focus: Federal Reserve
Political pressure and questions around Fed independence.
DXY continues to weaken, retesting major historical support (2020–2022) → supportive for gold.
👉 Conclusion: Geopolitics + a weaker USD set the bullish bias, while the Fed determines short-term volatility.
📊 Intraday Range to Watch
Upper range: 5,280 – 5,305
Lower range: 5,190 – 5,160
→ High probability of range trading and liquidity absorption ahead of the Fed decision.
🟢 Support
5,220–5,225 | 5,150–5,165 | 5,080–5,085 | 5,050–5,060
🔴 Resistance
5,280–5,294 | 5,300 | 5,315 | 5,380–5,385
⚠️ Strategy Notes
Expect possible fake moves / stop hunts within the range.
Avoid chasing highs or catching tops without confirmation.
Focus on price reaction at key levels and stay disciplined.
Summary: Gold is fundamentally supported, but today the key is how price reacts within 5,160–5,305.
Be patient — wait for confirmation — trade the reaction.

Next week: Will gold listen to the Fed… or the White House?🔎 Context
Next week could be highly volatile as monetary policy and geopolitics converge.
Donald Trump signaled a potential 100% tariff on Canadian goods if Canada moves closer to trade deals with China—raising trade-war risks.
At the same time, military assets are being deployed en masse around Iran, heightening concerns that tensions could escalate.
👉 Safe-haven flows may return, with gold potentially opening the week gap-up and early buying.
🧠 Quick take
Primary trend: Bullish
At elevated prices: a short, sharp shakeout is possible to absorb liquidity
No top/bottom calls—watch price reactions at key zones
📌 Key levels to watch
🟢 Supports: 4920–4900 | 4890–4882 | 4850–4830 | 4660–4640
🔴 Observation resistances: 5006–5030–5090 | 5110–5115 | Current ATH
🎭 Weekly scenarios (reference only)
Early week: Gap-up / early push
Pre-FOMC: Chop & liquidity sweep
Then: Deep shakeout or base-building and continuation
👉 Distribution at the top—or just a pause before the next leg higher?

Chumtrades XAUUSD H2 | Is the Liquidity Sweep Over?Chumtrades – XAUUSD H2 | Has the Liquidity Sweep Finished, or Is There More Downside Ahead?
On Friday, the market reacted strongly after Trump’s comments regarding Kevin Hassett, when Trump expressed his preference for Hassett to remain in his current role rather than taking a new position.
👉 As a result, gold printed a long wick liquidity sweep back into the prior ATH zone, around 4530–453X, before closing back above 456X.
This brings us to the key question:
Was this sweep enough for the BUY side, or is the market still looking to test lower levels?
Political developments will be a key driver for gold direction in the coming week.
📰 Key Political Factors to Monitor
1. Trump – Greenland
The US has imposed 10% tariffs, with the possibility of increasing them to 25% on countries that do not support the annexation of Greenland
No fixed deadline, tariffs remain until Greenland becomes part of the US
→ This is a supportive factor for gold, especially amid rising geopolitical uncertainty
→ This news may directly impact the market open
→ If price reacts strongly, avoid SELLs near resistance
2. Iran – Protests
Monitor the risk of Trump returning to direct intervention
→ A potential headline-driven volatility trigger
🟢 Key Support Zones to Watch
4530 – 4535
4515 – 4510
4480 – 4482
4462
4410 – 4407
🔴 Key Resistance Zones to Monitor
4618 – 4628
4648 – 4650
4655 – 4660
4698 – 4699
⚠️ Trading Notes
Price levels are zones for observation, not instant entry points
SELL setups around 462X must be evaluated based on news reaction
If momentum accelerates on headlines → stay flat and avoid trading against strength
💬 Question for the New Week
Is the market finishing its liquidity collection on the BUY side,
or was Friday’s sweep the final test before the next leg higher?
📌 Follow Chumtrades for proactive market analysis, structured trade planning, and risk management insights.

What is the Best Location / Area to Take a trade in the Markets I make educational content videos for trading
In this video I am sharing my experience on which areas are the best to trade with simple Price action using older than 3 months charts

Gold Before CPI: Top or Trap?Catching Gold’s Top Before CPI: A Good Trade or a Psychological Trap?
🧭 1. STRATEGIC CONTEXT
Primary trend: GOLD remains in an uptrend; the higher-timeframe structure is still intact.
Macro backdrop:
CPI tonight may cause short-term volatility.
However, geopolitics is currently a stronger driver than CPI.
Key geopolitical risks:
Greenland tensions → escalating global strategic rivalry.
Protests in Iran, power and internet cuts → rising Middle East risks.
👉 Strategic implication:
Gold continues to be supported as a safe-haven asset → pullbacks are for buying, not for chasing shorts.
📊 2. CURRENT MARKET STRUCTURE
Price is:
Holding the ascending trendline
Consolidating in a box, compressing ahead of CPI
Market condition:
High probability of false breakouts
Top-catching traps are very likely before the news
📍 3. KEY PRICE LEVELS
🔴 RESISTANCE
4,680 – 4,700
→ Previous high / ATH zone
→ Reactive sells only if clear rejection appears
4,655 – 4,660
→ Intermediate resistance, easily swept pre-CPI
🟣 CONSOLIDATION BOX
4,595 – 4,630
→ Sideways range ahead of CPI
→ No FOMO inside the box
🟢 SUPPORT
4,545 – 4,550 → Major confluence support
4,480 → Medium-term support, trendline retest
4,420 → Deep support, last bullish structure zone
📝 4. IMPORTANT NOTES
Higher CPI:
May trigger a technical pullback
❌ Does NOT automatically mean a top
Lower / in-line CPI:
Gold may consolidate above highs and break ATH
Selling before CPI:
→ Reactive scalps only, no holding
Buying:
→ Only when price reaches key zones with clear reaction
🎯 5. STRATEGIC MINDSET
❌ Don’t force top-catching while geopolitics supports gold
✅ Focus on risk management – wait for zones – wait for confirmation
🧠 Before CPI: survival > profit

Chumtrades XAUUSD Weekly Key Levels
Bias: Still favor BUY with the primary trend, watching for pullbacks to lower levels.
Support zones
4307 – 4300 (near-term support, key area to watch)
4260 – 4255 – 4250 (intermediate support)
4178 – 4168 (deep support, strong demand)
Resistance zones
4404 – 4413
4445 – 4465
4500 (ATH)
Weekly / Intraday scenario
Market is likely to trade in a range today.
Expected range:
Lower bound: 4300
Upper bound: 4513
👉 Overall strategy: Monitor price reaction at support zones, especially 4300 and below.

AWHCL: Signs of Trend ReversalThe stock of AWHCL has shown signs of recovery after a prolonged downtrend that began in September. Recent price action suggests a potential shift in momentum, supported by multiple technical factors across daily and weekly timeframes.
The stock has bounced from a long-term support level marked on the chart. The recent retracement from the swing high and higher low aligns with the 61.8% Fibonacci level, a zone often considered significant for trend continuation, indicating strong bullish momentum.
A bullish MACD crossover occurred on the daily chart last week, and notably, a weekly MACD crossover has been confirmed today. This dual timeframe alignment strengthens the bullish outlook.
The RSI readings support the bullish scenario, reflecting improving momentum without entering extreme overbought territory.
On the daily chart, the stock has managed to close above the 200DEMA, a key indicator of long-term trend strength which also seen by volume growth.
Key Levels to Monitor:
Support Zone: Around ₹417 (critical level for trend validation)
Resistance Zone: Near ₹632, which coincides with the 1.618 Fibonacci extension level, often viewed as a potential target in bullish setups.
Disclaimer: This analysis is intended for educational and informational purposes only. It does not constitute investment advice or a recommendation to buy, sell, or hold any financial instrument. Market participants should conduct independent research and consult a licensed financial advisor before making any investment decisions.

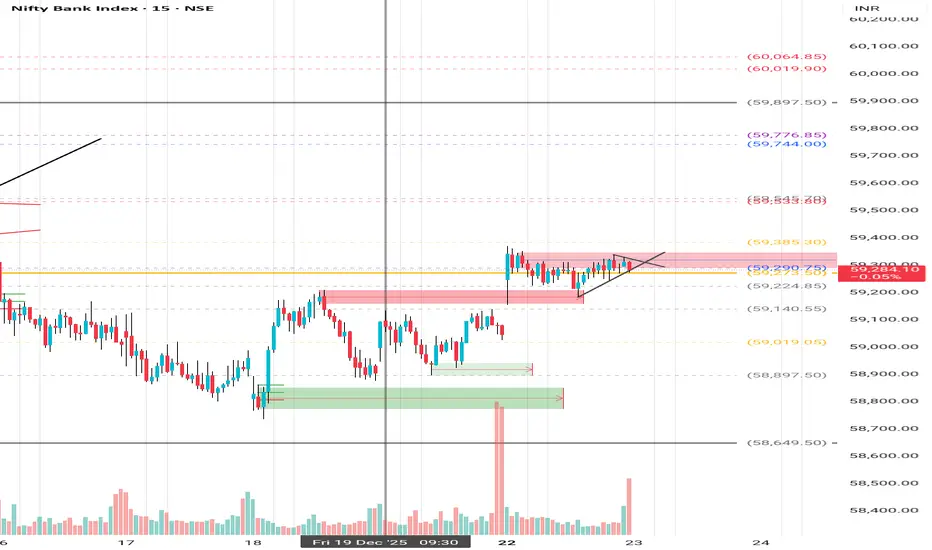
Bank Nifty - 23rd December Levels with TrendLines Bank Nifty – 23rd December Levels with Trendlines
Yesterday, only supply was created.
On Friday, that supply turned into demand.
If the market opens with a gap-up, then 23rd December supply will act as demand.
Check my Fibonacci levels – they are the most important for understanding the overall monthly direction.
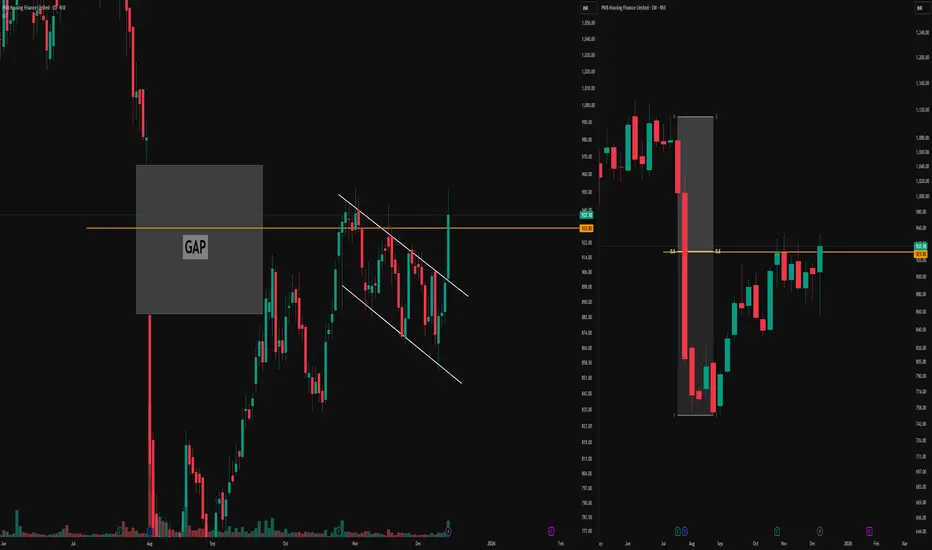
Parallel Channel, Stubborn Gap & 0.5 Equilibrium RejectionDaily Timeframe Details
The left chart on the daily timeframe displays a parallel channel structure forming after an initial one-sided move.
A significant gap emerged within this leg, which price has approached multiple times—first entering the gap area from below but rejecting sharply to form a higher low, then pushing toward a higher high without fully filling it.
This illustrates how gaps often resist easy fills from either direction, acting as persistent reference zones that demand confluence for interaction.
Weekly Timeframe Context
The right chart provides the weekly timeframe for the same instrument, highlighting repeated rejections at the 0.5 equilibrium level.
These weekly rejections align precisely with the daily gap interactions and channel boundaries, demonstrating how higher-timeframe equilibrium can underpin lower-timeframe price behavior without implying direction.
Such multi-timeframe alignment offers educational insight into structural references in market analysis.
This post serves purely educational and observational purposes and does not constitute buy, sell, or investment advice. Always conduct your own research.
ChumTrades XAUUSD intraday outlookXAUUSD – Intraday Plan (M15)
Market Context
Price is currently ranging in a very tight consolidation.
Momentum is weak → market favors intraday range trading rather than chasing breakouts.
Short-term structure remains intact; focus on price reaction at key levels.
Daily Strategy
Main approach: trade the range, trade the reaction.
Buy at predefined support / Fibonacci zones, sell at clear resistance.
If a breakout occurs, wait for a retest before following the move.
Avoid entries in the middle of the range.
Key Buy Zones
4246 – 4244 (Fibo 0.5)
4236 – 4233 (Fibo 0.618)
4210 – 4208 (deep support reaction)
❌ Bullish structure invalidation:
M15 close below 4200
Key Sell Zones
4300 – 4305 (psychological resistance)
4310 (Fibonacci extension – reaction sell)
Special Notes (Friday)
No major economic news today, but it is Friday – end of week.
Price action may become choppy and unpredictable, especially during the US session (a pattern seen in recent weeks).
Risk management is key:
Focus on short-term trades
Take profits early
Avoid holding positions over the weekend
Good luck Bro !

Chumtrades XAUUSD Outlook – Will Gold Continue Sideways Today?🎯 XAUUSD – Sideway Day Before FOMC
1️⃣ Market Context
H4 is clearly moving sideways: small candle bodies – long upper and lower wicks, indicating hesitation before FOMC (occurring the night of the 11th into the morning of the 12th).
The price is currently locked in the H4 range:
Lower boundary: 4176–4180
Upper boundary: 4215–4218
Today I am observing the price moving sideways within this range.
2️⃣ Intraday Trading Strategy
🟢 BUY low – priority
Watch for reactions at the zones:
4180 – 4182
4174 – 4178 (bottom of H4 range)
4155 – 415X (most attractive BUY zone)
→ Short target: 4200 – 4210
→ SL below support zone by 100 pips
🔻 SELL high – priority
Watch for reactions at:
4212 – 4218 (top of H4 range)
4230 – 4233 (strong resistance – most attractive sell zone)
→ Target: return to mid-range 4190 → bottom of range 417X
→ SL above resistance zone by 100 pips
The nearest zone is 4202-4198, this entry can be considered
3️⃣ Expected Movement
Today → Sideways within H4 box 4176 ⇆ 4212.
Just trade according to the range: buy low – sell high.
Expected daily fluctuation range is 50-55 prices.
A true breakout may occur tomorrow or the day after, as the market prepares for this week's FOMC.
📌 Note
Prioritize candle reactions at price zones.
Avoid FOMO in the middle of the range.
Divide positions smaller than usual as the market tightens before major news.
Find this analysis useful?
Press Follow to update the plan daily before trading hours and discuss more effective strategies!
Wishing everyone a day of total victory in trading!

NIFTY FMCG ON 1W TFBulls are trying very hard to sustain the Nifty FMCG above 0.50 fibo level.
We have recently seen Bullish engulfing and hammers at 0.50 fibo level. Let's see how it moves further. My view is bullish.
Note: This post is for education purpose only.

XAUUSD – Weekly outlookXAUUSD – Weekly outlook: structure points towards 4,580 as long as bulls hold the line
Brian – Favouring buy-the-dip setups while price holds above 3,996
1. Market overview – triangle break and trend confirmation
On the daily chart, gold has finally broken out of the long consolidation triangle, with Friday’s candle closing cleanly above the descending trendline that has capped price for weeks.
For me, this breakout is the first proper confirmation that the primary bullish trend is resuming.
The next major resistance on the chart sits around 4,246 – a key level I’m watching as a trend-confirmation line.
If price can break and hold above 4,246, the path towards the higher zone around 4,580 opens up, in line with the Fibonacci extension drawn on the chart.
In short: the structure into next week is bullish, with pullbacks seen as opportunities to position for a potential move towards new highs.
2. Technical structure – from breakout to extension targets
The breakout from the triangle comes after a sequence of higher lows bouncing off the rising trendline, indicating accumulation rather than distribution.
Below price, we have demand zones clustered around the 4,110 trendline area and deeper supports near 4,040 and 3,920.
Above price, the roadmap is fairly clear:
First, a test of 4,246 (local resistance & former supply).
Then the ATH / prior high region around 4,360–4,380.
Finally, the Fibonacci 1.618 extension projects into the 4,560–4,580 zone, which is my medium-term upside objective if bulls can maintain control.
As long as daily structure keeps printing higher highs and higher lows and price stays above the key invalidation at 3,996, I will continue to treat gold as buy-on-dip rather than looking for major tops.
3. Key zones & trading ideas for next week
I’m not treating this as a signal service, but here’s how I’m mapping the chart for my own trading:
Primary idea – Buy the dip into trendline / support
Watch zone: around the rising trendline near 4,110.
If price pulls back into this area early in the week and shows a clear rejection on H4/D1 (wick rejections, bullish engulfing etc.), I’ll be interested in building long positions.
Upside path:
First objective: 4,246 – trend-confirmation resistance.
If broken and retested from above, the next leg could extend towards 4,360–4,380.
Extension target: 4,560–4,580 in line with the 1.618 Fibonacci projection.
Secondary idea – Using Fibonacci zones on break above 4,246
If gold breaks and holds above 4,246, the Fibonacci zones between roughly 4,360 and 4,580 become interesting for scaling in / managing positions:
Partial profits or tight trailing stops can be considered as we approach 4,360–4,380.
Any healthy corrective pullback from that region that respects the rising structure could still offer add-on entries with the 4,580 zone as a medium-term target.
Invalidation:
A daily close below 3,996 would seriously damage this bullish structure and force me to reassess. Below that, I would step aside and wait for a new pattern rather than trying to force the long idea.
4. Fundamental backdrop – why gold still has a bid
From a macro point of view, gold is navigating a mix of:
Tariff and trade tensions, which keep hedging demand alive as investors look for protection against policy shocks.
Ongoing geopolitical risks and conflict, supporting gold’s role as a classic safe-haven asset.
A late-cycle interest-rate environment, where markets are increasingly focused on when and how aggressively central banks will adjust policy after a period of elevated rates and liquidity distortions.
This combination tends to limit the downside for gold: even when we see corrections, dip-buyers are never too far away, especially when the technical structure is aligned with the macro story.
5. Strategy & risk management
Into next week, my bias is clear: structure is bullish above 3,996, so I prefer buying pullbacks rather than trying to short into strength.
The trendline around 4,110 is my first area of interest for fresh longs; anything closer to 4,040–4,000 (if we see a deeper flush) would be considered an even better price, provided the daily structure doesn’t break.
As always, position sizing and stop placement are key – one good weekly move is far more valuable than several emotional entries trying to catch every candle.
What do you reckon – does this breakout have enough fuel to take us towards 4,580, or do you see a deeper correction setting up first? Feel free to share your view in the comments.

FVG Retracement With EMA, RSI & Fib Confluence📈 Bitcoin Chart – FVG Retracement With EMA, RSI & Fib Confluence in a Bearish Market Structure
This chart showcases a sustained bearish sequence on BTC, defined by a clean continuation of Lower Highs (LH) and Lower Lows (LL). Throughout this decline, multiple Fair Value Gaps (FVGs) have formed both locally and at higher levels — each created by strong institutional sell-side displacement.
As price trends downward, these unmitigated FVGs above the market consistently act as magnet zones:price retraces into previous inefficiencies, rebalances them, and resumes the dominant bearish trend.
In the current setup, the integration of FVGs + Fibonacci Retracement(Point A to B) + EMA Levels + RSI Momentum provides a highly structured roadmap for anticipating retracements and continuation points.
The most significant imbalance sits near the major Fib retracement zone and under key EMAs — making it the highest-probability reaction area. Secondary FVGs below it may still induce a bounce, but carry lower structural relevance.
⸻⸻⸻⸻⸻⸻⸻⸻⸻⸻
📊 Key Observations
1️⃣ Prior FVG Mitigation
A previously formed FVG under the EMA was cleanly filled, followed by immediate downside continuation.
This confirms bearish order-flow control and validates the role of FVGs as efficient retracement targets in a downtrend.
2️⃣ High-Priority FVG (Primary Zone)
The upper FVG holds the strongest confluence:
Created by strong displacement
Sits below the EMA50
Aligns with the 38.2%–61.8% Fib retracement zone
This cluster makes it the most likely zone for a meaningful bearish rejection if price retraces into it.
3️⃣ Secondary FVG Reaction Zone
A lower FVG also exists beneath the main zone.
Although it can cause a minor corrective bounce, it formed during a smaller move and does not align with the key trend or Fib levels — giving it lower probability.
4️⃣ RSI Momentum Context
RSI remains below 50, confirming bearish momentum.
When RSI stays under mid-line, bearish FVG reactions tend to be more reliable and continuation setups form cleanly.
5️⃣ Structural Context
The broader structure remains decisively bearish as long as price trades below the EMAs and below the major upper FVG.
Retracements into these zones are more likely to serve as rebalancing moves rather than genuine reversal attempts.
⸻⸻⸻⸻⸻⸻⸻⸻⸻⸻
📊 Chart Explanation
Symbol → BTCUSDT
Timeframe → 1D
This visualization illustrates how Smart Money Concepts apply cleanly during strong trending conditions:
A clear LH–LL downtrend
Several historical FVGs acting as retracement magnets
A previously mitigated FVG confirming bearish control
A high-confluence FVG aligned with EMAs and Fib levels
A secondary imbalance that can still induce short-term reactions
RSI showing momentum remains bearish
Together, these elements outline a textbook sequence:
displacement → inefficiency → retracement → rebalancing → continuation.
Price remains under firm bearish control unless it breaks above the upper FVG with conviction.
⸻⸻⸻⸻⸻⸻⸻⸻⸻⸻
📘 Using Fib Retracement, EMA50, and RSI With FVGs (Bullish + Bearish)
🔹 1. Fibonacci Retracement + FVG
In a downtrend, draw Fib from swing high → low; in an uptrend, draw low → high
The 38.2%–61.8% zone is the prime retracement area in both directions.
If an FVG forms or sits inside this Fib zone, it becomes a high-probability reaction point (bearish rejection in downtrend, bullish bounce in uptrend).
🔹 2. EMA50 + FVG
In a bearish trend, price and FVGs forming below EMA50 act as stronger bearish retracement zones.
In a bullish trend, price and FVGs forming above EMA50 act as stronger bullish retracement zones.
EMA50 acts as a mean reversion point where price often returns to rebalance before continuation.
🔹 3. RSI + FVG
RSI below 50 → bearish momentum → bearish FVG reactions are more reliable.
RSI above 50 → bullish momentum → bullish FVG reactions are more reliable.
If RSI rises from oversold (or falls from overbought), it often signals a retracement phase toward nearby FVGs.
🔹 4. Combined Logic (Works for Bullish and Bearish)
Displacement creates an FVG (inefficiency).
Price retraces into the 38–61% Fib zone.
Retracement taps EMA50 or stays on the correct side of EMA50 (below for bearish, above for bullish).
RSI confirms momentum (below 50 for bearish continuation, above 50 for bullish continuation).
Price rejects from the FVG and continues the trend.
⸻⸻⸻⸻⸻⸻⸻⸻⸻⸻
✅ Summary
Market structure remains bearish with consistent LHs and LLs.
A previously filled FVG under the EMA validated the continuation move.
The upper FVG is the highest-strength level due to EMA + Fib + displacement confluence.
A lower FVG exists but carries reduced importance.
RSI below 50 reinforces bearish momentum and reliability of bearish FVG reactions.
⸻⸻⸻⸻⸻⸻⸻⸻⸻⸻
⚠️ Disclaimer
📘 For educational purposes only.
🙅 Not SEBI registered.
❌ Not investment advice.
🧠 Smart-Money-Concepts explanation only.

BSE Ltd TargetsThe Recent expected Targets from BSE Ltd can be set at 3135 and 3438. If the stock hits resistance at this level then the support levels of this stock can be 2710 and 2600. Held this stock even when it hit lows in Aug and Sept as RSI indicated a reversal and it paid off.

Possibility Due To Weak TrendTrend Started Became Weak
I already for daytime frame
this 4h time frame channel breakdown already happened may take support from fib level 0.6 but possible to maybe price come to 0.7 level easily.
Reverse Scenario:
Break his channel high price level
🧠 Always DYOR (Do Your Own Research)
⚖️ This is not financial advice or suggestion
👉 “Risk Is Real 💸 Stay Practical🚀”
💬 Please feel free to ask any questions (It's Free)
BINANCE:STRKUSDT

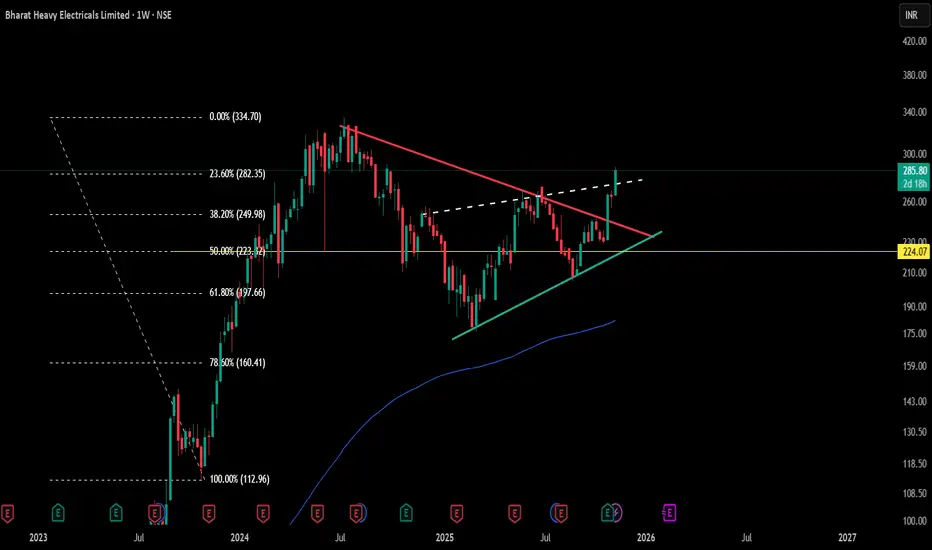
Symmetrical Triangle Structure & Key EquilibriumEditorial Insights
- Symmetrical triangles signal a balanced tug-of-war between buyers and sellers; this compression, as mapped here, often precedes significant expansions in volume and volatility.
- The triangular structure’s edges—CT (red) and trendline (green)—have been tested repeatedly over months, reflecting both supply absorption and demand resilience.
- The hidden white line adds a subtle layer of convergence, useful for traders identifying areas of potential liquidity concentration.
- The yellow 50% Fibonacci level frames the equilibrium for this market phase, offering a snapshot of price discovery dynamics within the triangle.
- Price positioning relative to all these lines is best seen as a way to monitor evolving order flow and market intent, without any explicit forecasting or directional bias.
Key Levels & Reference
- CT (Red): Major supply test points.
- Trendline (Green): Demand and higher low sequence.
- Hidden Line (White): Structural convergence not visibly obvious but influential.
- Fibonacci 50% (Yellow): Core equilibrium reflecting price agreement zone.
This post is for educational and analytical purposes, respecting the principle that all information is a visual observation—not a prediction or directional signal, but a live structure map to enrich your pattern playbook.
Sobha- A breakout of consolidation is on cardsRealty sector has been performing well post Q2 results announcements.
Sobha has posted stellar Q2 numbers but it might be one off quarter as well.
Technically, stock is looking ripe for a good flag breakout of consolidation.
We might soon see a breakout coming but sustainment of breakout is crucial for further upmove.
Levels are mentioned on chart. We can see upside of more than 50% if breakout sustains.
You can also check other realty sector stocks and see if any similar pattern is visible.
Please note that I am just NISM certified RA and not SEBI registered.
This analysis is not a recommendation but has been shared for educational purposes only.

Bullish Fibonacci Retracement Setup📈 Bullish Fibonacci Retracement Setup
Intro
The chart illustrates a classic Bullish Fibonacci Retracement structure — highlighting key swing points, retracement levels, and potential continuation zones.
Price action shows a healthy pullback within a larger uptrend, suggesting accumulation before a possible breakout move.
⸻⸻⸻⸻⸻⸻⸻⸻⸻⸻⸻⸻⸻
🟩 Chart Overview
• Point A → Represents the Swing Low , marking the starting point of the current upward move.
• Point B → Denotes the Swing High , where price faced resistance before retracing.
⸻⸻⸻⸻⸻⸻⸻⸻⸻⸻⸻⸻⸻
📊 Key Fibonacci Levels
1️⃣ Validation Line (78.60%) — Entry is confirmed when any two consecutive candles close above this level, signaling a strong breakout and bullish continuation.
2️⃣ Minimum Retracement (61.80%) — This level has been achieved, and two candles have successfully closed below it, confirming a valid retracement phase within the Fibonacci structure.
3️⃣ Devalidation Line (38.20%) — If any two candles close below this level, the Fibonacci setup becomes invalid.
⸻⸻⸻⸻⸻⸻⸻⸻⸻⸻⸻⸻⸻
🎯 Trail Levels
Trail Levels →
• Stop-loss will trail two levels below the current active level.
• Each target level is confirmed only when two consecutive candles close above it successfully .
⸻⸻⸻⸻⸻⸻⸻⸻⸻⸻⸻⸻⸻
✅ Summary
• Price is retracing within a strong bullish trend.
• A close above the 78.6% Validation Line confirms continuation.
• Structure remains valid as long as price holds above the 38.2% Devalidation Line.
• Trail progressively with momentum as higher targets activate.
⸻⸻⸻⸻⸻⸻⸻⸻⸻⸻⸻⸻⸻
⚠️ Disclaimer:
📘 For educational purposes only.
🙅 Not SEBI registered.
❌ Not a buy/sell recommendation.
🧠 Purely a learning resource.
📊 Not Financial Advice.
